In today’s fast-paced competitive business environment, quality is paramount. Whether you’re manufacturing products, providing services, or even managing a project, maintaining consistent quality is crucial for success. One of the most effective tools for ensuring and improving quality is Statistical Process Control (SPC). Let us find out how SPC plays a pivotal role in achieving and sustaining quality excellence.
Jump ahead to
Understanding Statistical Process Control (SPC)
Statistical Process Control is a systematic and data-driven methodology that focuses on monitoring and controlling processes to ensure they operate efficiently. They further focus on consistently producing products or delivering services of high quality. SPC relies on the use of statistical tools and techniques to measure, analyze, and control variations within a process. This helps organizations identify potential problems early, reduce defects, and improve overall performance.
Essential Tools for Successful Statistical Process Control
To implement SPC effectively, you need the right set of tools. These tools enable you to collect, analyze, and visualize data, making it easier to make informed decisions and maintain consistent quality. Let us explore some essential SPC tools that are instrumental in achieving process control and continuous improvement.
Control Charts
Control charts are the cornerstone of SPC. They provide a visual representation of process data over time, making it easy to identify trends, variations, and abnormalities. There are different types of control charts, including:
- X-Bar and R Charts: Used to monitor the central tendency (average) and variability of a process.
- P Charts: Designed for monitoring the proportion of defective items in a sample.
- C Charts: Ideal for tracking the count of defects in a sample.
- NP Charts: Specifically used when dealing with the number of defective items in a sample from a constant-sized lot.
Control charts help distinguish between common cause and special cause variations, enabling organizations to take appropriate action when needed.
Histograms
Histograms provide a graphical representation of data distribution. They help you understand the frequency and distribution of data points within a dataset. Histograms are particularly useful for identifying whether data follows a normal distribution, which is important for many statistical analyses in SPC.
Scatter Plots
Scatter plots are used to explore relationships between two variables. In SPC, they can help identify correlations and patterns that might not be evident from individual data points. Scatter plots are particularly useful when investigating potential causes of process variation.
Pareto Charts
Pareto charts are bar graphs that display data in descending order of importance. They are often used to identify the most significant factors contributing to a problem or variation within a process. Pareto analysis can help organizations prioritize improvement efforts effectively.
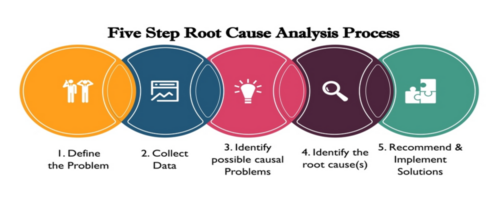
Fishbone Diagrams (Ishikawa Diagrams)
Fishbone diagrams are excellent tools for root cause analysis. They help teams identify potential causes of a problem by categorizing them into different branches. These categories often include people, processes, equipment, materials, and the environment. By visualizing potential causes, teams can focus their efforts on addressing the most critical issues.
Process Capability Analysis
Process capability analysis tools, such as Cp, Cpk, Pp, and Ppk indices, assess how well a process can produce products or deliver services within specification limits. These indices help organizations determine if their processes are capable of meeting customer requirements and provide insights into process improvement opportunities.
Run Charts
Run charts are used to display data over time and highlight trends and patterns. They are particularly helpful for tracking process performance and assessing the impact of process changes or improvements. Run charts help teams make data-driven decisions regarding process stability and improvement initiatives.
SPC Software
While not a single tool, SPC software is an essential component of successful SPC implementation. SPC software automates data collection, analysis, and reporting, streamlining the SPC process. It enhances data accuracy, reduces human errors, and provides real-time insights into process performance.
Why choose Statistical Process Control?
- Consistency and Reliability: SPC helps in maintaining consistency and reliability in processes. It ensures that the output remains within acceptable limits, reducing the chances of defects or errors. Consistency is key to meeting customer expectations and building trust.
- Early Detection of Variations: SPC allows organizations to detect variations and deviations from the norm early in the process. When variations are identified promptly, corrective actions can be taken before they lead to defects or subpar results, saving time and resources.
- Cost Reduction: Implementing SPC can lead to significant cost savings. By preventing defects, organizations can reduce material waste and labor costs to avoid expensive product recalls or customer complaints.
- Improved Decision-Making: SPC provides data-driven insights into the performance of processes. This data can be used for informed decision-making, process optimization, and continuous improvement. It enables organizations to make changes based on evidence rather than guesswork.
- Enhanced Productivity: When processes are stable and predictable, employees can work more efficiently. SPC reduces the need for constant supervision and firefighting, allowing teams to focus on value-added tasks rather than fixing problems.
- Customer Satisfaction: SPC helps in meeting or exceeding customer expectations by delivering consistent quality products or services. Satisfied customers are more likely to be loyal and recommend your business to others.
- Competitive Advantage: Organizations that implement SPC gain a competitive advantage in the marketplace. Consistently high-quality products or services set them apart from competitors and can command premium prices.
Conclusion
Statistical Process Control is not just a tool; it’s a mindset and a philosophy that emphasizes the importance of data-driven decision-making and continuous improvement. It empowers organizations to achieve and sustain quality excellence by monitoring, analyzing, and controlling variations in their processes. In today’s competitive landscape, businesses that prioritize SPC are better equipped to meet customer expectations, reduce costs, and gain a significant edge in the market. Quality managers possess comprehensive understanding of this technique, enabling such businesses to achieve quality excellence.