A study of site response in the Longmen Shan and adjacent regions and site response models for the Sichuan Basin
 Zhen Guo
 Martin Chapman
- 1School of Science, Jiangnan University, Wuxi, Jiangsu, China
- 2Department of Geosciences, Virginia Tech, Blacksburg, VA, United States
We investigated the regional attenuation and site responses in the Sichuan Basin and adjacent Songpan-Ganze terrane of the Tibetan Plateau using seismic data recorded at 41 stations from regional earthquakes occurring between January 2009 and October 2020. Fourier amplitude spectra of Lg waves were computed and binned into 18 frequency bins with center frequencies ranging from 0.1 Hz to 20.4 Hz. The quality factor is estimated as
Introduction
The Longmen Shan region is the most active seismic region in southwestern China, which has been struck by several big earthquakes since 2008, including the 12 May 2008 Ms 8.0 Wenchuan earthquake and the 20 April 2013 Ms 7.0 Lushan earthquake. The design seismic accelerations for most of the Longmen Shan and adjacent regions have been increased to 0.15–0.25 g in the latest version of seismic ground motion parameters zonation map of China issued in 2015 (AQSIQ 2001) whereas the values were 0.10–0.20 g in the previous version issued in 2001 (AQSIQ 2001). This requires that the seismic-proof demand should be raised one level or even two levels for these regions (Wang et al., 2018). Therefore, the Longmen Shan and adjacent regions, including the Sichuan Basin and Songpan-Garze Terrane (Figure 1), are currently exposed to high seismic hazard.
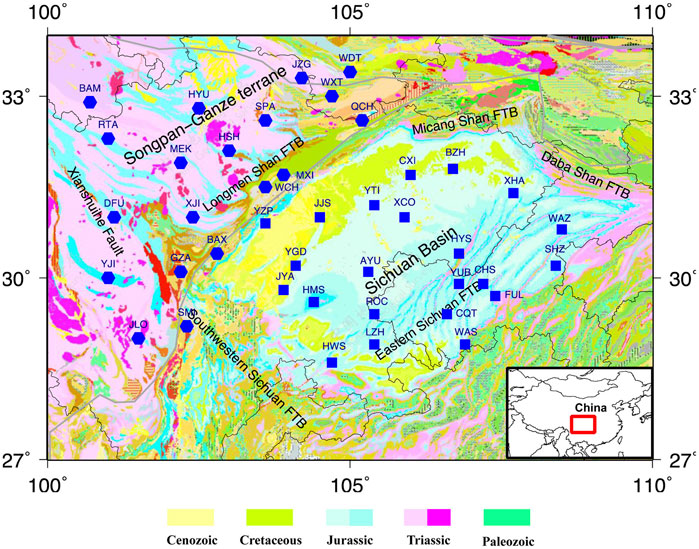
FIGURE 1. Geologic map of the Sichuan Basin and the Songpan-Ganze terrane, including the surrounding structural belts, Longmen Shan fold and thrust belt (FTB), Micang Shan FTB, Daba Shan FTB, Eastern Sichuan FTB and Southwestern Sichuan FTB. Locations of broadband stations used in this study are plotted as squares (in the Sichuan Basin) and hexagons (in the Songpan-Ganze terrane). The thick rectangle in the inset map shows the location of the study region. Geologic map is adapted from the 1:500,000 digital geological map of China, China Geological Survey (CGS, 2003).
Ground motion prediction equations or simulations of ground motion time series play essential roles in seismic hazard analysis and other seismic engineering problems. The seismic source spectrum, path effect and site response are the three key factors in determining earthquake ground motions, where site response describes the effects of local geological conditions. It has long been recognized that near-surface geological conditions can have significant effects on earthquake ground motions. Even for rock sites, the weathering and cracking of the bedrock will amplify ground motions in certain frequency range (Steidl et al., 1996; Castro et al., 2017). For sites on unconsolidated sediments, ground motions can be strongly amplified relative to nearby rock sites whereas the high-frequency ground motions will be attenuated significantly when the sedimentary layer is thick enough (Field et al., 1997; Borcherdt 2002; Frankel et al., 2002; Wang et al., 2013; Guo and Chapman 2019; Pratt and Schleicher 2021; Wang and Wen 2021; Wang et al., 2022). Developing regional models to account for the site response effects can be challenging due to the varying geological structures beneath the seismic stations. Correction factors based on Vs. 30, which is the averaged shear-wave velocity in the top 30 m under the site, are usually adopted in ground motion prediction equations to account for the site effects (Wen et al., 2010; Bora et al., 2016; Li et al., 2018a; Stewart et al., 2020; Xu et al., 2020).
Across the Longmen Shan, the crustal thickness increases sharply from ∼40 km in the western Sichuan Basin to ∼60 km in the Songpan-Ganze terrane with an elevation change of ∼5 km (Chen et al., 1986; Wang et al., 2007; Zheng et al., 2019; Wei et al., 2020). The Songpan-Ganze terrane is a triangular tectonic block located at the eastern margin of the Tibetan Plateau, west to the Longmen Shan thrust belt (Figure 1). This region is underlain by thick Paleozoic platform and surrounded by pre-Sinian continental basement (Zheng et al., 2016). The terrane is widely covered by Triassic marine deposits which were metamorphosed and strongly folded during late Triassic. Late Jurassic-Cenozoic sedimentary strata are lacking in this area but it does include several intrusive Miocene plutons along the deeply seated Xianshuihe fault (Chang 2000; Tian et al., 2016; Zheng et al., 2016). The Sichuan Basin is located to the east of Longmen Shan, which is a diamond-shaped compressional basin in central China and western Yangze Craton. The basin is underlain by Proterozoic rocks of the Yangtze Platform with a quite thick (up to 10 km) sedimentary cover of Mesozoic and Cenozoic marine and terrestrial sediments (Burchfiel et al., 1995; Guo et al., 1996; Meng et al., 2005; Wang et al., 2016; Xia et al., 2021). The Jurassic to Cretaceous sedimentary strata known as the “red beds,” reach a thickness of ∼4–6 km in the western and central basin (Guo et al., 1996; Sha et al., 2010; Li et al., 2016; Li et al., 2018b). Cenozoic sediments in the Sichuan Basin are less than 0.7 km thick and restricted to the southwestern foreland basins (Burchfiel et al., 1995; Kirby et al., 2002). The sedimentary deposits in the Sichuan Basin are characterized by wedge-shaped post-Late-Triassic strata thinning from the north and northwest towards the southeast underlain by layer-cake Early to Middle Triassic sedimentary sequences, with a total thickness varying from 2 to 10 km (Meng et al., 2005; Wang et al., 2016; Liu et al., 2021).
Previous studies have shown that the crustal quality factor, which is usually described as
For regions covered by thick sediments as the Sichuan Basin, various studies have shown that the site responses are most likely controlled by the structure of the whole sedimentary column. Fu et al. (2019) found that
The first objective of this paper is to compare site responses in the Songpan-Ganze terrane and Sichuan Basin due to the significantly different geological conditions. We downloaded broadband recordings from 189 regional earthquakes and computed the Fourier spectra of Lg waves which usually have the largest amplitudes in regional seismograms. Site responses and crustal attenuation were inverted simultaneously for the Sichuan Basin and Songpan-Ganze terrane respectively. The second objective of this paper is to introduce and evaluate site response models as functions of sediment thickness for the Sichuan Basin, which account for the effects of the thick sediments. In this paper, we focused on estimating the site responses and
Data and method
Dataset
The China Digital Seismological Observation Network includes 145 broadband stations from the national seismic network and 806 broadband stations from regional seismic networks which were deployed before the end of 2007. The average spatial distance for these permanent stations is ∼30–60 km except in Xinjiang and Tibet. 22 stations located in the Sichuan Basin and 19 stations in the Songpan-Ganze terrane were used in this study as shown in Figure 1. These stations have a common sample rate of 100 Hz and provide good coverage over the study region.
We collected broadband seismograms recorded at the stations from earthquakes with magnitudes
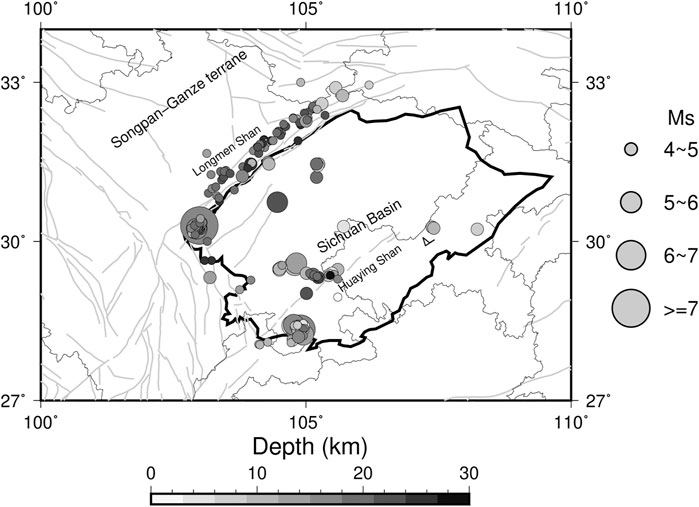
FIGURE 2. Map showing locations of the 189 earthquakes used in this study along with the earthquake source depths. Major faults in the study region are indicated by the gray lines. Magnitudes (Ms) of the earthquakes are used to scale the sizes of the circles.
To calculate the Fourier amplitude spectra of Lg waves, we adopted the following model for predicting Lg arrival time in the study region:
where r is the epicentral distance in km and
Figure 3 compares some examples of seismograms and Lg spectra recorded at stations in the Sichuan Basin and Songpan-Ganze terrane. In the top panel, we showed the horizontal-component seismograms and the corresponding Lg spectra recorded at station WAZ at the northeastern corner of the Sichuan Basin and station WXT in northeastern Songpan-Ganze terrane from the 18 December 2019 Ms 5.2 Zizhong, Sichuan earthquake. The acceleration amplitudes of Lg waves recorded at station WAZ are obviously smaller than station WXT though the epicentral distances are both ∼374 km, corresponding to strong attenuation of Lg Fourier amplitudes relative to WXT at frequencies higher than 6–8 Hz. At lower frequencies (<1–2 Hz), we observed amplifications in Lg spectral amplitudes at station WAZ compared to WXT. Similar low-frequency amplification and high-frequency attenuation in spectral amplitudes were observed in Lg waves recorded at station CXI in northwestern Sichuan Basin and station MXI at the eastern margin of the Songpan-Ganze terrane from the 17 June 2019 Ms 6.0 Changning earthquake in southern Sichuan with epicentral distance of ∼385 km. For further analysis, we computed the mean spectral amplitudes within 18 frequency intervals with center frequencies 0.1, 0.2, 0.3, 0.4, 0.56, 0.76, 1.06, 1.46, 2.06, 2.86, 4.06, 5.66, 7.26, 9.66, 12.86, 16.06, and 20.06 Hz respectively.
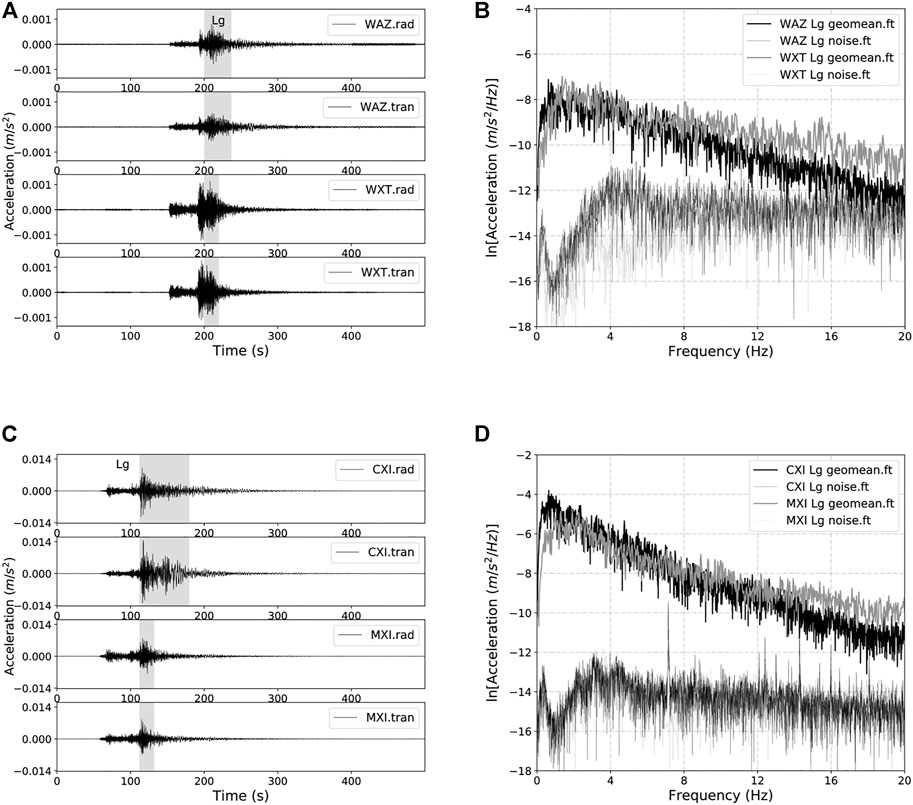
FIGURE 3. (A) Horizontal-component acceleration seismograms from the 18 December 2019 Ms 5.2 Zizhong earthquake recorded at stations WAZ (in northeastern Sichuan Basin) and WXT (in northeastern Songpan-Ganze terrane). The epicentral distances for both stations are ∼374 km. The shaded areas indicate time windows used for Lg spectral calculations. (B) Corresponding geometric mean of Lg and noise spectra at stations WAZ and WXT. (C) and (D) are the same as (A) and (B) but from the 17 June 2019 Ms 6.0 Changning earthquake recorded at station CXI (in northwestern Sichuan Basin) and station MXI (in eastern Songpan-Ganze terrane) with epicentral distances of ∼385 km.
Lg spectral analysis
The spectral amplitude of Lg waves at frequency
where
Our goal is to invert for the crustal quality factor
in which
Geometrical spreading of S and Lg waves at near-source distances is known to be complex due to the effects of radiation pattern, focal depth, source directivity and postcritical reflections from the Moho and intra-crustal velocity contrasts (Burger et al., 1987; Ou and Herrmann 1990; Atkinson and Mereu 1992; Atkinson and Boore, 2014). At larger distances, the Lg geometrical spreading can be simply modeled as
where
For inversion, we wrote Eq. 2 as the following:
The quality factor
where
Results
Q in the Sichuan Basin and Songpan-Ganze terrane
The Lg wave is typically the most prominent phase in seismograms at regional distances over continental paths. The Lg attenuation in the crustal wave guide was found to be sensitive to the lateral changes in crustal structure, intrinsic properties and deformation of the crust (Frankel 1991; Baqer and Mitchell 1998; Xie et al., 2006; Pasyanos et al., 2009; Zhao et al., 2010). Figure 4 shows the quality factor
for the Sichuan Basin, and
for the Songpan-Ganze terrane.
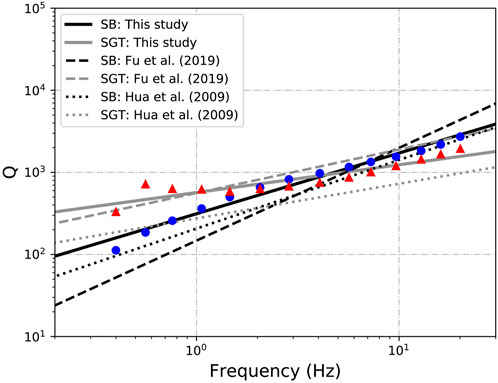
FIGURE 4. Q estimates of the Sichuan Basin (circles) and Songpan-Ganze terrane (triangles) in the frequency range of 0.4–20.04 Hz in this study. Results of least-square fits to the data are plotted as black solid line for the Sichuan Basin with
Site responses in the Sichuan Basin and Songpan-Ganze terrane
In Figure 5, we showed the site response terms of stations in the Sichuan Basin and Songpan-Ganze terrane. Site responses for most of the stations exhibit a wide frequency range of amplification instead of a distinguishable resonant peak and site responses in the Sichuan Basin are significantly different from those in the Songpan-Ganze terrane. The peak amplifications for sites in the Sichuan Basin mainly occur between 1 and 4 Hz, whereas they exist between 2 and 11 Hz for stations in the Songpan-Ganze terrane. This can be clearly observed in the average site response curves for the two regions shown in Figure 5. The average site response in the Sichuan Basin indicates strong amplifications over the frequency range up to ∼15 Hz while stations in the Songpan-Ganze terrane tend to amplify ground motions in the frequency range of 1.7–18 Hz. At frequencies lower than 1.7 Hz, average de-amplifications are observed for the Songpan-Ganze stations. The average site response in the Sichuan Basin shows much stronger amplification at low frequencies (<6 Hz) and more obvious attenuation at frequencies higher than 10 Hz relative to the Songpan-Ganze terrane. The average peak frequency for sites in the Sichuan Basin is ∼2 Hz with an amplification factor of ∼3.3 while it migrates to ∼7 Hz with a peak factor of ∼2.4 in the Songpan-Ganze terrane. For individual sites, the peak amplification factor could reach up to ∼10 in the Sichuan Basin. Fu et al. (2019) calculated site responses for 16 stations in western Sichuan Basin and 12 stations in eastern Songpan-Ganze terrane using the generalized inversion technique (GIT). Their results are similar to the site responses in our Figure 5.
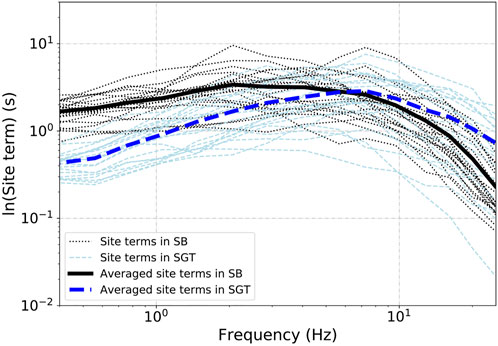
FIGURE 5. Site responses of individual stations in the Sichuan Basin (thinner dotted lines) and Songpan-Ganze terrane (thinner dashed lines) as functions of frequency. The average site response curves of stations in the Sichuan Basin and those in the Songpan-Ganze terrane are plotted as thick solid line and thick dashed line respectively.
Table 1 lists the estimates of
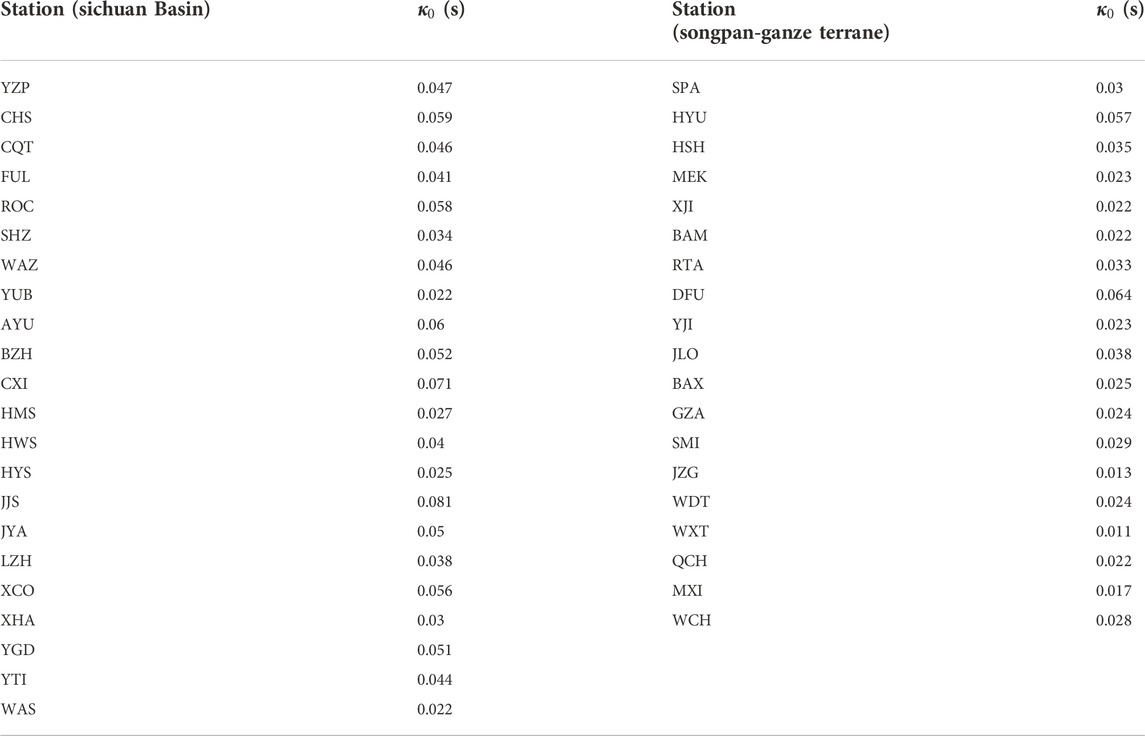
TABLE 1. Kappa (
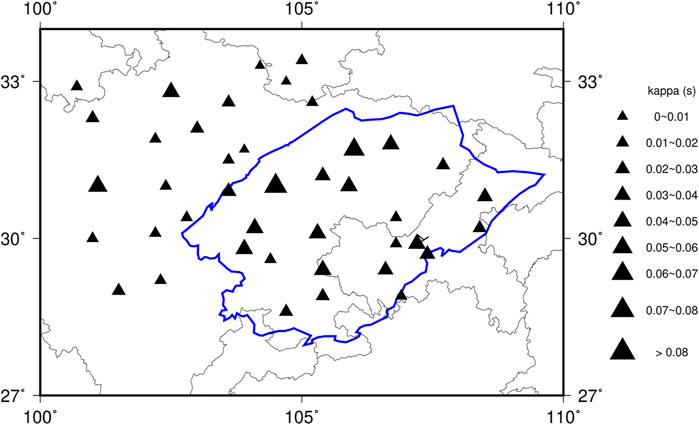
FIGURE 6.
Site response models for the Sichuan Basin
The Sichuan Basin is the most populated and industrialized area in southwestern China, and therefore exposed to higher seismic hazard than adjacent regions near the Longmen Shan fold and thrust belt. Developing appropriate ground motion prediction models for the Sichuan Basin is in urgent demand for seismic hazard analysis, which will require an appropriate site response model to account for the amplification and attenuation effects of the thick sediments in the basin.
Figure 7 shows site response terms versus frequency for four stations in the Sichuan Basin underlain by sedimentary columns of different thicknesses. As the sediment thickness increases, the peak frequency of amplifications generally migrates to lower frequencies and the amplitudes of amplifications become larger. At high frequencies (>10 Hz), we observed stronger attenuation effects at stations overlying thicker sediments. These observations imply that site responses in the Sichuan Basin are strongly correlated with sediment thickness.
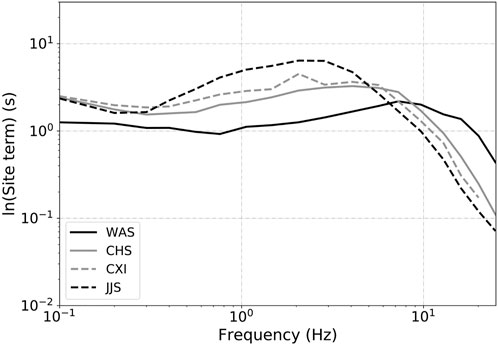
FIGURE 7. Comparison of site responses versus frequency of four stations WAS, CHS, CXI, and JJS in the Sichuan Basin. The thicknesses of sediments underlying stations WAS, CHS, CXI, and JJS are 2.0, 5.2, 7.7 and 10.0 km respectively. The value of sediment thickness is estimated as the thickness of the Cenozoic and Mesozoic sedimentary sequence based on results from Wu et al. (2016).
In Figure 8, we plotted the natural logarithms of the site terms derived from Lg Fourier spectra with respect to sediment thickness at nine center frequencies ranging from 0.1 to 20.06 Hz. Some patterns can be observed, even though the scatter is large. At lower frequencies (
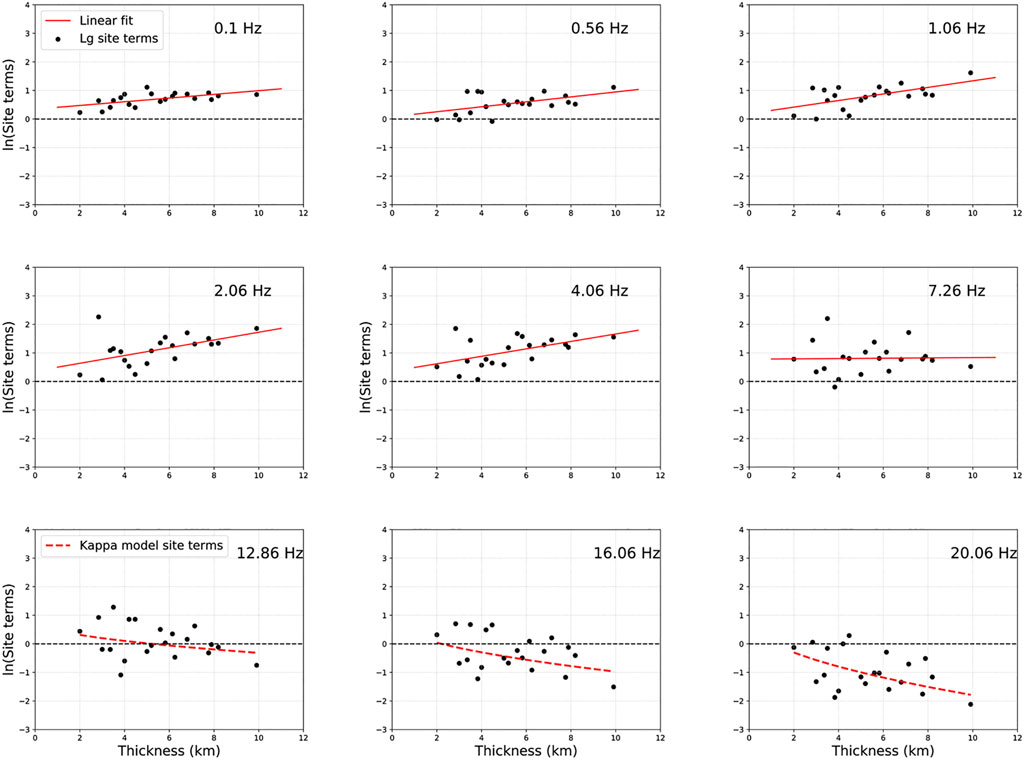
FIGURE 8. Natural logarithms of site terms (dots) estimated from linear regression of Eq. 8 using Lg waves for stations in the Sichuan Basin versus sediment thickness over frequency range 0.1–7.26 Hz. The solid lines indicate linear regression results of the Lg site terms with respect to sediment thickness. The dashed lines show estimates calculated using Eq. 6 and the
We model the site responses at frequency f in the Sichuan Basin using the following linear relationship between the natural logarithm of the site terms and sediment thickness:
where Z is sediment thickness in km. Eq. 9 is only used to model the site responses within the frequency range of 0.1–7.26 Hz and the linear regression results are plotted as solid lines in Figure 8. At higher frequencies, the site responses are controlled by
Here the units for
where
Table 2 lists the coefficients for linear regressions of the Lg site terms in the frequency range of 0.1–7.26 Hz. For comparison, we also listed the linear regression coefficients of all site response terms estimated from the three different methods in Table 2. Figure 9 shows some examples of site response models
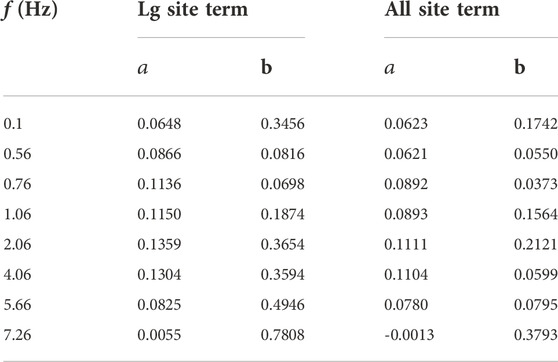
TABLE 2. Linear regression coefficients of natural logarithms of Lg site terms and all three sets of site terms as a function of sediment thickness in km at each center frequency (f).
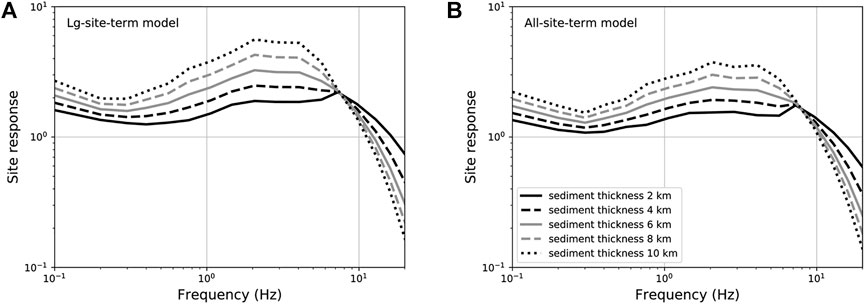
FIGURE 9. Site responses calculated using Eqs 9, 11 for sites in the Sichuan Basin with different sediment thicknesses.
Evaluation of the site response models
To evaluate the site response models defined by Eqs 9, 11 as functions of frequency and sediment thickness, we applied the models using the stochastic method of ground motion simulation for the Sichuan Basin following Guo and Chapman (2019). We selected six earthquakes occurring between October 2020 and June 2022 with magnitude (Ms) of 4.6–6.1 for analysis. Seismograms from these earthquakes were not included in the dataset for estimating the quality factor and site response: therefore, they can be used for an unbiased test of our attenuation and site response model. Detailed information for the six earthquakes was listed in Supplementary Table S3. Three of the earthquakes were located along the western boundary of the Sichuan Basin and the rest of them occurred in the southern part of the basin.
We first calculated the synthetic Fourier amplitude spectrum (i.e., target spectrum) for each station-event pair using Eq. 2 based on the stochastic method. The source and geometrical spreading terms are given by Eqs 3, 4, and the quality factor
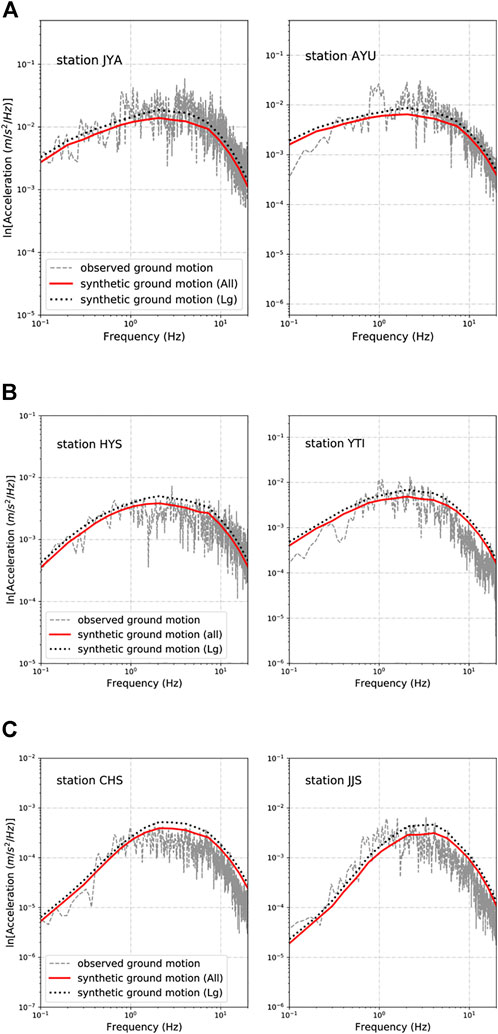
FIGURE 10. (A) The gray dashed lines show the Lg spectra recorded at stations JYA and AYU in the Sichuan Basin from the 1 June 2022 Ms 6.1 Lushan earthquake respectively. The dotted and solid lines indicate the corresponding target spectra calculated using Eq. 2 based on site response terms with Lg site term coefficients and all site term coefficients listed in Table 2 respectively. (B) The same as (A) but for Lg waves recorded at stations HYS and YTI in the Sichuan Basin from the 15 September 2021 Ms 6.0 earthquake. (C) The same as (A) and (B) but for Lg waves recorded at stations CHS and JJS in the Sichuan Basin from the 21 October 2020 Ms 4.6 earthquake in central Sichuan.
For further investigation, we computed three sets of residuals which are differences between the observed and target spectra for each station-event pair. Two sets of the residuals were calculated using target spectra based on site response models defined in Eqs 9, 11 with Lg site term and all site term coefficients respectively. We denoted these two sets of residuals as “Lg site term residuals” and “all site term residuals” hereafter. The third set of residuals were calculated using the site response term for generic rock sites defined as the following equation:
in which
Figure 11 shows the three sets of residuals versus sediment thickness at nine frequencies for the 1 June 2022 Ms 6.1 Lushan earthquake, which occurred near the southwestern corner of the Sichuan Basin. The rock site term residuals show a strong frequency dependence with positive amplitudes at frequencies lower than 4.06 Hz while the amplitudes decrease to negative values at higher frequencies (
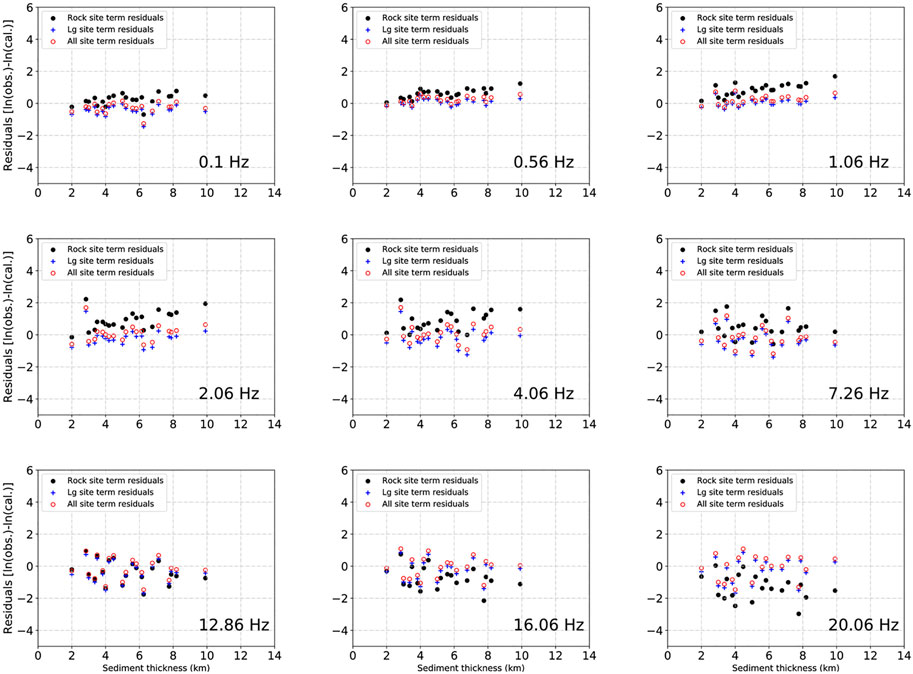
FIGURE 11. Rock site term residuals (filled circles), Lg site term residuals (pluses) and all site term residuals (open circles) of stations in the Sichuan Basin at different frequencies plotted with respect to sediment thickness in the basin for the 1 June 2022 Ms 6.1 Lushan earthquake.
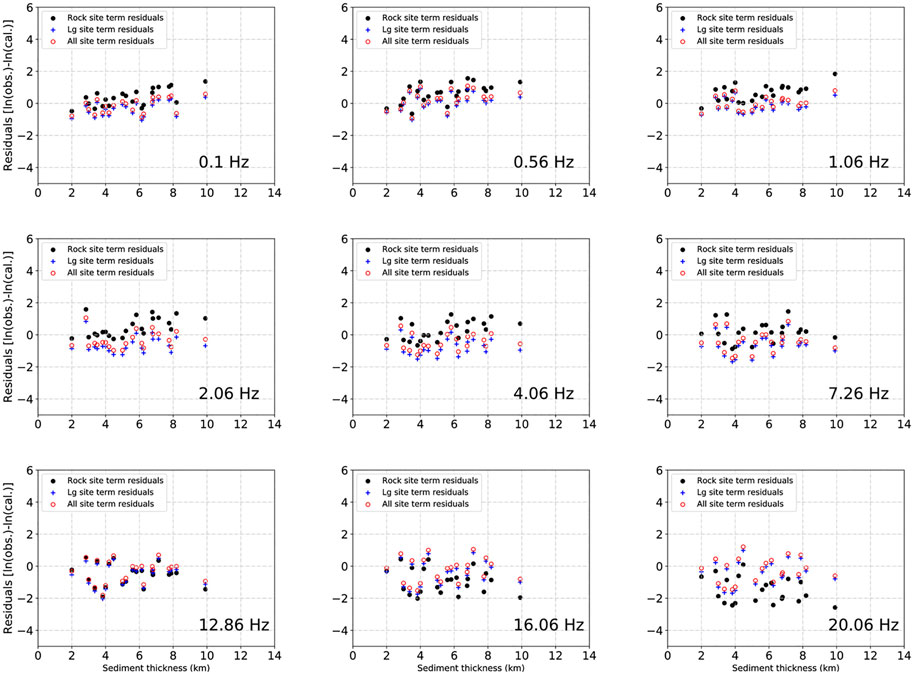
FIGURE 12. Same as Figure 11 but for the 21 October 2020 Ms 4.6 earthquake in central Sichuan.
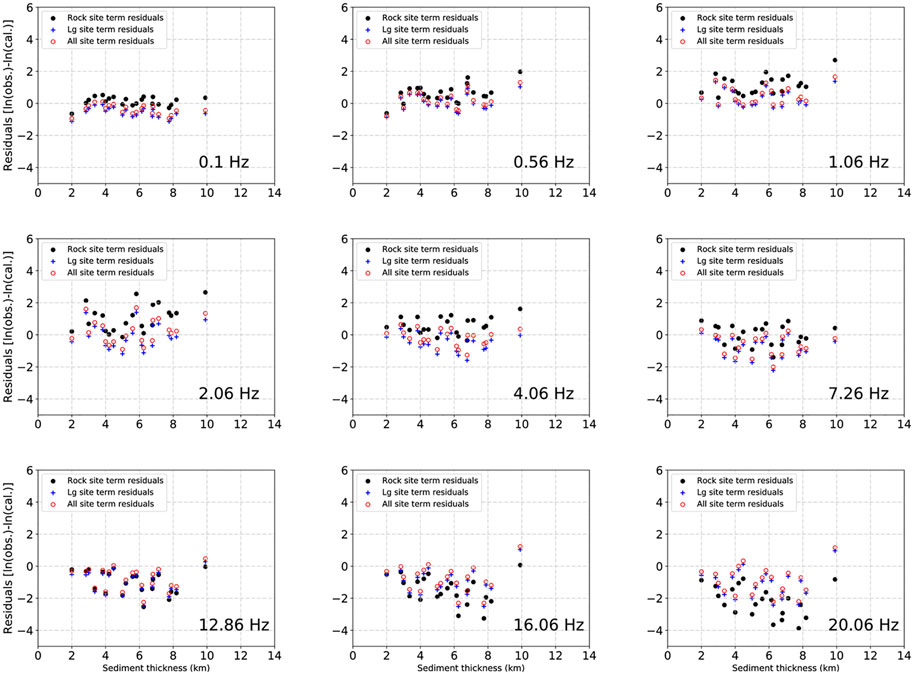
FIGURE 13. Same as Figure 11 but for the 15 September 2021 Ms 6.0 earthquake.
Conclusion
The crustal quality factor and site response in the Sichuan Basin and the Songpan-Ganze terrane were estimated using more than 5,800 three-component broadband seismograms from 189 earthquakes occurring between January 2009 and October 2020. We obtained
Data and resources
The seismic data used in this study are provided by Data Management Centre of China National Seismic Network at Institute of Geophysics (SEISDMC, doi:10.11998/SeisDmc/SN), China Earthquake Networks Center and AH, BJ, BU, CQ, FJ, GD, GS, GX, GZ, HA, HB, HE, HI, HL, HN, JL, JS, JX, LN, NM, NX, QH, SC, SD, SH, SN, SX, TJ, XJ, XZ, YN, ZJ Seismic Networks, China Earthquake Administration (http://www.esdc.ac.cn/; last accessed June 2022). We made some of the figures using the Generic Mapping Tools version 5.2.1 (GMT, Wessel et al., 2013) and Matplotlib version 1.5.1 (Hunter, 2007).
Data availability statement
The original contributions presented in the study are included in the article/Supplementary Material, further inquiries can be directed to the corresponding author.
Author contributions
ZG: The first author collected and processed all the seismic data used in the study. She wrote the manuscript and plotted all the figures in the paper. MC: The corresponding author wrote and tested the fortran programs for the inversion and provided fortran programs for calculating the residuals. He described and explained some of the results during oral communications. He also revised the manuscript.
Funding
This study was supported by the National Natural Science Foundation of China (Grant No. 42004035), the Natural Science Foundation of Jiangsu Province (Grant No. BK20200609), and the Fundamental Research Funds for the Central Universities (Grant No. JUSRP121050).
Acknowledgments
We thank the Earthquake Science Data Center for providing the seismic data. We thank the associate editor YR and two reviewers for comments that improved the study.
Conflict of interest
The authors declare that the research was conducted in the absence of any commercial or financial relationships that could be construed as a potential conflict of interest.
Publisher’s note
All claims expressed in this article are solely those of the authors and do not necessarily represent those of their affiliated organizations, or those of the publisher, the editors and the reviewers. Any product that may be evaluated in this article, or claim that may be made by its manufacturer, is not guaranteed or endorsed by the publisher.
Supplementary material
The Supplementary Material for this article can be found online at: https://www.frontiersin.org/articles/10.3389/feart.2022.1016096/full#supplementary-material
References
Anderson, J. G., and Hough, S. E. (1984). A model for the shape of the Fourier amplitude spectrum of acceleration at high frequencies. Bull. Seismol. Soc. Am. 74, 1969–1993.
AQSIQ (2001). GB18306—2011 seismic ground motion parameters zonation map of China. first edition. Beijing: Standard Press of China, 165–189. AvaliableAt: https://www.nssi.org.cn/nssi/front/5138636.html.
Atkinson, G. M., and Mereu, R. F. (1992). The shape of ground motion attenuation curves in southeastern Canada. Bull. Seismol. Soc. Am. 82 (5), 2014–2031. doi:10.1785/bssa0820052014
Atkinson, G. M., and Boore, D. M. (2014). The attenuation of Fourier amplitudes for rock sites in eastern North America. Bull. Seismol. Soc. Am. 104, 513–528. doi:10.1785/0120130136
Baqer, S., and Mitchell, B. (1998). Regional variation of. Pure Appl. Geophys. 153 (4), 613–638. doi:10.1007/s000240050210
Bora, S. S., Scherbaum, F., Kuehn, N., and Stafford, P. (2016). On the relationship between Fourier and response spectra: Implications for the adjustment of empirical ground-motion prediction equations (GMPEs). Bull. Seismol. Soc. Am. 106 (3), 1235–1253. doi:10.1785/0120150129
Borcherdt, R. D. (2002). Empirical evidence for acceleration-depen- dent amplification factors. Bull. Seismol. Soc. Am. 92, 761–782. doi:10.1785/0120010170
Boore, D. M., and Thompson, E. M. (2015). Revisions to some parameters used in stochastic-method simulations of ground motion. Bull. Seismol. Soc. Am. 105, 1029–1041. doi:10.1785/0120140281
Brune, J. N. (1970). Tectonic stress and the spectra of seismic shear waves from earthquakes. J. Geophys. Res. 75, 4997–5009. doi:10.1029/jb075i026p04997
Burchfiel, B. C., Chen, Z. L., Liu, Y. P., and Royden, L. H. (1995). Tectonics of the longmen Shan and adjacent regions, central China. Int. Geol. Rev. 37 (8), 661–735. doi:10.1080/00206819509465424
Burger, R. W., Somerville, P. G., Barker, J. S., Herrmann, R. B., and Helmberger, D. V. (1987). The effect of crustal structure on strong ground motion attenuation relations in eastern North America. Bull. Seismol. Soc. Am. 77, 420–439.
Campbell, K. W. (2009). Estimates of shear-wave Q and 0 for unconsolidated and semiconsolidated sediments in eastern north Americafor unconsolidated and semiconsolidated sediments in eastern north America. Bull. Seismol. Soc. Am. 99 (4), 2365–2392. doi:10.1785/0120080116
Castro, R. R., Stock, J. M., Hauksson, E., and Clayton, R. W. (2017). Source functions and path. Report.
Chang, E. Z. (2000). Geology and tectonics of the songpan-ganzi fold belt, southwestern China. Int. Geol. Rev. 42 (9), 813–831. doi:10.1080/00206810009465113
Chang, S. C., Wen, K. L., Huang, M. W., Kuo, C. H., Lin, C. M., Chen, C. T., and Huang, J. Y. (2019). The high-frequency decay parameter (Kappa) in Taiwan. Pure Appl. Geophys. 176, 4861–4879. doi:10.1007/s00024-019-02219-y
Chapman, M., and Conn, A. (2016). A model for Lg propagation in the Gulf Coastal Plain of the southern United States. Bull. Seismol. Soc. Am. 106 (2), 349–363. doi:10.1785/0120150197
Chapman, M., and Guo, Z. (2021). A response spectral ratio model to account for amplification and attenuation effects in the atlantic and Gulf Coastal Plain. Bull. Seismol. Soc. Am. 111 (4), 1849–1867. doi:10.1785/0120200322
Chen, X. B., Wu, Y. Q., Du, P. S., Li, J. S., Wu, Y. R., and Jiang, G. F. (1986). “Crustal velocity structure at two sides of Longmenshan tectonic belt (in Chinese),” in Developments in the research of deep structure of China’s continent (Beijing: Seismol. Press), 112–127.
Field, E. H., Johnson, P. A., Beresnew, l. A., and Zeng, Y. (1997). Nonlinear ground-motion amplification by sediments during the 1994 Northridge earthquake. Nature 390 (11), 599–602. doi:10.1038/37586
Frankel, A. D., Carver, D. L., and Williams, R. A. (2002). Nonlinear and linear site response and basin effects in Seattle for the M 6.8 Nisqually, Washington, earthquake. Bull. Seismol. Soc. Am. 92 (6), 2090–2109. doi:10.1785/0120010254
Frankel, A. (1991). Mechanisms of seismic attenuation in the crust: Scattering and anelasticity in New York state, south Africa, and southern California. J. Geophys. Res. 96, 6269–6289. doi:10.1029/91jb00192
Fu, L., and Li, X. (2016). The characteristics of high-frequency attenuation of shear waves in the Longmen Shan and adjacent regions. Bull. Seismol. Soc. Am. 106 (5), 1979–1990. doi:10.1785/0120160002
Fu, L., Li, X., Wang, F., and Chen, S. (2019). A study of site response and regional attenuation in the Longmen Shan region, eastern Tibetan Plateau, SW China, from seismic recordings using the generalized inversion method. J. Asian Earth Sci. 181, 103887. doi:10.1016/j.jseaes.2019.103887
Fu, L., Li, X. J., Rong, M. S., Chen, S., and Zhou, Y. (2018). Parameter estimation of ground-motion prediction model in Longmen Shan region based on strong motion data. Acta Seismol. Sin. 40, 374–386. doi:10.11939/jass.20170215
Guo, Z., and Chapman, M. C. (2019). An examination of amplification and attenuation effects in the Atlantic and Gulf Coastal Plain using spectral ratios. Bull. Seismol. Soc. Am. 109 (5), 1855–1877. doi:10.1785/0120190071
Guo, Z., Guan, M., and Chapman, M. C. (2022). Amplification and attenuation due to geologic conditions in the Sichuan Basin, central China. Seismol. Res. Lett. XX, 1–15. doi:10.1785/0220220030
Guo, Z. W., Deng, K., and Han, Y. (1996). Formation and evolution of the Sichuan Basin. Beijing: Geologic Publishing House, 200.
Harmon, J., Hashash, Y. M. A., Stewart, J. P., Rathje, E. M., Campbell, K. W., and Silva, W. J. (2019). Site amplification functions for central and eastern North America—Part II: Modular simulation-based models. Earthq. Spectra 35 (2), 815–847. doi:10.1193/091117EQS179M
Hua, W., Chen, Z. L., and Zheng, S. H. (2009). A study on segmentation characteristics of aftershock source parameters of Wenchuan M8.0 earthquake in 2008. Chin. J. Geophys. 52, 365–371. doi:10.1002/cjg2.1334
Hunter, J. D. (2007). Matplotlib: A 2D graphics environment. Comput. Sci. Eng. 9 (3), 90–95. doi:10.1109/mcse.2007.55
Kennett, B. L. N. (1986). Lg waves and structural boundaries. Bull. Seismol. Soc. Am. 76, 1133–1141.
Kirby, E., Reiners, P. W., Krol, M. A., Whipple, K. X., Hodges, K. V., and Farley, K. A. (2002). Late Cenozoic evolution of the eastern margin of the Tibetan Plateau: Inferences from 40Ar/39Ar and (U-Th)/He thermochronology. Tectonics 21, 1–20. doi:10.1029/2000TC001246
Li, J., Zhou, B., Rong, M., Chen, S., and Zhou, Y. (2020). Estimation of source spectra, attenuation, and site responses from strong-motion data recorded in the 2019 changning earthquake sequence. Bull. Seismol. Soc. Am. 110 (2), 410–426. doi:10.1785/0120190207
Li, X., Zhai, C., Wen, W., and Xie, L. (2018a). Ground motion prediction model for horizontal PGA, 5% damped response spectrum in sichuan-yunnan region of China. J. Earthq. Eng. 24, 1829–1866. doi:10.1080/13632469.2018.1485600
Li, Y., He, D., Li, D., Lu, R., Fan, C., and Sun, Y. (2018b). Sedimentary provenance constraints on the jurassic to cretaceous paleogeography of Sichuan Basin, SW China. Gondwana Res. 60, 15–33. doi:10.1016/j.gr.2018.03.015
Li, Y. Q., He, D. F., Chen, L. B., Mei, Q. H., Li, C. X., and Zhang, L. (2016). Cretaceous sedimentary ba- sins in sichuan, SW China: Restoration of tectonic and depositional environments. Cretac. Res. 57, 50–65. doi:10.1016/j.cretres.2015.07.013
Li, Z. W., Xu, Y., Huang, R. Q., Hao, T. Y., Xu, Y., Liu, J. S., et al. (2011). Crustal P-wave velocity structure of the Longmen Shan region and its tectonic implications for the 2008 Wenchuan earthquake. Sci. China Earth Sci. 54, 1386–1393. doi:10.1007/s11430-011-4177-2
Liu, S., Yang, Y., Deng, B., Zhong, Y., Wen, L., Sun, W., et al. (2021). Tectonic evolution of the Sichuan Basin, southwest China. Earth. Sci. Rev. 213, 103470. doi:10.1016/j.earscirev.2020.103470
Liu, Z., Wuenscher, M. E., and Herrmann, R. B. (1994). Attenuation of body waves in the central New Madrid seismic zone. Bull. Seismol. Soc. Am. 84, 1112–1122.
Meng, Q. R., Wang, E. C., and Hu, J. M. (2005). Mesozoic sedimentary evolution of the northwest Sichuan basin: Implication for continued clockwise rotation of the South China block. Geol. Soc. Am. Bull. 117, 396–410. doi:10.1130/b25407.1
Ou, G. B., and Herrmann, R. B. (1990). A statistical model for ground motion produced by earthquakes at local and regional distances. Bull. Seismol. Soc. Am. 80 (6A), 1397–1417. doi:10.1785/bssa08006a1397
Pasyanos, M. E., Matzel, E. M., Walter, W. R., and Rodgers, A. J. (2009). Broad-bandLgattenuation modelling in the Middle East. Geophys. J. Int. 177, 1166–1176. doi:10.1111/j.1365-246x.2009.04128.x
Pratt, T. L., and Schleicher, L. S. (2021). Characterizing ground- motion amplification by extensive flat-lying sediments: The seismic response of the eastern U.S. Atlantic Coastal Plain strata. Bull. Seismol. Soc. Am. 111, 1795–1823. doi:10.1785/0120200328
Sha, J. G., Shi, X. Y., Zhou, Z. H., and Wang, Y. D. (2010). The terrestrial triassic and jurassic sys- tems in the Sichuan Basin. ChinaHefei: University of Science & Technology of China Press, 1–214.
Steidl, J. H., Tumarkin, A. G., and Archuleta, R. J. (1996). What is a reference site? Bull. Seismol. 86, 1733–1748.
Stewart, J. P., Parker, G. A., Atkinson, G. M., Boore, D. A., Hashash, Y. M. A., and Silva, W. J. (2020). Ergodic site amplification model for central and eastern North America. Earthq. Spectra 36 (1), 42–68. doi:10.1177/8755293019878185
Tian, Y., Kohn, B. P., Phillips, D., Hu, S., Gleadow, A. J. W., and Carter, A. (2016). Late Cretaceous–earliest Paleogene deformation in the Longmen Shan fold- and-thrust belt, eastern Tibetan Plateau margin: Pre-Cenozoic thickened crust? Tectonics 35, 2293–2312. doi:10.1002/2016TC004182
Wang, C.-Y., Han, W.-B., Wu, J.-P., Lou, H., and Chan, W. W. (2007). Crustal structure beneath the eastern margin of the Tibetan Plateau and its tectonic implications. J. Geophys. Res. 112, B07307. doi:10.1029/2005JB003873
Wang, H., Xie, L., Wang, S., and Ye, P. (2013). Site response in the Qionghai Basin in the wenchuan earthquake. Earthq. Eng. Eng. Vib. 12, 195–199. doi:10.1007/s11803-013-0162-4
Wang, H., Li, C., Wen, R., and Ren, Y. (2022). Integrating effects of source-dependent factors on sediment-depth scaling of additional site amplification to ground-motion prediction equation. Bull. Seismol. Soc. Am. 112 (1), 400–418. doi:10.1785/0120210134
Wang, H., Ren, Y., and Wen, R. (2018). Source parameters, path attenuation and site effects from strong-motion recordings of the Wenchuan aftershocks (2008-2013) using a non-parametric generalized inversion technique. Geophys. J. Int. 212, 872–890. doi:10.1093/gji/ggx447
Wang, H., and Wen, R. (2021). Attenuation and basin amplification revealed by the dense ground motions of the 12 July 2020 MS 5.1 Tangshan, China, earthquake. Seismol. Res. Lett. 94 (2), 2109–2121. doi:10.1785/0220200400
Wang, M. M., Hubbard, J., Plesch, A., Shaw, J. H., and Wang, L. N. (2016). Three-dimensional seismic velocity structure in the Sichuan basin, China. J. Geophys. Res. Solid Earth 121 (2), 1007–1022. doi:10.1002/2015jb012644
Wei, Z., Chu, R., Chen, L., Wu, S., Jiang, H., and He, B. (2020). The structure of the sedimentary cover and crystalline crust in the Sichuan Basin and its tectonic implications. Geophys. J. Int. 223 (3), 1879–1887. doi:10.1093/gji/ggaa420
Wen, R., Ren, Y., Zhou, Z., and Shi, D. (2010). Preliminary site classification of free-field strong motion stations based on Wenchuan earthquake records. Earthq. Sci. 23, 101–110. doi:10.1007/s11589-009-0048-8
Wessel, P., Smith, W. H. F., Scharroo, R., Luis, J. F., and Wobbe, F. (2013). Generic mapping Tools: Improved version released. Eos Trans. AGU. 94, 409–410. doi:10.1002/2013eo450001
Wu, W. W., Su, J. R., Wei, Y. L., Wu, P., Li, J., and Sun, W. (2016). Discussion on attenuation characteristics, site response and magnitude determination in Sichuan. Seimol. Geol. 38, 1005–1018. doi:10.3969/j.issn.0253-4967.2016.04016
Xia, X., Li, Z., Bao, F., Xie, J., Shi, Y., You, Q., et al. (2021). Sedimentary structure of the Sichuan Basin derived from seismic ambient noise tomography. Geophys. J. Int. 225, 54–67. doi:10.1093/gji/ggaa578
Xie, J., Wu, Z., Liu, R., Schaff, D., Liu, Y., and Liang, J. (2006). Tomographic regionalization of crustal Lg Q in eastern Eurasia. Geophys. Res. Lett. 33, L03315. doi:10.1029/2005GL024410
Xu, P., Ren, Y., Wen, N., and Wang, H. (2020). Observations on regional variability in ground-motion amplitude from six mw ∼ 6.0 earthquakes of the north–south seismic zone in China. Pure Appl. Geophys. 177, 247–264. doi:10.1007/s00024-019-02176-6
Zhao, L.-F., Xie, X.-B., Wang, W.-M., Zhang, J.-H., and Yao, Z.-X. (2010). Seis- mic Lg-wave Q tomography in and around Northeast China. J. Geophys. Res. 115, B08307. doi:10.1029/2009JB007157
Zheng, C., Zhang, R., Wu, Q., Li, Y., Zhang, F., Shi, K., et al. (2019). Variations in crustal and uppermost mantle structures across eastern Tibet and adjacent regions: Implications of crustal flow and asthenospheric upwelling combined for expansions of the Tibetan plateau. Tectonics 38, 3167–3181. doi:10.1029/2018TC005276
Keywords: ground motion prediction, site response, sediment thickness, Sichuan Basin, attenuation
Citation: Guo Z and Chapman M (2023) A study of site response in the Longmen Shan and adjacent regions and site response models for the Sichuan Basin. Front. Earth Sci. 10:1016096. doi: 10.3389/feart.2022.1016096
Received: 10 August 2022; Accepted: 21 September 2022;
Published: 05 January 2023.
Edited by:
Yefei Ren, Institute of Engineering Mechanics, China Earthquake Administration, ChinaCopyright © 2023 Guo and Chapman. This is an open-access article distributed under the terms of the Creative Commons Attribution License (CC BY). The use, distribution or reproduction in other forums is permitted, provided the original author(s) and the copyright owner(s) are credited and that the original publication in this journal is cited, in accordance with accepted academic practice. No use, distribution or reproduction is permitted which does not comply with these terms.
*Correspondence: Martin Chapman, mcc@vt.edu