1. Introduction
The intertwined nature of chemical production, power generation, and carbon capture promotes the study of these systems under an integrated purview. Chemical production of dense energy carriers (DECs), such as hydrogen, ammonia, and methanol, can reduce the energy storage requirement to address the problem of intermittency characteristic of renewable energy generation [
1,
2]. Moreover, carbon dioxide sequestration can be used to prolong the use of abundant natural gas resources, albeit in configurations that reduce carbon emissions [
3]. Nonetheless, a complete departure from hydrocarbon sources could ignore the short-term necessity of fuels for high-heat applications, in transportation, and in metal refining, for example [
4].
Methanol produced from captured CO
2 can serve as a precursor to fuel production through gas-to-liquid (GTL) processes, which have the potential to significantly reduce the need to recover virgin fuel while providing a low-carbon pathway for meeting the energy demand for transportation [
5]. Notwithstanding the fact that many of the processes considered in this study, such as the catalytic production of methanol from captured carbon dioxide and green hydrogen, are still in the early phases of development, transition scenarios can be posited wherein the techno-economic maturity of the proposed processes progresses at disparate rates through different levels of promotion and cooperation [
6]. Furthermore, given the scope of the problem and sizable system expenditure, it becomes important to understand how seemingly disparate value chains interact on a regional scale. This also allows us to identify some focus areas for research and development to address specific technical gaps that may restrict the transition [
7].
The presented work describes a multiperiod mixed-integer linear programming (MILP) framework to evaluate the evolution and potential integration of hydrogen production, renewable power generation, and carbon capture, utilization, and sequestration (CCUS). Notably, the framework comprehensively accounts for direct carbon emissions. Furthermore, carbon credits are considered, as proposed by the 45Q amendment, at two different levels. Novel technologies that are currently in their early phases of development, such as direct air capture (DAC) and the catalytic production of methanol (MEFC) [
8], are introduced as the planning horizon progresses.
Moreover, distinct cost scenarios are considered. For some key technologies in the power systems block, the cost trajectories are adopted from the NREL Annual Technology Baseline [
9], which defines three scenarios driven by different levels of push for technical innovation through research expenditure and policy push. On the other hand, the cost trajectories for other processes are assigned depending on their current technology readiness level (TRL).
The proposed model (1) addresses the variability in renewable power potential explicitly; (2) allows for both energy storage and material storage with distinct spatio-temporal characteristics and constraints; (3) integrates carbon capture, utilization, and storage (CCUS), the production of hydrogen through both the green and blue pathways, and renewable power generation; (4) considers tax credits as per the 45Q amendment, with an update in the mid-term; and (5) simultaneously facilitates network and scheduling decisions. Integrating the network and scheduling decision-making processes allows for the accurate sizing of capacities in accordance with variable resource availability, whereas providing material storage in the form of large-scale geological as well as local liquefied hydrogen storage allows for the evaluation of trade-offs between the utilization of hydrogen as a DEC through opportunistic production versus the use of electricity and its associated energy storage to meet the energy load required to meet production demands.
We provide thorough background information in
Section 2. In
Section 3, we define the problem statement and the key challenges that we address in the present work. The multiscale modeling approach and some key constraints and objectives of the mixed-integer linear programming (MILP) formulation are described in
Section 4. The computational case studies and results are presented in
Section 5. Finally,
Section 6 is dedicated to the conclusions of this study and proposed future research. The full MILP model and parameters are compiled in the
Supplementary Materials.
2. Background
The ongoing transition of global value chains towards a lower-carbon-emission paradigm involves a meticulous transformation of multiple sectors [
7]. A departure from established hydrocarbon processes towards power generation technologies such as solar, wind, and geothermal is already underway, with biomass and water emerging as energy feedstock. Novel technology pathways have the potential to reduce carbon intensity at scale [
10] to sustainably meet the increasing material and energy demands while concurrently restricting the cost incurred by consumers. Decision makers also need to make optimal use of invested infrastructure, take advantage of economic policies and credits, and be cognizant of the interactions between various value chains while designing future energy systems.
The push towards decarbonization has multiple drivers not limited to techno-economic improvements in processes, economic incentives in the form of tax credits and rebates, and public awareness, which has pushed for greater accountability and congruence with sustainable development goals [
11]. Reductions in the cost of solar and wind technologies, for example, has made renewable power generation competitive in certain markets. Given that some proposed technologies are still in the nascent stages of development, the improvements in cost and efficiencies are likely to continue unabated in the coming decades. Moreover, the US Department of the Treasury and the Internal Revenue Service (IRS) amended Section 45Q of the Internal Revenue Code of 1986 to allow tax credits for carbon capture, utilization, and sequestration (CCUS) [
12]. The proposed legislation could provide the necessary economic incentive for a system-wide adoption of decarbonization strategies and novel CCUS technologies.
Modeling and optimization frameworks have been applied by decision makers variously for the analysis of supply chains that produce and dispense DECs. Particularly, this work follows up on the frameworks proposed by [
1,
13,
14,
15,
16] for the optimization and aggregation of large-scale DEC-based supply chains. Ref. [
13] proposed a model for the sustainable production of ammonia through process synthesis and global optimization. Ref. [
1] proposed a mixed-integer linear programming-based simultaneous design and operation strategy to determine the techno-economic feasibility of novel energy system networks. Refs. [
14,
15,
17] focused of the multiperiod planning and optimization of hydrogen-based DEC supply chains. Ref. [
16] proposed a framework for the aggregation of the temporal horizon with deterministic variability in resource prices and demand and intermittent renewable availability using agglomerative hierarchical clustering (AHC). By and large, the focus of these frameworks and numerous others has been on renewable power generation through solar and wind; the production of dense energy carriers such as ammonia, methanol, and hydrogen through various technology pathways; and the storage of energy in electrochemical form (batteries) or as DECs. Moreover, various modes of transportation have also been considered for multilocation frameworks.
Moreover, various aspects of the hydrogen economy have been investigated. These include strategies for long-range investment planning and design of future hydrogen supply chains [
14]; renewable power generation and storage management [
18]; and addressing the demand side [
19], cost [
20], uncertainty, risk, and circularity considerations [
21,
22], as well as multiproduct network design and planning in the context of CCUS and transportation fuel production [
23,
24]. The economies of scale, which require investment towards infrastructure and identifying appropriate technologies amongst the myriad available options, are of particular interest. Moreover, multiobjective frameworks have been proposed to determine the trade-offs between the competing objectives of carbon emissions and cost [
25].
However, the storage and transportation of hydrogen can be challenging given its propensity for embrittlement [
26] and the need to store hydrogen at low pressure or cryogenically. DECs such as ammonia and methanol, produced utilizing sustainable means, can be easier to manage. Moreover, they can take advantage of existing production and transportation supply chains. Ammonia has been explored through the lens of integration with fertilizer production [
27], modularization for offshore applications [
28], and integration with existing supply chains [
29]. In the case of methanol, given the potential for integration with existing carbon chains and biofuel production through unconventional resources, the role of economic incentives has been explored [
30]. Furthermore, the power-to-fuels pathway has been a topic of interest as a mode to utilize unconventional carbon resources such as biomass [
31].
It is noteworthy, that all these proposed solutions involve the hydrogen economy. Also noteworthy is that the hydrogen economy is not limited to the production of hydrogen through various technologies, such as electrolysis and methane reforming; it also involves the production, storage, and dispensing of power through sustainable means and the transport of power or DECs to the location of consumption. Moreover, the hydrogen economy will be intertwined with existing hydrocarbon supply chains, given the large foothold of the oil and gas (O&G) industry in the captive production of hydrogen [
32]. The O & G industry is also likely to play a central role in the push for carbon capture, utilization, and storage (CCUS). CCUS initiatives will invite financial incentives such as through the 45Q initiative [
33].
Given the considerable role of novel technologies, the techno-economic readiness of proposed pathways has come into question. Particularly, novel technologies are likely to benefit from significant reductions in the cost of technology. The NREL Annual Technology Baseline (ATB) provides cost scenarios for novel and renewable technologies under different levels of research and policy push. The novelty of this framework lies in the simultaneous consideration of the readiness of technology alongside economic incentives that these technologies will invite to understand the evolution of system costs.
3. Problem Statement
In this study, we consider an evolving process system which integrates (1) the production, storage, and dispensing of DECs (chiefly hydrogen); (2) renewable power generation, storage, and supply; and (3) the capture, sequestration, storage, and qualified use of carbon dioxide. The constituent processes are demarcated under three blocks for chemical production (CP), power systems (PG), and carbon capture, utilization, and storage (CCUS). It is imperative to note that given the integrated nature of the process system, the boundaries of the subsystems are merely illustrative. For example, the qualified use of carbon dioxide includes the production of methanol, which is placed under the chemical production block but serves the purpose of carbon sequestration as well.
The chemical production block consists of hydrogen and methanol production units such as alkaline water electrolysis (AWE) and steam methane reforming (SMRH) with water–gas shift (WGS) for hydrogen production and a catalytic reactor for methanol production, along with the apparatuses for hydrogen storage and discharge through either geological-scale storage or localized small-scale storage. The power systems block includes technologies for power generation through renewable sources such as wind and solar and also technologies for energy storage such as pumped storage hydropower (PSH), compressed air energy storage (CAES), and utility-scale lithium-ion (Li-ion) batteries. Small modular nuclear reactors (SMRs) are also considered. The CCUS block consists of primarily the direct air capture (DAC) unit and utility-scale carbon sequestration options such as offshore saline aquifers and enhanced oil recovery (EOR). We discuss the three blocks and their constituent processes in detail in the subsequent subsections.
This framework considers the simultaneous design and scheduling of the system. In the context of intermittent renewable energy sources, this integration of scheduling decisions with network design ensures that the scheduling decisions inherently take into account material and energy availability in any time period while allowing the sizing of capacities that can meet a more accurate production and consumption scenario.
The superstructure considered in this framework is illustrated as a resource task network (RTN) in
Figure 1. It should be noted that the distinctions between material and energy resources, as well as material and energy production and storage, are merely illustrative. Moreover, the three distinct blocks, ‘chemical production’, ‘power systems’, and ‘CCUS’, are essentially part of an integrated network characterized by a high degree of interaction and synchrony.
The distinct process blocks are discussed in the following subsections.
3.1. Chemical Production Block
The chemical DEC production system in the considered framework produces both hydrogen and methanol. Currently, the production of both hydrogen and methanol is dominated by technologies that reform methane from hydrocarbon sources. Methanol is traditionally produced via the hydrogenation of CO and CO2 followed by a reversed water–gas shift reaction. Hydrogen production is achieved by promoting the production of CO2 and H2 from the water–gas shift reaction. Thus, in contemporary hydrogen production systems, carbon dioxide is an inevitable coproduct. Instead of emitting the produced CO2, we explore ways to sequester CO2 in aquifers and by selling it towards EOR. In the framework, the production of methanol is restricted to a catalytic process that utilizes captured CO2 and green H2.
3.1.1. Steam Methane Reforming
Given the current trend of shifting from coal towards natural gas, natural gas technologies are likely to feature prominently at least in the coming decades. A transition from contemporary carbon-intensive energy systems towards net carbon neutrality needs to account for the large capital investment in extant hydrocarbon technologies, as well as the techno-economic maturity of novel technologies for utility-scale applications. While natural gas technologies allow greater control over production output, they are susceptible to fluctuation in natural gas prices. It becomes important to evaluate the impact of natural gas prices on the levelized cost of hydrogen (LCOH) to assuage the resiliency of the system to market fluctuations.
As an illustrative example, hydrogen is currently produced largely through steam reforming, which uses fossil fuels, particularly natural gas, as a feed [
32]. A complete transition towards electrolytic means of production is likely to occur over a multidecadal timeline even in the most aggressive scenarios. Steam reforming of natural gas can be integrated with water–gas shift technologies to produce hydrogen but with carbon dioxide as a by-product. Furthermore, the carbon dioxide can be utilized with water and natural gas to produce methanol, which can then be converted to fuel for mobility applications.
3.1.2. Electrolytic Production of Hydrogen
Electrolytic production of hydrogen from water can be achieved through various technologies. The most established can be categorized under polymer electrolyte membrane (PEM) electrolysis, alkaline water electrolysis (AWE), and solid oxide electrolysis (SOE). The Department of Energy (DOE) has set cost targets for both centralized and decentralized electrolysis facilities [
34]. Notwithstanding the ongoing research into augmenting the efficiencies and cost parameters to meet the targets, capital expenditures for the technologies are currently prohibitive; 500–1400 USD/kWe for alkaline water electrolyzers (AWE), 1100–1800 USD/kWe for PEM electrolyzers, and 2800–5600 USD/kWe for solid oxide electrolyzers (SOE) [
35]. Nonetheless, electrolysis remains underutilized due to, amongst other things, the high cost of the technology as well as the large energy requirement for the process and low lifetimes of some components. Moreover, supplementary apparatuses to control the quality of water are also needed, which adds to both the cost and the energy load [
36].
Alkaline water electrolysis is preferred to other electrolytic means of hydrogen production given that electrolyte and electrode materials are more accessible [
37]. The energy consumption and efficiency considered in this study account for the practical ranges of cell voltage during operation [
38].
3.1.3. Hydrogen Storage
Hydrogen as an energy source can be stored as either a compressed gas or a cryogenic liquid; both modes are susceptible to storage losses, as energy is also required for compression and liquefaction. While low-energy technologies such as metal hydride storage have been explored, the need for rare earth metals and the associated cost have limited their commercialization [
39]. Local hydrogen storage in the model is achieved solely through liquefaction.
For large-scale storage, depleted oil wells (DOWs) could play a pivotal role, as these will reduce the cost of storage and storage losses substantially. However, this belies the need for investment in pipelines or other transportation technologies. Saline aquifers and depleted oil wells might not always be locally accessible; hence, we enforce a condition that necessitates that at least 20% of the total hydrogen storage capacity be met by locally stored cryogenic H2. It should be noted that irrespective of the production mode, the model necessitates that the hydrogen is stored before being deployed. This helps account for the costs incurred to compress or liquefy hydrogen predeployment.
3.1.4. Qualified Use of Captured Carbon Dioxide
Recent efforts such as the 45Q amendment to the US tax code provide the necessary taxation framework to implement policies that allow the provision of tax credits under other qualified uses of sequestered CO
2. The production of methanol can be achieved through catalytic processes that react hydrogen (produced electrolytically) with sequestered carbon dioxide [
40]. A pilot plant constructed by the MefCO2 consortium produces 1 ton of methanol per day from more than 1.5 tons of CO
2 captured daily [
8]. Methanol also has several advantages as a DEC, as it can be stored as a liquid at room temperature.
3.2. Power Systems Block
This framework allows for the renewable generation of power through solar PVs and/or wind farms. Further, storage is allowed in various forms appropriate to different temporal scales: PSH for the long term and CAES and Li-ion battery storage for dynamic storage on shorter scales. It is imperative to note that battery storage is not nearly as geographically restricted as PSH, which requires the presence of a geographic elevation differential, or CAES, which is established over depleted oil wells or abandoned mines.
3.2.1. Renewable Power Generation
Arrays of solar photovoltaic (PV) panels and windmills have already seen utility-scale applications driven largely by improvements in efficiency and the reduction in costs in recent years, which have made renewable energy generation techno-economically competitive. Moreover, these trends are expected to continue unabated in the coming decades, especially given that some of the considered processes have yet to attain technical maturity or availability from the cost reductions resulting from large-scale deployment [
41]. Nonetheless, solar and wind are both intermittent and, hence, need to be used in tandem with energy storage to lend resiliency to the overall system. Moreover, there is a need to reduce the need for grid-scale battery storage in locations where pumped storage hydropower (PSH) or compressed air energy storage (CAES) is not viable. Nevertheless, significant efforts are being directed towards the development of modular PSH and CAES to augment deployability and reduce cost and also towards the recycling of battery materials and the use of environmentally benign materials for battery production.
3.2.2. Modular Nuclear Power
Small modular nuclear reactors (SMNRs) for nuclear power generation are being investigated [
42]. The deployment of nuclear has been largely limited by public perception and safety concerns. Moreover, the water usage is typically high, notwithstanding improvements in terms of safety, water utilization, and land use in recent years, especially with the modularization of nuclear technologies [
43]. The modularity of SMNRs provides several advantages, such as lower construction times, required capital investment, operation expenditure, water use, and process safety risk. Moreover, SMNRs enable schedules wherein one section of the setup is refueled while the rest are kept active [
44]. There are indicators that SMNRs will offer lower costs at scale compared to existing large reactor facilities, with further cost reductions expected in the coming decades [
45]. Moreover, the novel methods of feeding fuels such as continuous feed as pellets provides greater control over the power output and dynamic operation [
46].
3.2.3. Energy Storage
Energy storage, currently, is largely met using PSH on a utility scale. Nonetheless, PSH is not suitable for all locations, and despite the drive to modularize the technology, the mid-term is likely to see a rise in electrochemical storage technologies. We consider the round-trip efficiency (RTE) of energy storage technologies to determine our conversion factors. Further, we consider a constant discharge rate, ignore ramping limitations, and assume instantaneous response times and zero performance degradation over the lifetime of technology use.
The renewable power generated in the system is sent directly to a grid. Thus, we assume that the lithium-ion battery interacts with a high-voltage grid. Consequently, the efficiency of a primary control reserve (PCR) is considered [
47]. Moreover, we consider a conservative value (6% over 4 weeks) for storage losses given the relatively high temperature profiles of some key energy markets in the US, viz., Texas and California [
48]. Competing battery technologies such as sodium–sulfur, sodium–metal halide, zinc–hybrid cathode, and vanadium redox batteries are also likely to reach technical maturity. Nonetheless, lithium-ion batteries have a normalized voltage that is higher (typically by a factor of 1.6) compared to conventional battery technology, which reduces the power conversion system (PCS) cost significantly. Further, given the relatively higher TRL, we consider only lithium-ion batteries in this study. Similarly, a diabatic compressed air energy storage (D-CAES) system with a recuperator is considered [
49]. The self-discharge rate of D-CAES systems is negligible [
50]; hence, we can ignore storage losses.
3.3. CCUS Block
Given the carbon intensity of contemporary hydrogen production and the presence of historic CO
2 emissions in the atmosphere, it is important to introduce technologies that can either sequester CO
2 from process streams or capture it directly from the atmosphere. It should, however, be noted that direct air capture (DAC) is currently in the early phases of commercialization [
51]. This is largely due to high capital costs, large energy and water requirements, and maintenance and replacement costs incurred due to sorbent degeneration and membrane degradation [
52]. On the other hand, sequestration through the flue gas stream is comparatively efficient. Nonetheless, neither inherently address the postutilization of CO
2. Various strategies have been proposed, not limited to the production of methanol to meet specific high-temperature fuel applications and the long-term sequestration in depleted oil wells (DOWs), mining shafts, and saline aquifers.
While specific targets are not set for the capture, sequestration, or utilization of CO2, carbon credits are assigned as per the 45Q legislation. Carbon credits can be attained through capture and/or sequestration through direct air capture, enhanced oil recovery, and storage in aquifers. This framework also estimates secondary emissions through the sale of sequestered CO2 for activities such as enhanced oil recovery (EOR) to produce crude oil, a carbon-intensive energy feedstock.
3.3.1. Sequestration from Hydrocarbon Processes
The need to account for historic CO
2 emissions cannot be understated. Although numerous technologies have been proposed for the capture of carbon dioxide from the atmosphere [
53], high costs and low lifetimes of use have limited the deployment of direct air capture (DAC) technologies [
54]. Solvent recovery is often the energy-intensive step in DAC [
52]. Moreover, identifying an appropriate solvent has been difficult given their propensity to degrade, their corrosive nature causing health concerns, and their scaling limitations [
51]. The large and focused amount of funding being directed towards the development of novel materials and paradigms for carbon capture could provide the necessary push to prepare such technologies for large-scale deployment. This study assumes a capture efficiency of 90% from the SMRH flue gas stream and also accounts for vented CO
2 from SMRHs and EOR.
3.3.2. Large-Scale Geological Storage
Saline aquifers are large geological formations with highly permeable rocks. In the latent state, they are saturated with brine. The brine serves as a solvent if the aquifer is subjected to a high-pressure inlet stream of gases such as supercritical carbon dioxide or hydrogen. Proposals for the storage of captured CO2 in onshore and offshore aquifers and depleted oil wells have gained traction.
However, various logistical as well as legislative considerations need to be addressed, especially for offshore storage. Environmental concerns regarding the untested nature of such storage, as well as the permanence of such solutions, are well founded. Nonetheless, CO
2 can be sold towards enhanced oil recovery (EOR), but such a solution is not environmentally effective over the long term, and the cost reductions can be Pyrrhic. Research suggests that the CO
2–EOR process becomes net-carbon-positive in 5 to 6 years [
55].
The idea of large-scale geological sequestration of CO
2 builds on the large-scale storage of natural gas in saline aquifers and depleted oil wells, which is a mature technology. Recent work has focused on evaluating saline aquifers as a large-scale CO
2 sink [
56], including some studies that have evaluated their integration with a renewable grid [
57]. If found to be cost-effective, they could serve as both a utility-scale energy storage option through hydrogen storage and a sink for carbon dioxide sequestered from hydrocarbon process streams or captured directly from the atmosphere.
Notably, geological storage and EOR both involve the injection of CO
2 into saline aquifers. However, EOR is afforded inherent pressure control because of the parallel processes of CO
2 injection and production of oil [
56]. Meanwhile, geological storage does not require significant processing apparatuses given that the flow does not need to be directed and controlled. Moreover, the goal of geological sequestration is to maximize the amount of CO
2 injected. Naturally, there is a potential for brine displacement and CO
2 leakage, as well as the potential to detrimentally impact seismic activity [
58]. Nonetheless, the experience from CO
2 injection in EOR could play a significant role in expediting the deployment of large-scale geological sequestration under a strong regulatory and leakage-monitoring framework. The power consumption of geological storage is assumed to be 50% of the EOR process.
3.3.3. Direct Air Capture
The transition will be realized over a protracted timeline. Technologies that can sequester carbon dioxide directly from the atmosphere could provide the necessary push to meet unprecedented decarbonization targets while also providing some leeway. A gradual transition will allow space for decision makers to reform strategies and benefit from invested infrastructure. It is estimated that a global capacity of 470 MtCO
2/year of DAC is needed by 2030 to meet the decarbonization targets set in the Paris Agreement. Moreover, given a high learning rate, the cost could be as low as 94–232 USD/tCO
2 in the near future [
59]. Carbon credits could reduce this cost further. Nonetheless, the adoption of DAC technologies is contingent upon a concerted policy push, and studies to assuage the environmental impact are requisite [
60]. In the present work, we utilize a low-temperature-operation DAC setup, and capital and operational expenditure values are collected from the literature [
61]. To account for the net carbon in the system strictly, we ensure that methanol can only be produced through captured CO
2 and green H
2.
4. Multiscale Modeling and Optimization Framework
Mathematical programming is particularly adept at representing synchronous systems and including various technology alternatives for production, storage, and transportation under an encompassing modeling and optimization paradigm. This allows the careful evaluation of trade-offs between different technology options and the evaluation of optimal transition scenarios as well as uncertainty analyses. Currently, hydrogen and carbon are used in the combined hydrocarbon form through fossil fuels such as natural gas and petroleum. With decarbonization, the carbon and hydrogen supply chains are essentially being decoupled, viz., the production of hydrogen from electrolytic means instead of fossil fuels and the capture of carbon dioxide directly from the atmosphere as opposed to captive sequestration in the O&G industry. This transition will be gradual as technologies evolve and in some cases are replaced or reconfigured, along with associated improvements in process efficiencies and deployment costs.
In the proposed study, we first establish a contemporary supply chain wherein the production of hydrogen is led largely by hydrocarbon sources such as natural gas. AWE is presented as an alternative pathway. Power is supplied entirely through a combination of solar, wind, and nuclear. In this study, the hydrogen produced via SMRH is referred to as blue hydrogen, and hydrogen produced via electrolysis is called green hydrogen. In the near term, the decarbonization is led largely through the retrofitting of existing technologies to allow for the sequestration and subsequent sale of CO2 towards EOR. Subsequently, in the mid-term, DAC is introduced to capture CO2 from the atmosphere and saline aquifers are introduced for long-term CO2 sequestration.
Considering the CCUS network, the hydrogen supply and production network and renewable power generation under an integrated paradigm allow the following: (1) the study of trade-offs between utilizing technologies that are carbon-neutral but have a high energy demand, viz., electrolyzers and other catalytic processes for DEC production, versus established hydrocarbon processes; (2) the recognition of candidate technologies to supplant contemporary carbon-intensive technologies; (3) the generation of cost-effective pathways with reductions in carbon intensity; (4) the study of the effect of carbon credits over a long planning horizon; and (5) the assuaging of sensitivity to the price of natural gas.
4.1. Temporal Evolution of the System
Given the long planning horizon, it is difficult to assign exact values to the future cost of technology. A network-scale analysis of cost cannot sufficiently account for exogenous factors such as changes in labor costs and changing market conditions. Moreover, breakthrough technological innovations, changes in public perception and acceptance, and drastic changes in demand in the face of limited supply caused by unforeseen weather or social events could considerably affect production costs. Studies utilizing a multitude of disparate factors such as research incentives, policy pushes, and subsidies to predict technology costs can provide a degree of confidence. It should be noted that the desired outcome of this study is not to assign exact monetary values to future technology pathways. Rather, we are interested in determining the trade-offs between disparate technology pathways and identifying niche application areas for proposed technologies.
We study the influence of different cost trajectories on the optimal pathways. Three distinct cost scenarios are considered: conservative, moderate, and advanced. For utility-scale lithium-ion battery storage, land-based wind farms, solar farms, and PSH storage, we utilize the values predicted by the NREL Annual Technology Baseline [
9]. On the other hand, technologies in advanced stages of development are only assigned nominal cost reductions, as the reductions in technology costs for processes with established infrastructure are not expected to reduce drastically.
We consider the technology readiness level (TRL) of technologies, a measure to assess the maturity of a technology to predict cost trajectories. The TRL ranges from 1—basic principles observed—to 9—system proven in operational environment. It is understood that the technologies considered in the presented system are at different levels of readiness in terms of deployment. For example, PSH and CAES are both characterized by long development timelines and have seen operation deployment with TRLs of 8 and 7, respectively; hence, the cost reductions are expected to be relatively modest [
62]. Notwithstanding the challenges to the deployment of large-scale CAES, such as environmental restrictions and the lack of a dedicated regulatory framework, the technology can be cost-competitive, albeit restricted by the availability of suitable depleted salt caverns and natural gas wells.
Considering three distinct trajectories allows us to study the system under a wide envelope of evolving costs. Nonetheless, it should be noted that we assume the same cost scenario across the entire system, which might belie the disparities in research and policy push for different technologies depending on various factors including public perception of the technology, the presence of ancillary industries to supply the required raw materials and technical components of the system, and manufacturing capability.
We define four levels of technological maturity based on the scale of current adoption:
Enterprise: SMRH and EOR.
Utility: solar, wind, PSH, batteries, and AWE.
Pilot: CAES, DAC, catalytic methanol synthesis, and local H2 storage.
Repurposed: geological H2 and CO2 storage.
Technologies which have seen widespread adoption such as natural gas-reforming technologies are unlikely to experience drastic reductions in cost; these are assigned nominal cost reductions of 0%, 10%, and 20% for the three cost scenarios (conservative, moderate, and advanced). Technologies which have seen utility-scale applications in recent decades are assigned a three-decade cost reduction of 20%, 40%, and 60% under the three cost scenarios. However, for solar, wind, PSH, and batteries, cost predictions are used from the NREL Annual Technology Baseline with a cost recovery period (CRP) of 20 years. Technologies which are still on a pilot scale are not expected to experience drastic cost reductions in the testing phase; these are assigned cost reductions of 15%, 30%, and 45%. Note that technologies for geological and local storage are largely repurposed from existing natural gas technologies; while the renewed focus might bring some cost reduction, these could be limited. Hence, these are provided with reductions of 15%, 30%, and 45%. Given the generality of the framework, different cost trajectories, local constraints, and technologies can be considered to resolve specific systems.
4.2. Scenario Reduction
The scheduling scale contains 8760 periods corresponding to every hour in the annual network scale. Moreover, the model is solved for each period under different scenarios. Hence, to expedite the solution procedure, the temporal scale is clustered using agglomerative hierarchical clustering (AHC) [
16] using normalized solar and wind profiles and varying natural gas spot prices. It should be noted that AHC maintains temporal chronology, which makes it easier to relay information between the time periods in the scheduling model. However, it was inferred by [
16] that minimizing the within-cluster sum of squares (WCSS) (
Figure 2) does not necessarily lead to a reduction in the objective error. Hence, the model is run over the time period of a year for various cluster sizes to gain insight into how the objective error scales with an increase in cluster size. Notwithstanding the absence of a formal methodology to identify the optimal number of clusters from the perspective of objective error, a cluster number of 20 is chosen based on the trade-off with computational time. Moreover, the solution is validated with the full-scale solution across the planning horizon.
4.3. Mathematical Model
The model is multiscale in nature in that operational decisions such as production, purchase, selling, storage, etc., are modeled alongside network-level decisions such as the choice and sizing of facilities. The choosing of appropriate facilities is achieved via the use of binary variables, rendering the framework as a mixed-integer linear program (MILP) which allows for integrated design, planning, and scheduling. Costing parameters used are as follows: (i) purchase price of resources, (ii) capital cost for establishing facilities, (iii) fixed and variable operation costs to run facilities, (iv) credits earned as per the 45Q legislation. Intermittency in renewable power generation and variation in purchase price, resource demand, and long-term technology costs are modeled using datasets of parameters from publicly available repositories.
The parameters considered are indeed subject to significant uncertainty. The sensitivity of the model solution to the considered parameters can be assuaged through scenario analysis. In the case of cost trajectories, for example, the levelized cost scenarios act as a range of uncertain parameters, and the model solution can provide different network configurations based on the values considered.
In this section, we summarize some of the key constraints of the framework. The full set of equations and parameters can be referred to in the
Supplementary Materials, along with the sources of the data.
Section 4.3.1 describes the network problem, which is resolved on the temporal scale of a year. The planning and scheduling decision constraints described in
Section 4.3.2 and
Section 4.3.3 are determined for each hour of the planning period. The demand constraints are presented in
Section 4.3.4.
Section 4.3.6 describes the calculation of carbon credits earned under the 45Q tax provision. The annual production costs are determined using the constraints described in
Section 4.3.5. The constraints to evaluate the expenditure on resource purchase are shown in
Section 4.3.7. Lastly, the objective is described in
Section 4.3.8.
4.3.1. Network Design
The superstructure (
Figure 1) represents all possible network combinations, wherein the nodes each represent a distinct type of material production, power generation, and material and energy storage technology. Binary variables (
for production facilities and
for storage facilities) are assigned to each node. The binary is equal to 1 if the facility is built in a particular year, 0 otherwise. Note that the distinction between storage and production facilities is only for the ease of representation. Moreover, we do not impose a mathematical distinction between energy and material conversion processes.
Production Capacity Sizing
These constraints manage the capacity expansion trajectories of processes. There are significant differences in the scaling dynamics of novel technologies as compared to existing hydrocarbon plants. For example, AWE and batteries are modular, allowing for easier scale-up as well as decentralized applications. On the contrary, contemporary technologies for both material production and energy storage (viz., SMR, PSH) have scaling limitations. Modular technologies could allow a more gradual scale-up as compared to technologies that require larger setups as they invite higher initial capital expenditure and longer payback periods. To capture this, the model utilizes a minimum production capacity. Notably, a minimum capacity utilization or production rate is not imposed. However, it is understood that the objective (to minimize the system costs) and the capital expenditure incurred due to the preservation of established facilities work in tandem to dissuade the scale-up of a process or introduction of newer technologies. Qualitatively, these constraints allow the model to account for capital invested in establishing infrastructure in the preceding planning periods.
Storage Capacity Sizing
The storage capacity and facility location decisions are determined using this constraint:
where
is the production capacity of process
i at location
a in year
y,
is the storage capacity for resource
j at location
a in year
y, and
and
are the maximum production capacities for process
i and storage capacities for resource
j, respectively, at location
a in year
y.
4.3.2. Resource Balance
We assume that all processes in the superstructure function on a continuous basis. For each process
i, the realized production (
) in a time period (h) within a day (d) of a year (y) is constrained to the capacity of the production facility as determined by the network design (Constraint (
1)). Similarly, the inventory level (
) in a time period (h) within a day (d) of a year (y) is constrained to the storage capacity as determined by the network design (Constraint (
2)). Furthermore, we constrain the amount of a resource that can be purchased from outside the system (
) to the maximum resource availability. Note that the maximum resource availability will be nonzero only for resources that serve as raw materials in the system, e.g., natural gas and water.
Nameplate Production Capacity
The realized production rates for each hour are determined using the following constraints. To account for the intermittent availability of solar and wind, the solar DNI and wind speed power outputs are normalized to generate capacity utilization factors:
Nameplate Storage Capacity
The inventory levels at every hour are restricted to the nameplate storage capacity using the following constraints:
Resource Consumption Capacity
These constraints restrict the amount of a resource that can be consumed:
4.3.3. Inventory Balance
The inventory balance (Constraints (
6), (
7), (
8), (
9)) are applied over exhaustive subsets of the planning horizon both to determine the resource flow through the network and to account for inventory cycling.
Start-Up Inventory Balance
This constraint is only applied to the first hour of the planning horizon. The starting inventory levels are assumed to be zero:
Daily Start-Up Inventory Balance
The inventory at the start of the day is determined using the following constraints. The inventory from the previous day is cycled.
Annual Start-Up Inventory Balance
The inventory at the start of the year is evaluated by the following constraints, wherein the inventory from the end of the previous year is cycled:
General Inventory Balance
The following constraints provide the inventory balance for the rest of the planning horizon:
where
and
are the first elements in the sets of time periods (
) and seasons (
), respectively, while
and
are the last. The conversion efficiencies for each resource (
j) by each process (
i) are given by the factor
. The model accounts for storage losses using the factor
. Constraint (
6) determines the inventory at start-up such that the inventory level in the first time period of the first season in year 0 is 0. Constraint (
7) balances and cycles inventory from the last time period in a given season to the next. Constraint (
8) balances and cycles inventory from the year-end to the first time period of the subsequent year. Constraint (
9) balances and cycles inventory between adjacent time periods in a season.
4.3.4. Demand Constraints
The demand constraints (
10) ensure that the daily demand for hydrogen is satisfied. Constraint (
11) meets an equivalent mileage. It should be noted that these constraints are applied as a part of separate case studies.
4.3.5. Annual Production Cost
We consider three costing components. Variable operational and maintenance (O&M) costs are calculated based on the amount of a base resource produced by a process (
12). In contrast, annualized capital expenditure (
14) costs and fixed (O&M) costs (
13) are evaluated based on the capacity sizing of the processes. Moreover, we can consider three distinct cost scenarios
.
4.3.6. Carbon Credits Earned
Carbon credits are assigned as per the 45Q amendment [
12] using Constraint (
15). Carbon credits are assigned based on the amount of carbon sequestered by each CCUS process. The RTN includes different forms of CO
2 such as vented, sequestered, implicit, and atmospheric. Vented CO
2 is used to calculate direct emissions, implicit CO
2 tracks the flow within the system, and atmospheric CO
2 can only be captured via DAC. With reference to the values in
Table 1, saline aquifers are categorized as geological sequestration, EOR as geological sequestration with EOR, and production of methanol using MEFC as other qualified use. Here, it should be noted that planning periods
have different credit rates, with a change in the year 2026. To accommodate for the different rates of carbon credits per process, the calculation is performed based on the total annual production of each CCUS process, with the basis of each process being the amount of carbon sequestered.
4.3.7. Resource Purchase Expenditure
The annual expenditure on resource purchase is evaluated using Constraint (
16).
4.3.8. Objective
The objective of the model is to minimize the total cost incurred by the system. If the hydrogen demand is met, the objective value divided by the total hydrogen production indicates the levelized cost of hydrogen (LCOH). If the system is optimized to meet the mileage demand, then the objective value can be divided by the total mileage to indicate the levelized cost per mile traveled.
The cost objective minimizes the levelized total cost borne by the system. The total cost, obtained as the summation of individual expenditures over the set of all processes, consists of the capital expenditure () annualized using a factor (), operational expenditure (), resource purchase cost (), and credits earned (). Notably, capital and operational expenditures and purchase costs are minimized in the system. On the other hand, we maximize the tax credits earned under the 45Q legislation, which are subtracted from the cost objective.
This objective minimizes the cost while meeting a daily mileage requirement through a combination of electricity (EVs), hydrogen (FCEVs), and methanol, which assumes 90% composition. The fuel required for the 90% methanol fuel is not produced in situ in the system. Nonetheless, we account for the carbon emission resulting from its use as a transportation fuel. Notably, methanol in the system is only produced from carbon dioxide captured through direct air capture (DAC) and green hydrogen produced through AWE. Naturally, this represents an opportunity to decarbonize the transportation sector. The objective is to meet the mileage equivalent of the daily hydrogen demand:
5. Computational Studies
The implementation of the framework is modeled through computational case studies, wherein energy transition scenarios are analyzed. First, a base case is presented in
Section 5.1, wherein there is no bound placed on the carbon intensity and the sole objective is to minimize the cost incurred. Then, the carbon intensity is lowered by enforcing the capture and sequestration of carbon emissions to understand how the overall costs and choices of technology will evolve in a low-carbon paradigm in
Section 5.2. Furthermore, the research and proposed policies such as carbon credits are discussed in
Section 5.3.
Section 5.4 discusses the cost of reducing carbon emissions. Inventory management and the function of technologies are discussed in tandem in
Section 5.5. The viability of meeting an equivalent mileage demand through the novel methanol pathway is touched upon in
Section 5.6. Global warming potentials (GWPs) are included for power generation processes found in the literature [
63,
64,
65]. Mileage values are taken from [
66].
It is understood that an incomplete database, as well as the sources of data considered, may bias the optimal solutions towards certain pathways. Nonetheless, the authors would like to emphasize that the results presented here are to demonstrate how MIP frameworks can be employed to analyze the evolution of future energy systems as opposed to assigning strict monetary values to the cost of production or operation. The results should, hence, be interpreted as such. Decision makers, however, can make inferences from such frameworks by applying them with due consideration to localized constraints and goals.
We consider three distinct cost scenarios (conservative, moderate, and advanced). Efficiencies are augmented for processes at lower technology readiness levels (TRLs). Moreover, proposed technologies are introduced later in the planning horizon; compressed air energy storage (CAES) in the year 2025, direct air capture (DAC) in the year 2026, catalytic methanol production (MEFC) [
67] in the year 2028, and small modular nuclear reactors (SMNRs) in 2029. Notably, given that the infrastructure realized in earlier planning periods is retained, novel technologies cannot supplant existing processes; rather, they contribute to capacity expansion if deemed cost-competitive compared to existing technologies. Further, MEFC can only utilize CO
2 captured through DAC. The rest of the processes are introduced in 2022; these include steam methane reforming (SMR) with the option of carbon capture (SMR + CC) and alkaline water electrolysis (AWE) for hydrogen production; solar photovoltaics (PVs) and wind farms (WFs) for power generation; and lithium-ion batteries and pumped storage hydropower (PSH) for energy storage. Moreover, carbon can be sequestered through enhanced oil recovery (EOR) or saline aquifers (AQFs). It should be noted that MEFC only utilizes CO
2 captured through DAC and H
2 produced through AWE.
The solar and wind data for Houston are used in the case study, and the costs are localized where possible. The framework was modeled using the energiapy Python module [
68] and solved on an Intel Core i7-6700 CPU with a 3.41 GHz processor and 16 GB RAM using the GUROBI solver [
69].
5.1. Competing Technology Pathways
Given that no restrictions are placed on emissions, the lowest-cost network does not involve any CCUS processes. Both the CCUS chain and electrolysis increase the need for power, which can further add to the cost of hydrogen production. It is clear that the SMR process sans any carbon capture dominates. Despite the low power requirements for the low-cost scenario, power generation is still a major cost contributor. Resource purchase cost, natural gas in this case, is the dominating cost and grows as a share as the planning period progresses. This could as be an artifact of the fact that cost augmentations are considered for power generation processes and the purchase price of natural gas is considered at 2019 levels (refer to
Figure 3). To this end, the solution, and by extension the LCOH, in scenarios utilizing methane reforming is sensitive to the price of natural gas.
It should be noted that while 15% of the produced hydrogen is routed through local storage, the model overwhelmingly prefers geological storage. However, hydrogen storage in geological formations is thus far unrealized on a commercial scale. This is expected given the large cost difference and differences in storage losses. Not surprisingly, wind dominates in Texas given the availability and lower costs.
Nuclear is introduced and implemented in the year 2029. SMNRs also have the lowest GWP amongst the power generation processes considered and could feature prominently as a low-cost, low-emission option in future energy systems. Moreover, while the capital expenditure is typically higher, the operation and management costs are significantly lower [
44]. There is, however, significant uncertainty in the costs that proposed and novel technologies may incur due to the unforeseen challenges experienced during the scale-up of processes from the pilot to the commercial scale. Nevertheless, the framework is general, and scenarios can be run to determine the optimal pathways under different cost scenarios.
5.2. Low-Emission Scenarios
Three distinct technology scenarios are considered: (i) the gray pathway, wherein hydrogen production is achieved solely through the SMR process, (ii) the blue pathway, in which CCUS is enforced alongside hydrogen production through SMR, and (iii) the green pathway, which relies on electrolysis. In all three cases, power generation options are limited to WFs, PVs, and SMNRs. The green pathway is understood to have no direct emissions.
While the cost of the green pathway is significantly higher (refer to
Figure 4), it is able to take advantage of the reductions in technology costs expected for AWE as well as power generation given that the energy demand for the green pathway is also higher. The blue pathway also experiences some cost reduction, albeit at a lower level given that the technologies for CCUS are assumed to not experience the same degree of cost reduction. While it is possible that the green pathway can achieve cost competitiveness over a longer temporal horizon, power generation and electrolysis will need to experience significant reductions to compete with the gray and blue pathways. However, it should be noted that the green pathway is not subject to the uncertainty in the price of natural gas.
The blue pathway can also be subsidized through the provision of carbon credits as per the 45Q amendment to the US tax code [
12], but these influence the cost only to a modest degree (refer to
Figure 5). It can be observed that saline aquifers will need to be installed to sequester the captured CO
2, which adds to the overall costs while also increasing the energy load. Moreover, efficient and cost-effective power generation has a significant role to play as it has the potential to make the green and blue pathways cost-competitive, as CCUS adds to the energy demand. Nevertheless, a more dedicated study of the role of carbon credits is needed, as there is a possibility that they prolong the use of carbon-intensive technologies, which could be counterproductive in terms of emission mitigation.
It can be observed that given the option of SMNRs in 2029, the model chooses to meet the additional H2 demand by augmenting the capacity of AWE. It is understood that AWE can potentially compete with the SMR + CC pathway, albeit in the presence of cost-sensitive power generation technologies.
In
Figure 6, the disparity in the nature of emissions amongst the proposed pathways can be observed. While the green pathway has no direct emissions and the overall emissions are substantially lower, the emissions occur chiefly at the stage of establishing the processes and infrastructure. The blue pathway understandably reduces direct carbon emissions as compared to the gray pathway. However, this does not answer questions pertaining to the viability of long-term carbon sequestration or the utilization of captured carbon. Notably, carbon utilization can be value-adding and provide economic impetus to the blue pathway.
5.3. Role of Research and Policy Push
Distinct levelized technology cost scenarios are considered, namely, (i) conservative, (ii) moderate, and (iii) advanced, based on the current expenditure on research and push from policy. Understandably, research and policy push have the potential to make the economic transition a cost-effective one. Novel CCUS technologies are expected to benefit more from this push. It can be observed in
Figure 7 that even in the advanced scenario, the cost of the green pathway remains prohibitive as compared to the gray and blue pathways. Moreover, sections of the gray pathway have already been established, which can make the green pathway even less lucrative economically. There is also significant uncertainty with respect to the actual reductions in technology costs that can be achieved given the presence of unforeseen bottlenecks and the influence of market forces that can be difficult to predict.
However, there is room for the intelligent application of taxation regimes to subsidize lower-carbon pathways in the coming decade. This could also help preserve investments in the O&G industry, as CCUS chains can be integrated with retrofitted extant hydrocarbon processes such as methane reforming. This will also help manage the investment load for decision makers by enabling a gradual and better-informed transition wherein existing infrastructure is retired after its lifetime of use. A limitation of the case study is that the research and policy push may favor certain technologies, which could result in some technologies experiencing a more pronounced decline in cost than others. While this can be analyzed within the confines of the proposed framework, a study of this nature would result in a large number of individualized scenarios.
5.4. Cost of Carbon Reduction
To assuage the cost of reducing carbon emissions, a case study is designed wherein both the blue and green pathways are allowed. Moreover, the SMNR process is introduced earlier, in year 5, to support the power-intensive green hydrogen pathway. The trade-off between LCOH (USD/kg.H
2) and carbon intensity (kg.CO
2/kg.H
2) is illustrated in
Figure 8. Moreover, the maximum capacity for WFs is restricted to 1300 MW. The values are first benchmarked without any constraint on the carbon intensity and then subsequently reduced by 10%, 25%, 50%, and 75%. It should be noted that the capacity restrictions and years of technology introduction are merely illustrative. The generality of the framework enables its application by decision makers to specific problems with due cognizance of localized restrictions and varying resource availability.
5.5. Inventory Management
An advantage of the multiscale approach is that operational and network planning decisions can be concurrently resolved. Optimal operational decisions can lend considerable insight into the impact of weather and market phenomena on proposed systems. In
Figure 9, the schedule for year 8 is illustrated. A key observation is that networks utilize a combination of different technologies in tandem for (i) energy storage, (ii) hydrogen storage, (iii) hydrogen production, and (iv) power generation. For example, battery energy storage (Li-ion) is utilized alongside CAES, which is introduced and implemented in year 2.
The role of SMNRs in supporting the transition becomes clear: despite the increase in demand, the capacity increase for both H2 production and energy storage halts in the year that the power generation technology is introduced (year 5). Unlike solar and wind, which are restricted by intermittency, nuclear power lends considerable control over power generation, allowing the system to respond more robustly to the energy demand. This is akin to power generation through traditional hydrocarbon sources such as coal and natural gas, which allow a higher degree of control in terms of power output. Nevertheless, the role of modular nuclear technology in future low-carbon energy systems deserves further investigation, given that such technology has not been applied commercially.
5.6. Novel Technology Pathways
Novel technology pathways involve technologies which are at early TRLs. There is a factor of uncertainty with respect to how they will materialize over long temporal horizons. As a motivating example, we consider a hypothetical scenario wherein we meet the equivalent mileage of H
2 through the production of methanol through a proposed catalytic process [
67] that utilizes green H
2 and CO
2 captured through DAC. The DAC and MEFC processes are introduced in the year 2022 in this case. While the direct carbon emissions in this case are null, we would need to produce methanol at 44 USD/kg to meet the mileage equivalent of H
2 produced at under USD 2.5 in even the low-carbon-emission scenario sans credits. Additionally, while there are no direct emissions, the emissions resulting from material sourcing and facility installation are difficult to determine in the absence of large-scale setups. The use of methanol fuel also results in direct emissions.
6. Conclusions
In this work, a modeling and optimization framework for the design and analysis of energy systems is presented. Key insights are presented on how existing hydrocarbon processes that make up the gray pathway can be leveraged alongside novel processes to drive a transition in mobility towards low-carbon pathways through the use of hydrogen as a mobility fuel. Given that the framework is agnostic to the region of application, processes considered, and input data, mobility transition scenarios can be analyzed over multiple periods. This allows the evolution of technology in terms of cost and efficiency to be considered over the typically long temporal horizons such problems typically entail.
The model was constructed as a multiscale multiperiod MILP to simultaneously allow for network and scheduling decisions. In terms of data input, varying natural gas prices, intermittent solar and wind resource availability, and evolving technology costs and efficiency were considered. The demand was also increased through the progression of the temporal horizon.
In the presented case studies, different cost trajectories were considered based on policy and research push. Different hydrogen production processes were also analyzed, and the trade-offs between them were elucidated. The role of tax credits were also analyzed to provide perspective on how such policies will manifest in terms of system costs. Furthermore, the viability of novel technology pathways such as the production of methanol through captured CO2 and green H2 was also touched upon.
The trade-offs between carbon intensity and system costs were elucidated by enforcing reductions in carbon emissions. Carbon emissions were considered through two modes: direct emission at the point of consumption and production and at the point of resource production. It should be noted that all sources of emissions were not considered comprehensively. However, the goal of the present study is not to assign deterministic values to the cost of hydrogen or to calculate carbon emissions. Instead, the idea is to enable decision makers to apply the framework to specific regions of consideration to evaluate the trade-offs between proposed technology pathways.
The gray pathway is found to be sensitive to the cost of natural gas, given that it is the largest contribution to the LCOH. Power generation is found to be a significant contributor to cost across all scenarios. Understandably, a decline in the cost of power generation technology can play a significant role in enabling the energy transition. The LCOH for the green pathway is found to be significantly higher than the blue and gray pathways. However, the green pathway is able to take better advantage of reductions in technology costs.
Carbon credits are able to subsidize the blue pathway but are not able to offset the cost of CCUS. The realization of the blue pathway is, hence, dependent on reductions in the cost of CCUS technologies and power generation. However, the blue pathway may be able to take advantage of existing infrastructure. Emissions of the three pathways vary vastly, with the green pathway only experiencing indirect emissions.
The research and policy push has a significant role to play in enabling the green pathway. Given that the technologies in the green pathway are at low TRLs, a concerted effort to reduce the cost of technology can reduce the LCOH by upwards of 2 USD/kg. Reductions in emissions in the system are found to have a substantial cost, and the consideration of indirect emissions also limits the extent to which emissions can be reduced.
Given the choice of multiple technologies, a diverse set of options is chosen. For example, SMNRs are established alongside renewable power generation to tackle intermittency and the need for energy management systems such as batteries to take advantage of dispatchability. Novel technologies can feature prominently in future energy systems, subject to reductions in technology costs. However, some technologies, such as the production of methanol through the catalytic pathway, are markedly expensive and may remain cost-prohibitive even in the coming decades.
This framework is being augmented to include the materials used to establish infrastructure as a means to enable comprehensive life cycle analysis. This will provide a better basis for comparing technology pathways in terms of emissions, as the contributions from materials used can be a major contributor. Additionally, novel technologies may rely on materials with a higher environmental impact. Methods are also being developed to analytically account for uncertainty in model parameters explicitly. These augmentations will also support the development of energiapy, a publicly available Python package for the modeling and analysis of integrated energy systems. The developments towards (i) modeling the energy and material transition simultaneously, (ii) addressing uncertainty in energy systems, and (iii) the working of the energiapy package will be highlighted in future publications.
Author Contributions
Conceptualization, R.K., R.C.A., C.D.D., X.F., I.P., M.M., and E.N.P.; methodology, R.K., R.C.A., C.D.D., X.F., I.P., M.M., and E.N.P.; software, R.K.; formal analysis, R.K., R.C.A., and E.N.P.; investigation, R.K., R.C.A., and E.N.P.; writing—original draft preparation, R.K., R.C.A., and E.N.P.; visualization, R.K.; supervision, E.N.P. All authors have read and agreed to the published version of the manuscript.
Funding
This research was funded by the Texas A&M Energy Institute, Texas A&M University, College Station, TX, USA and Shell International Exploration and Production Inc., Houston, TX, USA.
Data Availability Statement
Conflicts of Interest
Authors C. Doga Demirhan and Mete Mutlu were employed by the company Shell International Exploration and Production Inc., authors Xiao Fu and Iosif Pappas were employed by the company Shell Global Solutions International B.V. The remaining authors declare that the research was conducted in the absence of any commercial or financial relationships that could be construed as a potential conflict of interest.
Abbreviations
The following abbreviations are used in this manuscript:
| AWE | Alkaline water electrolysis |
| AQF | Saline aquifer |
| CAES | Compressed air energy storage |
| CCUS | Carbon capture utilization and storage |
| DAC | Direct air capture |
| DEC | Dense energy carrier |
| DNI | Direct normal irradiance |
| EOR | Enhanced oil recovery |
| GWP | Global warming potential |
| LCOH | Levelized cost of hydrogen |
| MEFC | Catalytic methanol production |
| MIP | Mixed-integer programming |
| MILP | Mixed-integer linear programming |
| MW | Megawatt |
| O&G | Oil and gas |
| PSH | Pumped storage hydropower |
| PV | Photovoltaic |
| RTN | Resource task network |
| SMR | Steam methane reforming |
| SMNR | Small modular nuclear reactor |
| TRL | Technology readiness level |
| WGS | Water–gas shift |
| WF | Wind farm |
References
- Demirhan, C.D.; Tso, W.W.; Powell, J.B.; Pistikopoulos, E.N. A multi-scale energy systems engineering approach towards integrated multi-product network optimization. Appl. Energy 2021, 281, 116020. [Google Scholar] [CrossRef]
- Kakodkar, R.; Sundar, S.; Pistikopoulos, E. Hydrogen-Based Dense Energy Carriers in Energy Transition Solutions. In Handbook of Smart Energy Systems; Springer: Cham, Switzerland, 2022; pp. 1–21. [Google Scholar]
- Zhang, Z.; Pan, S.-Y.; Li, H.; Cai, J.; Olabi, A.G.; Anthony, E.J.; Manovic, V. Recent advances in carbon dioxide utilization. Renew. Sustain. Energy Rev. 2020, 125, 109799. [Google Scholar] [CrossRef]
- Taibi, E.; Gielen, D.; Bazilian, M. The potential for renewable energy in industrial applications. Renew. Sustain. Energy Rev. 2012, 16, 735–744. [Google Scholar] [CrossRef]
- Dieterich, V.; Buttler, A.; Hanel, A.; Spliethoff, H.; Fendt, S. Power-to-liquid via synthesis of methanol, DME or Fischer–Tropsch-fuels: A review. Energy Environ. Sci. 2020, 13, 3207–3252. [Google Scholar] [CrossRef]
- Sun, H.; Edziah, B.K.; Kporsu, A.K.; Sarkodie, S.A.; Taghizadeh-Hesary, F. Energy efficiency: The role of technological innovation and knowledge spillover. Technol. Forecast. Soc. Change 2021, 167, 120659. [Google Scholar] [CrossRef]
- Kakodkar, R.; He, G.; Demirhan, C.D.; Arbabzadeh, M.; Baratsas, S.G.; Avraamidou, S.; Mallapragada, D.; Miller, I.; Allen, R.C.; Gençer, E.; et al. A review of analytical and optimization methodologies for transitions in multi-scale energy systems. Renew. Sustain. Energy Rev. 2022, 160, 112277. [Google Scholar] [CrossRef]
- MefCO2 Consortium. MefCO2 Project. 2019. Available online: https://www.rwe.com/en/research-and-development/rwe-innovation-centre/e-fuels/mefco2/ (accessed on 2 February 2023).
- National Renewable Energy Laboratory. National Renewable Energy Laboratory: 2021 Annual Technology Baseline. 2021. Available online: https://atb.nrel.gov/ (accessed on 2 February 2023).
- IEA. Global Energy Review 2020. 2020. Available online: https://www.iea.org/reports/global-energy-review-2020 (accessed on 2 February 2023).
- United Nations Department of Economic and Social Affairs. The Sustainable Development Goals Report 2019. Available online: https://www.un-ilibrary.org/content/books/9789210478878 (accessed on 2 February 2023).
- Jones, A.C.; Sherlock, M.F. The Tax Credit for Carbon Sequestration (Section 45Q). Congressional Research Service. 2021. Available online: https://sgp.fas.org/crs/misc/IF11455.pdf (accessed on 2 February 2023).
- Demirhan, C.D.; Tso, W.W.; Powell, J.B.; Pistikopoulos, E.N. Sustainable ammonia production through process synthesis and global optimization. AIChE J. 2019, 65, e16498. [Google Scholar] [CrossRef]
- Hugo, A.; Rutter, P.; Pistikopoulos, S.; Amorelli, A.; Zoia, G. Hydrogen infrastructure strategic planning using multi-objective optimization. J. Hydrog. Energy 2005, 30, 1523–1534. [Google Scholar] [CrossRef]
- Ogumerem, G.S.; Tso, W.W.; Demirhan, C.D.; Lee, S.Y.; Song, H.E.; Pistikopoulos, E.N. Toward the Optimization of Hydrogen, Ammonia, and Methanol Supply Chains. IFAC-PapersOnLine 2019, 52, 844–849. [Google Scholar] [CrossRef]
- Tso, W.W.; Demirhan, C.D.; Heuberger, C.F.; Powell, J.B.; Pistikopoulos, E.N. A hierarchical clustering decomposition algorithm for optimizing renewable power systems with storage. Appl. Energy 2020, 270, 115190. [Google Scholar] [CrossRef]
- Tso, W.W.; Demirhan, C.D.; Lee, S.; Song, H.; Powell, J.B.; Pistikopoulos, E.N. Energy carrier supply chain optimization: A Texas case study. Comput. Aided Chem. Eng. 2019, 47, 1–6. [Google Scholar]
- Lindholm, O.; Weiss, R.; Hasan, A.; Pettersson, F.; Shemeikka, J. A MILP Optimization Method for Building Seasonal Energy Storage: A Case Study for a Reversible Solid Oxide Cell and Hydrogen Storage System. Buildings 2020, 10, 123. [Google Scholar] [CrossRef]
- Almansoori, A.; Shah, N. Design and operation of a stochastic hydrogen supply chain network under demand uncertainty. Int. J. Hydrogen Energy 2012, 37, 3965–3977. [Google Scholar] [CrossRef]
- Sabio, N.; Gadalla, M.; Guillén-Gosálbez, G.; Jiménez, L. Strategic planning with risk control of hydrogen supply chains for vehicle use under uncertainty in operating costs: A case study of Spainn. Int. J. Hydrogen Energy 2010, 35, 6836–6852. [Google Scholar] [CrossRef]
- Yáñez, M.; Ortiz, A.; Brunaud, B.; Grossmann, I.E.; Ortiz, I. The use of optimization tools for the Hydrogen Circular Economy. Comput. Aided Chem. Eng. 2019, 46, 1777–1782. [Google Scholar]
- Baratsas, S.G.; Pistikopoulos, E.N.; Avraamidou, S. A quantitative and holistic circular economy assessment framework at the micro level. Comput. Chem. Eng. 2022, 160, 107697. [Google Scholar] [CrossRef]
- Liu, J.; Xu, Z.; Wu, J.; Liu, K.; Guan, X. Optimal planning of distributed hydrogen-based multi-energy systems. Appl. Energy 2021, 281, 116107. [Google Scholar] [CrossRef]
- Ogumerem, G.S.; Kim, C.; Kesisoglou, I.; Diangelakis, N.A.; Pistikopoulos, E.N. A Multi-objective Optimization for the Design and Operation of a Hydrogen Network for Transportation Fuel. Chem. Eng. Res. Des. 2018, 131, 279–292. [Google Scholar] [CrossRef]
- Câmara, D.; Pinto-Varela, T.; Barbósa-Povoa, A.P. Multi-objective optimization approach to design and planning hydrogen supply chain under uncertainty: A Portugal study case. Comput. Aided Chem. Eng. 2019, 46, 1309–1314. [Google Scholar]
- Dwivedi, S.K.; Vishwakarma, M. Hydrogen embrittlement in different materials: A review. Int. J. Hydrogen Energy 2018, 43, 21603–21616. [Google Scholar] [CrossRef]
- Palys, M.J.; Daoutidis, P. Optimizing renewable ammonia production for a sustainable fertilizer supply chain transition. ChemSusChem 2023, 16, E202300563. [Google Scholar] [CrossRef] [PubMed]
- Palys, M.J.; Allman, A.; Daoutidis, P. Exploring the benefits of modular renewable-powered ammonia production: A supply chain optimization study. Ind. Eng. Chem. Res. 2018, 58, 5898–5908. [Google Scholar] [CrossRef]
- Allman, A.; Daoutidis, P.; Tiffany, D.; Kelley, S. A framework for ammonia supply chain optimization incorporating conventional and renewable generation. AIChE J. 2017, 63, 4390–4402. [Google Scholar] [CrossRef]
- Villicana-Garcia, E.; El-Halwagi, M.M.; Ponce-Ortega, J.M. Involving economic incentives in optimizing the methanol supply chain considering conventional and unconventional resources. Appl. Therm. Eng. 2020, 166, 114622. [Google Scholar] [CrossRef]
- Sánchez, A.; Martín, M.; Zhang, Q. Optimal design of sustainable power-to-fuels supply chains for seasonal energy storage. Energy 2021, 234, 121300. [Google Scholar] [CrossRef]
- Nuttall, W.J.; Bakenne, A.T. Introduction—The hydrogen economy today. In Fossil Fuel Hydrogen; Technical, Economic and Environmental Potential; Springer: Cham, Switzerland, 2020; pp. 1–14. [Google Scholar]
- Ren, B.; Male, F.; Duncan, I.J. Economic analysis of CCUS: Accelerated development for CO2 EOR and storage in residual oil zones under the context of 45Q tax credit. Appl. Energy 2022, 321, 119393. [Google Scholar] [CrossRef]
- Department of Energy. DOE Technical Targets for Hydrogen Production from Electrolysis. 2020. Available online: https://www.energy.gov/eere/fuelcells/doe-technical-targets-hydrogen-production-electrolysis#central (accessed on 2 February 2023).
- IEA. The Future of Hydrogen. 2019. Available online: https://www.iea.org/reports/the-future-of-hydrogen (accessed on 2 February 2023).
- Becker, H.; Murawski, J.; Shinde, D.V.; Stephens, I.E.L.; Hinds, G.; Smith, G. Impact of impurities on water electrolysis: A review. Sustain. Energy Fuels 2023, 7, 1565–1603. [Google Scholar] [CrossRef]
- Kovač, A.; Marčiuš, D.; Budin, L. Solar hydrogen production via alkaline water electrolysis. Int. J. Hydrogen Energy 2019, 44, 9841–9848. [Google Scholar] [CrossRef]
- Wang, M.; Wang, Z.; Gong, X.; Guo, Z. The intensification technologies to water electrolysis for hydrogen production—A review. Renew. Sustain. Energy Rev. 2014, 29, 573–588. [Google Scholar] [CrossRef]
- Ogumerem, G.S.; Pistikopoulos, E.N. Parametric optimization and control toward the design of a smart metal hydride refueling system. AIChE J. 2019, 65, e16680. [Google Scholar] [CrossRef]
- Bahruji, H.; Esquius, J.R.; Bowker, M.; Hutchings, G.; Armstrong, R.D.; Jones, W. Solvent Free Synthesis of PdZn/TiO2 Catalysts for the Hydrogenation of CO2 to Methanol. Top. Catal. 2018, 61, 144–153. [Google Scholar] [CrossRef]
- Heuberger, C.F.; Staffell, I.; Shah, N.; Dowell, N.M.; Davison, J. An MILP Modeling Approach to Systemic Energy Technology Valuation in the 21st Century Energy System. Energy Procedia 2017, 114, 6358–6365. [Google Scholar] [CrossRef]
- Hussein, E.M.A. Emerging small modular nuclear power reactors: A critical review. Phys. Open 2020, 5, 100038. [Google Scholar] [CrossRef]
- Thomas, S.; Ramana, M.V. A hopeless pursuit? National efforts to promote small modular nuclear reactors and revive nuclear power. Wiley Interdiscip. Rev. Energy Environ. 2022, 11, e429. [Google Scholar] [CrossRef]
- Mignacca, B.; Locatelli, G. Economics and finance of Small Modular Reactors: A systematic review and research agenda. Renew. Sustain. Energy Rev. 2020, 118, 109519. [Google Scholar] [CrossRef]
- Lloyd, C.A.; Roulstone, T.; Lyons, R.E. Transport, constructability, and economic advantages of SMR modularization. Prog. Nucl. Energy 2021, 134, 103672. [Google Scholar] [CrossRef]
- Laturkar, K.; Laturkar, K. Advances in Very Small Modular Nuclear Reactors; Springer: Berlin/Heidelberg, Germany, 2022. [Google Scholar]
- Schimpe, M.; Naumann, M.; Truong, N.; Hesse, H.C.; Santhanagopalan, S.; Saxon, A.; Jossen, A. Energy efficiency evaluation of a stationary lithium-ion battery container storage system via electro-thermal modeling and detailed component analysis. Appl. Energy 2018, 210, 211–229. [Google Scholar] [CrossRef]
- Ozdemir, A.T.; Ustkoyuncu, N.; Bakoglu, N.U.; Ozsoy, F.; Patat, S. Temperature Effects on Calendar Aging of Lithium-Ion and Nickel Metal Hydride Batteries. IOP Conf. Ser. Mater. Sci. Eng. 2018, 453, 012010. [Google Scholar] [CrossRef]
- Liu, W.; Liu, L.; Zhou, L.; Huang, J.; Zhang, Y.; Xu, G.; Yang, Y. Analysis and optimization of a compressed air energy storage—Combined cycle system. Entropy 2014, 16, 3103–3120. [Google Scholar] [CrossRef]
- Rogers, A.; Henderson, A.; Wang, X.; Negnevitsky, M. Compressed air energy storage: Thermodynamic and economic review. In Proceedings of the 2014 IEEE PES General Meeting, Conference & Exposition, National Harbor, MD, USA, 27–31 July 2014; IEEE: Piscataway, NJ, USA, 2014; pp. 1–5. [Google Scholar]
- McQueen, N.; Gomes, K.V.; McCormick, C.; Blumanthal, K.; Pisciotta, M.; Wilcox, J. A review of direct air capture (DAC): Scaling up commercial technologies and innovating for the future. Prog. Energy 2021, 3, 032001. [Google Scholar] [CrossRef]
- Shi, X.; Lin, Y.; Chen, X. Development of sorbent materials for direct air capture of CO2. MRS Bull. 2022, 47, 405–415. [Google Scholar] [CrossRef]
- Baena-Moreno, F.M.; Rodríguez-Galán, M.; Vega, F.; Alonso-Fariñas, B.; Vilches Arenas, L.F.; Navarrete, B. Carbon capture and utilization technologies: A literature review and recent advances. Energy Sources Part A Recover. Util. Environ. Eff. 2019, 41, 1403–1433. [Google Scholar] [CrossRef]
- Bui, M.; Adjiman, C.S.; Bardow, A.; Anthony, E.J.; Boston, A.; Brown, S.; Fennell, P.S.; Fuss, S.; Galindo, A.; Hackett, L.A.; et al. Carbon capture and storage (CCS): The way forward. Energy Environ. Sci. 2018, 11, 1062–1176. [Google Scholar] [CrossRef]
- Núñez-López, V.; Moskal, E. Potential of CO2-EOR for near-term decarbonization. Front. Clim. 2019, 1, 5. [Google Scholar] [CrossRef]
- Michael, K.; Golab, A.; Shulakova, V.; Ennis-King, J.; Allinson, G.; Sharma, S.; Aiken, T. Geological storage of CO2 in saline aquifers—A review of the experience from existing storage operations. Int. J. Greenh. Gas Control 2010, 4, 659–667. [Google Scholar] [CrossRef]
- Bünger, U.; Michalski, J.; Crotogino, F.; Kruck, O. Large-scale underground storage of hydrogen for the grid integration of renewable energy and other applications. In Compendium of Hydrogen Energy; Elsevier: Amsterdam, The Netherlands, 2016; pp. 133–163. [Google Scholar]
- Cappa, F.; Rutqvist, J. Impact of CO2 geological sequestration on the nucleation of earthquakes. Geophys. Res. Lett. 2011, 38. [Google Scholar] [CrossRef]
- Keith, D.W.; Holmes, G.; Angelo, D., St.; Heidel, K. A Process for Capturing CO2 from the Atmosphere. Joule 2018, 2, 1573–1594. [Google Scholar] [CrossRef]
- Breyer, C.; Fasihi, M.; Bajamundi, C.; Creutzig, F. Direct Air Capture of CO2: A Key Technology for Ambitious Climate Change Mitigation. Joule 2019, 3, 2053–2057. [Google Scholar] [CrossRef]
- Fasihi, M.; Efimova, O.; Breyer, C. Techno-economic assessment of CO2 direct air capture plants. J. Clean. Prod. 2019, 224, 957–980. [Google Scholar] [CrossRef]
- Mongird, K.; Viswanathan, V.; Balducci, P.; Alam, J.; Fotedar, V.; Koritarov, V.; Hadjerioua, B. An evaluation of energy storage cost and performance characteristics. Energies 2020, 13, 3307. [Google Scholar] [CrossRef]
- Stamford, L.; Azapagic, A. Environmental impacts of photovoltaics: The effects of technological improvements and transfer of manufacturing from Europe to China. Energy Technol. 2018, 6, 1148–1160. [Google Scholar] [CrossRef]
- Bhandari, R.; Kumar, B.; Mayer, F. Life cycle greenhouse gas emission from wind farms in reference to turbine sizes and capacity factors. J. Clean. Prod. 2020, 277, 123385. [Google Scholar] [CrossRef]
- Carless, T.S.; Griffin, W.M.; Fischbeck, P.S. The environmental competitiveness of small modular reactors: A life cycle study. Energy 2016, 114, 84–99. [Google Scholar] [CrossRef]
- Bicer, Y.; Dincer, I. Comparative life cycle assessment of hydrogen, methanol and electric vehicles from well to wheel. Int. J. Hydrog. Energy 2017, 42, 3767–3777. [Google Scholar] [CrossRef]
- Bahruji, H.; Bowker, M.; Jones, W.; Hayward, J.; Ruiz Esquius, J.; Morgan, D.J.; Hutchings, G.J. PdZn catalysts for CO2 hydrogenation to methanol using chemical vapour impregnation (CVI). Faraday Discuss. 2017, 197, 309–324. [Google Scholar] [CrossRef]
- Kakodkar, R. An Integrated Framework and Software Prototype for Multi-Scale Energy Systems Engineering. Master’s Thesis, Texas A&M University, College Station, TX, USA, 2021. [Google Scholar]
- Gurobi Optimization, LLC. Gurobi Optimizer Reference Manual. 2022. Available online: https://www.gurobi.com (accessed on 2 February 2023).
- Authority, P.R.P. Battery Energy Storage Technology Assessment; Platte River Power Authority: Fort Collins, CO, USA, 2017. [Google Scholar]
- Bellotti, D.; Rivarolo, M.; Magistri, L.; Massardo, A. Feasibility study of methanol production plant from hydrogen and captured carbon dioxide. J. CO2 Util. 2017, 21, 132–138. [Google Scholar] [CrossRef]
- Global CCS Institute. The Costs of CO2 Storage. 2010. Available online: https://www.globalccsinstitute.com/archive/hub/publications/119816/costs-co2-storage-post-demonstration-ccs-eu.pdf (accessed on 2 February 2023).
- Papadias, D.; Ahluwalia, R. Bulk storage of hydrogen. Int. J. Hydrogen Energy 2021, 46, 34527–34541. [Google Scholar] [CrossRef]
- Parkinson, B.; Tabatabaei, M.; Upham, D.C.; Ballinger, B.; Greig, C.; Smart, S.; Mc- Farland, E. Hydrogen production using methane: Techno-economics of decarbonizing fuels and chemicals. Int. J. Hydrogen Energy 2018, 43, 2540–2555. [Google Scholar] [CrossRef]
- Yates, J.; Daiyan, R.; Patterson, R.; Egan, R.; Amal, R.; Ho-Baille, A.; Chang, N.L. Techno-economic analysis of hydrogen electrolysis from off-grid stand-alone photovoltaics incorporating uncertainty analysis. Cell Rep. Phys. Sci. 2020, 1, 100–209. [Google Scholar] [CrossRef]
| Disclaimer/Publisher’s Note: The statements, opinions and data contained in all publications are solely those of the individual author(s) and contributor(s) and not of MDPI and/or the editor(s). MDPI and/or the editor(s) disclaim responsibility for any injury to people or property resulting from any ideas, methods, instructions or products referred to in the content. |
© 2024 by the authors. Licensee MDPI, Basel, Switzerland. This article is an open access article distributed under the terms and conditions of the Creative Commons Attribution (CC BY) license (https://creativecommons.org/licenses/by/4.0/).


 ,
, 


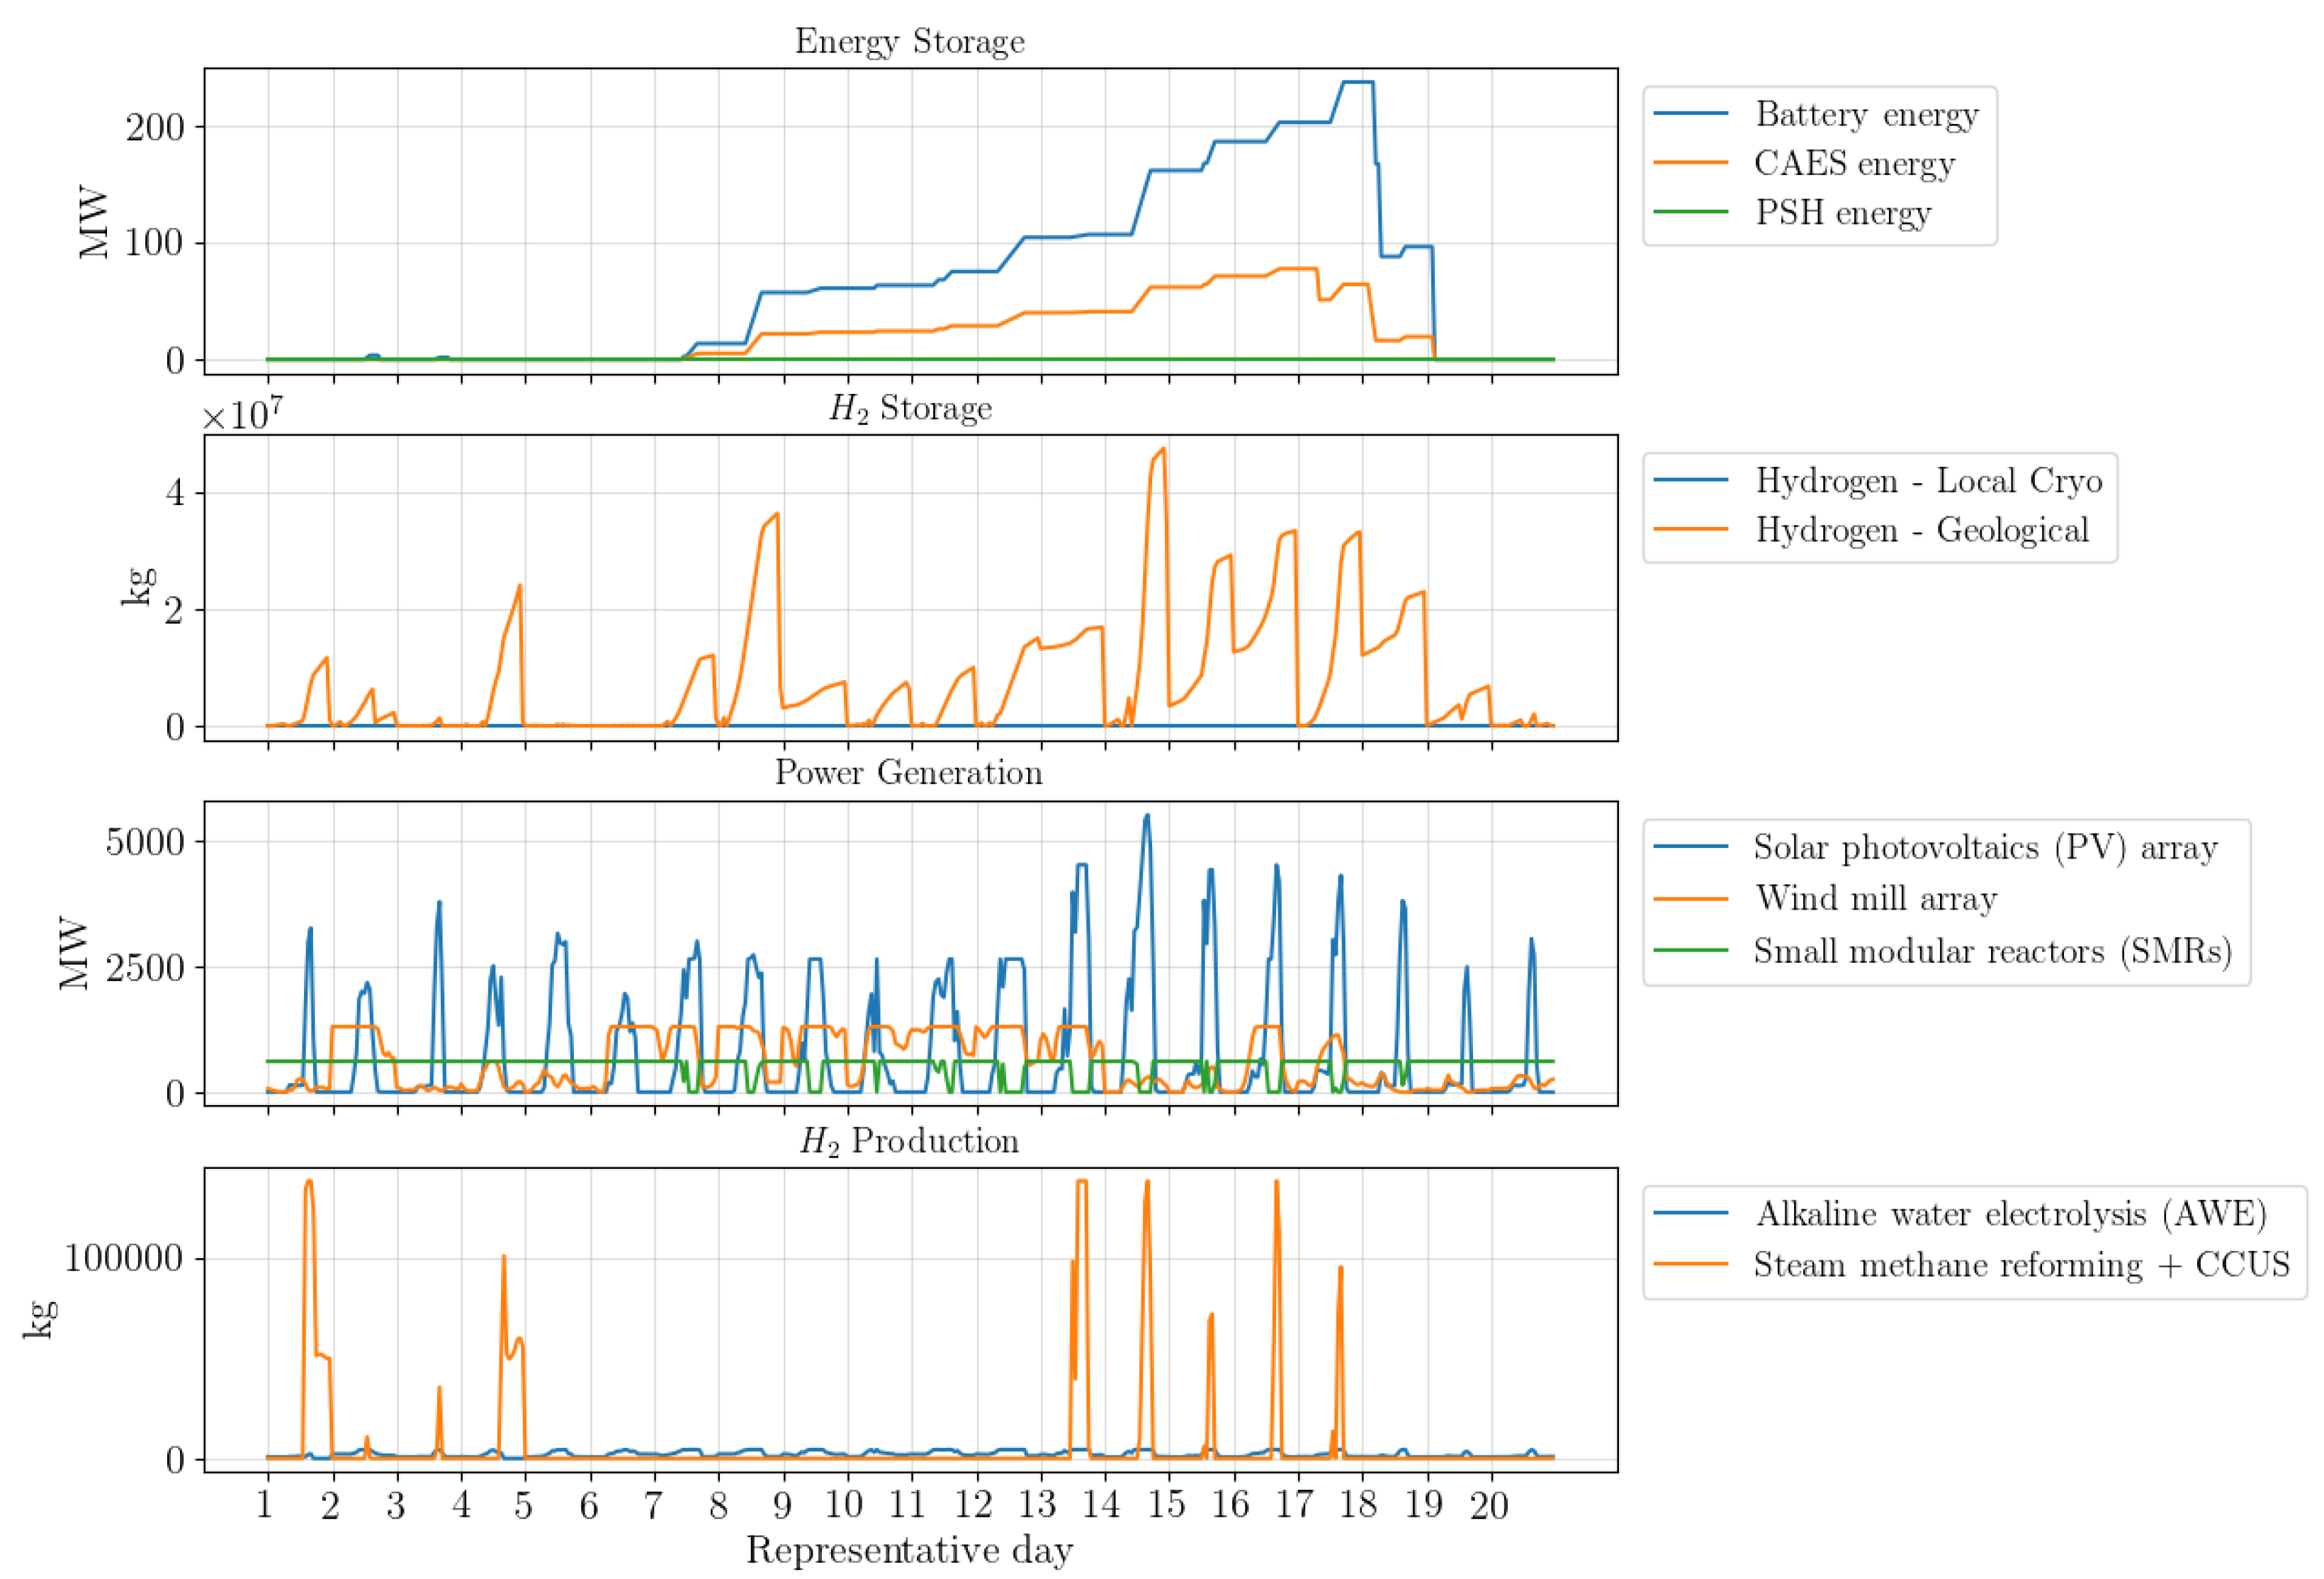