
Mechanisms of Plasma Actuators Controlling High-Aspect-Ratio Rectangular Jet Width for Automobile Air Conditioning Systems

School of Environment and Society, Tokyo Institute of Technology, Tokyo 152-8550, Japan
*
Author to whom correspondence should be addressed.
Fluids 2023, 8(7), 186; https://doi.org/10.3390/fluids8070186
Submission received: 26 April 2023
/
Revised: 14 June 2023
/
Accepted: 16 June 2023
/
Published: 21 June 2023
(This article belongs to the Special Issue Turbulent Flow, 2nd Edition)
Abstract
:High-aspect-ratio (HAR) rectangular jets have attracted attention in automobile air conditioning (A/C) systems and turbulent jet applications owing to their excellent air delivery and mixing and attractive interior design. Active flow control (AFC) of rectangular jets using plasma actuators (PAs) has proven to be a promising technique because the actuator is simple, has low energy consumption, and can create flow features without interference. This research aims to understand the interaction between PAs and flow from a HAR rectangular nozzle using hot-wire anemometry, particle image velocimetry, and theoretical studies. Understanding how PAs affect the flow is beneficial for designing air vents to fit automobile A/C systems and various engineering applications by recreating the flow features with other AFC techniques and actuators. The combination of periodic excitation and vectoring effects transfers the flow’s mean energy to organized structures—known as spanwise vortexes—as large as 6 mm. The interaction between these coherent structures and the dissipative environment compresses the vortexes, resulting in the flow converging on the spanwise–streamwise (X–Z) plane and diverging on the transverse–streamwise (X–Y) plane. HAR rectangular jet flow features controlled by PAs can be predicted for specific cases by calculating the Strouhal number based on PA operating parameters.
1. Introduction
Maintaining thermal comfort in car passenger cabins has long been a focus for HVAC (heating, ventilation, and air conditioning) applications as well as automakers. In that context, high-aspect-ratio (HAR) rectangular air vents have become increasingly popular in modern automobiles due to their numerous benefits to fit the various thermal conditions of automobiles. The main reasons for using high-aspect-ratio rectangular air vents in automobiles is to improve the overall airflow within the vehicle. These vents are typically larger than traditional circular vents, which means that they can provide more air flow with less effort and fewer air vents [1]. Another benefit of high-aspect-ratio rectangular air vents is their ability to blend seamlessly into a vehicle’s interior design, which is why they can be found in both prototype and commercialized automobile models. Automobile interior designers like to utilize HAR rectangular jets as these vents have a sleek and modern appearance and can easily be integrated into a vehicle’s dashboard without interfering with its overall aesthetic [1].
Numerous studies on HAR rectangular jet properties and applications have been undertaken, including a textbook containing the work of Rajaratnam [2] and Shakouchi on the fundamentals of jet flow engineering [3]. Yang et al. [4] investigated the development process of jets issued from various nozzle shapes. By changing the outlet Reynolds number and aspect ratio (AR) of the nozzle, they discovered that the distribution of streamwise and spanwise vortices in the flow field of the rectangular jet significantly influences the jet development and mixing characteristics. The influences of the geometric profile on the properties of a rectangular jet were studied by Deo et al. [5].
However, using HAR rectangular jets in automobile air conditioning applications still has challenges. The velocity and temperature far from the rectangular jet nozzle are challenging to control due to the energy-diffusive nature of the rectangular jet emitted into the still air. As a high-aspect-ratio rectangular jet has a narrow opening, the centerline velocity and temperature decay quickly after some distance from the outlet. Therefore, the velocity and temperature are insufficient to provide thermal comfort when the air reaches the passengers’ positions. This is also related to the Kelvin–Helmholtz instability, which can lead to mixing between the fluid in the core of the jet and in the surroundings, resulting in decreased performance in velocity and temperature. As the jet spreads, minor disturbances begin to form, resulting in the formation of vortices and the breakdown of laminar flow (or the potential core region) [6]. As the vortices grow from disturbances (small in size and number) to “roll-up” vortexes, they begin interacting with each other, creating even more disturbances in the flow. HAR rectangular jet air vents are generally positioned horizontally on the dashboard, while the passengers sit vertically inside the automobile. Thus, only a local area of the passenger body can directly receive the conditioned air from the HVAC system. It is desirable to have all the thermal-sensitive human body parts conditioned to achieve better thermal comfort [7]. Consequently, spreading HAR rectangular jets in the vertical direction is also preferable for this application. To achieve both jet centerline velocity and temperature improvement and jet spreading is problematic due to the nature of the jet. Therefore, actively controlling the HAR rectangular jet with various effects to fit the different needs of passengers will benefit this novel AC air vent.
There are two approaches for controlling turbulent jets: passive flow control and active flow control. The passive control approach creates a persistent change in flow; consequently, it is only suitable for the stationary deployment of jets. Compared to other types of actuators, a plasma actuator (PA) as an active flow controlling device is relatively simple (as it is only made from copper tape, dielectric tape, and acrylic plate). The actuator is well-known for its ability to actively control the flow by plasma-discharge-induced wind in the near-wall region. The actuator is described in detail in review articles that highlight the capabilities of PAs through examples from experiments and simulations by Corke et al. [8], Kriegseis et al. [9], Moreau et al. [10], Benard et al. [11], and Kotsonis [12]. PAs consume less energy than the main flow’s kinetic energy and heat flux to achieve flow manipulation to control the velocities and temperatures of jets [13]. The plasma created by an alternating-current-driven DBD plasma actuator is non-thermal plasma in which heavy species have temperatures close to ambient while electron temperatures are substantially higher [14]. The energy is primarily stored in electrons and so does not contribute to fluid heating [10]. As a result, the PA thermal effect is not responsible for the induced flow created by the actuator and does not affect the flow control [15]. Benard et al. [16] developed an active control device for a circular jet comprised of two PAs combined with a passive diffuser to significantly improve free shear layer mixing. This resulted in increased jet spreading, a shortened potential core, and increased turbulent kinetic energy. Corke et al. [17] used phased plasma arrays to control unsteady flow. Their findings showed that a two-frequency phased plasma array could influence mean and unsteady flow development by increasing PA-induced velocities compared to a single-frequency, single-phase plasma approach.
Many studies have shown that various actuators can control turbulent jet mixing and spreading rates using appropriate excitation at the jet exit. By utilizing pulsed fluidic piezoelectric wedge actuators, large spreading can be achieved with significant increases in mixing over subsonic and transonic rectangular jets [18]. With a modification to the nozzle, a fluidic system using self-excited global oscillations is established in the jet by applying suction to an annular cavity placed around the jet periphery [19]. These oscillations are responsible for enhanced mixing between the jet and surrounding fluid, and the increased mixing is not affected by the jet’s initial conditions. Acoustic excitation to control turbulent jet flow has been studied in-depth by Ginevsky et al. [20]. Another attempt by Suzuki et al. [21] using microelectromechanical systems (MEMS) also demonstrated the efficiency of promoting the initial instabilities of axisymmetric jet flows. A pair of PAs were effective in controlling the rectangular jet width, as investigated by Kozato et al. [22], when there was a phase difference between the upper and lower PAs. Even though much research has reported that plasma actuators and other AFC actuators can achieve the turbulent-jet-spreading phenomena [18,22], there are still research gaps in understanding how these actuators interact with the main flow, the mechanism in terms of fluid dynamics to control the HAR rectangular jet width, and how to predict the outcome of the control using the input parameter.
Owing to its benefits, the PA is a promising active control tool for high-aspect-ratio rectangular jet mixing and spreading. The control signal can be easily changed to achieve different effects without introducing new hardware in the flow. The current work is a continuation of our previous study on the PA’s effect on controlling HAR (20) rectangular jets for automobile air conditioning systems to discover the effects of plasma actuators on HAR rectangular jet flow with a focus on improving the centerline velocity and temperature at the driver’s location [13]. In this research, the aim is to fill the research gaps in understanding the mechanism of how plasma actuators interact with the flow and change the HAR rectangular jet width—which significantly affects the jet’s mixing and the velocity and temperature performance—by means of flow visualization, experiment measurements, and theoretical studies. As a result, the flow features can be recreated by other active flow control techniques or actuators to apply in automobile air conditioning systems and other engineering applications.
2. Experiment Setup
2.1. Flow Visualization and Measurement Setup
The flow visualization system contained a 1 mm-thick laser sheet (G100, KATOKOKEN CO 100 MW wavelength 532 nm, Kanagawa, Japan) to visualize the flow, a smoke generator (PS-2006, DAINICHI, Niigata, Japan) to inject seeding particles from olive oil with a mean diameter of approximately 1 m into the flow, and a high-speed camera (Phantom V711 by Vision Research Inc., Wayne, NJ, USA) with 1280 × 800 pixel resolution. The smoke was injected into the inlet of the wind tunnel; then, it traveled through the main fan, a diffusion screen, a honeycomb mesh, a flow-straightener mesh, and a nozzle contraction to the HAR rectangular jet outlet; this ensured the mixture of air and smoke was well-blended and uniform. The camera was mounted normally to the laser sheet to record video for analysis. The laser sheet illuminated these particles at the X–Z top-view and X–Y side-view planes, as shown in Figure 1. Then, videos were recorded at 2000 fps for 5 s and were analyzed using PIVlab software embedded in MATLAB by Thielicke et al. [23]. Typical flow rates ranged from 1 to 9 pixels per frame. The velocity vector field was calculated using the multi-pass FFT window deformation PIV algorithm with: 4 passes and interrogation regions of 64 × 64, 32 × 32, 16 × 16, and 8 × 8 pixels with 50% overlap. The PIV measurement’s uncertainty was assessed by comparing it to the velocity measurement by hot-wire and was found to be less than 11%.
Hot-wire anemometry was implemented to measure velocity, integral length, and dissipation length scale and analyze the energy density spectrum at specific points. The system included a mini hot-wired constant temperature anemometer (54T42, Dantec Dynamics, Skovlunde, Denmark), miniature X-wire probe (55P61, Dantec Dynamics) for measuring U- and V-velocity components, and probe support (55H25, Dantec Dynamics) for mounting the hot-wire probe. The raw voltage data were collected using a data acquisition device (DAQ, PCI-6133, National Instruments, Austin, TX, USA). The hot-wire probe was calibrated with the probe located in the middle of the outlet of the wind tunnel. The calibration velocity ranged from 0 to 7 m/s, and the wire voltage was recorded at each velocity. These calibration data were used to convert the wire voltage to velocity. The equipment was grounded to prevent contamination from the high-voltage and high-frequency signal from the plasma actuator power supply that could affect the measured hot-wire voltage data. After that, a preliminary velocity test when the PA was operating was conducted to ensure the raw signal was clear.
Turbulent energy density spectra, integral length scale, and dissipation length scale were calculated to evaluate the different scales in the flow by processing the velocity data. The technique for calculating these parameters is well explained in the work of El-Gabry et al. [24]. The procedure is summarized as follows:
- The raw voltage data from hot-wire measurement were collected at a 50-kHz sampling rate within 3 s for each measurement point and converted to velocity. From here, the velocity trace of the flow was obtained for further processing.
- Velocity data were processed for spectral analysis to convert the signal from time-series to frequency domain using a fast Fourier transformation (FFT) to obtain the velocity fluctuations’ power spectral density (PSD). The PSD was analyzed to identify the frequency band corresponding to the length scales of interest.
- The integral length scale L (macro-scale) can be calculated by Equation (1) and the dissipation length scale l (micro-scale) can be calculated by Equation (2). Both use the method shown by Roach [25]:where:—the mean of the U-velocity;—the standard deviation of the U-velocity;—the energy corresponding to the frequency from the energy spectrum.
- Repeat for all the measuring points.
The traverse system affixed the hot-wire anemometry system to a controlled XYZ traverse system. This traverse system consisted of an Arduino UNO board as a microcontroller, three stepper motors, and three stepper motor drivers. The system was positioned along the X-, Y-, and Z-axis with a precision of ±0.02 mm. A workstation PC with MATLAB installed collected the hot-wire measurement data through the DAQ device and the output measuring point XYZ coordinates to the traverse system as the experimental plan.
2.2. High-Aspect-Ratio Rectangular Jet with Plasma Actuator
An open-channel wind tunnel (WGT-10 by Tsukubarika Seiki Co., Ltd., Tsukuba, Ibaraki, Japan) created the flow for the test. A HAR rectangular jet was selected as the subject to investigate PAs. Because the outlet of the wind tunnel was larger than the nozzle size, a contraction was made to constrain the flow to the designed nozzle size; we referred to the well-shaped nozzle contraction design found in [26]. The contraction and nozzle structure are shown in Figure 2. The nozzle housing was attached after the contraction to hold the modular rectangular nozzle consisting of Parts a and b to replace the PA when it breaks. The contraction and nozzle housing were 3D printed with ABS by a fused deposition modeling AirWolf AXIOM(Las Vegas, NV, USA) dual extruder 3D printer. The nozzle interior surface was treated with 120, 200, 400, and 800 sandpapers to smooth out the imperfections created on the surface by the 3D-printing process. Filler primer, spot putty, and paint were applied to achieve a smooth inner surface with a roughness of 11 ± 1 m. Parts a and b were laser cut from a 4 mm-thick acrylic board with dimensions as shown in Figure 3. Next, all the parts were put together to form a HAR rectangular nozzle with a ratio of 20 (width B = 150 mm and height h = 7.5 mm) as can be seen in Figure 4. Because the AR is greater than 5, the jet is classified as a HAR rectangular jet [2].
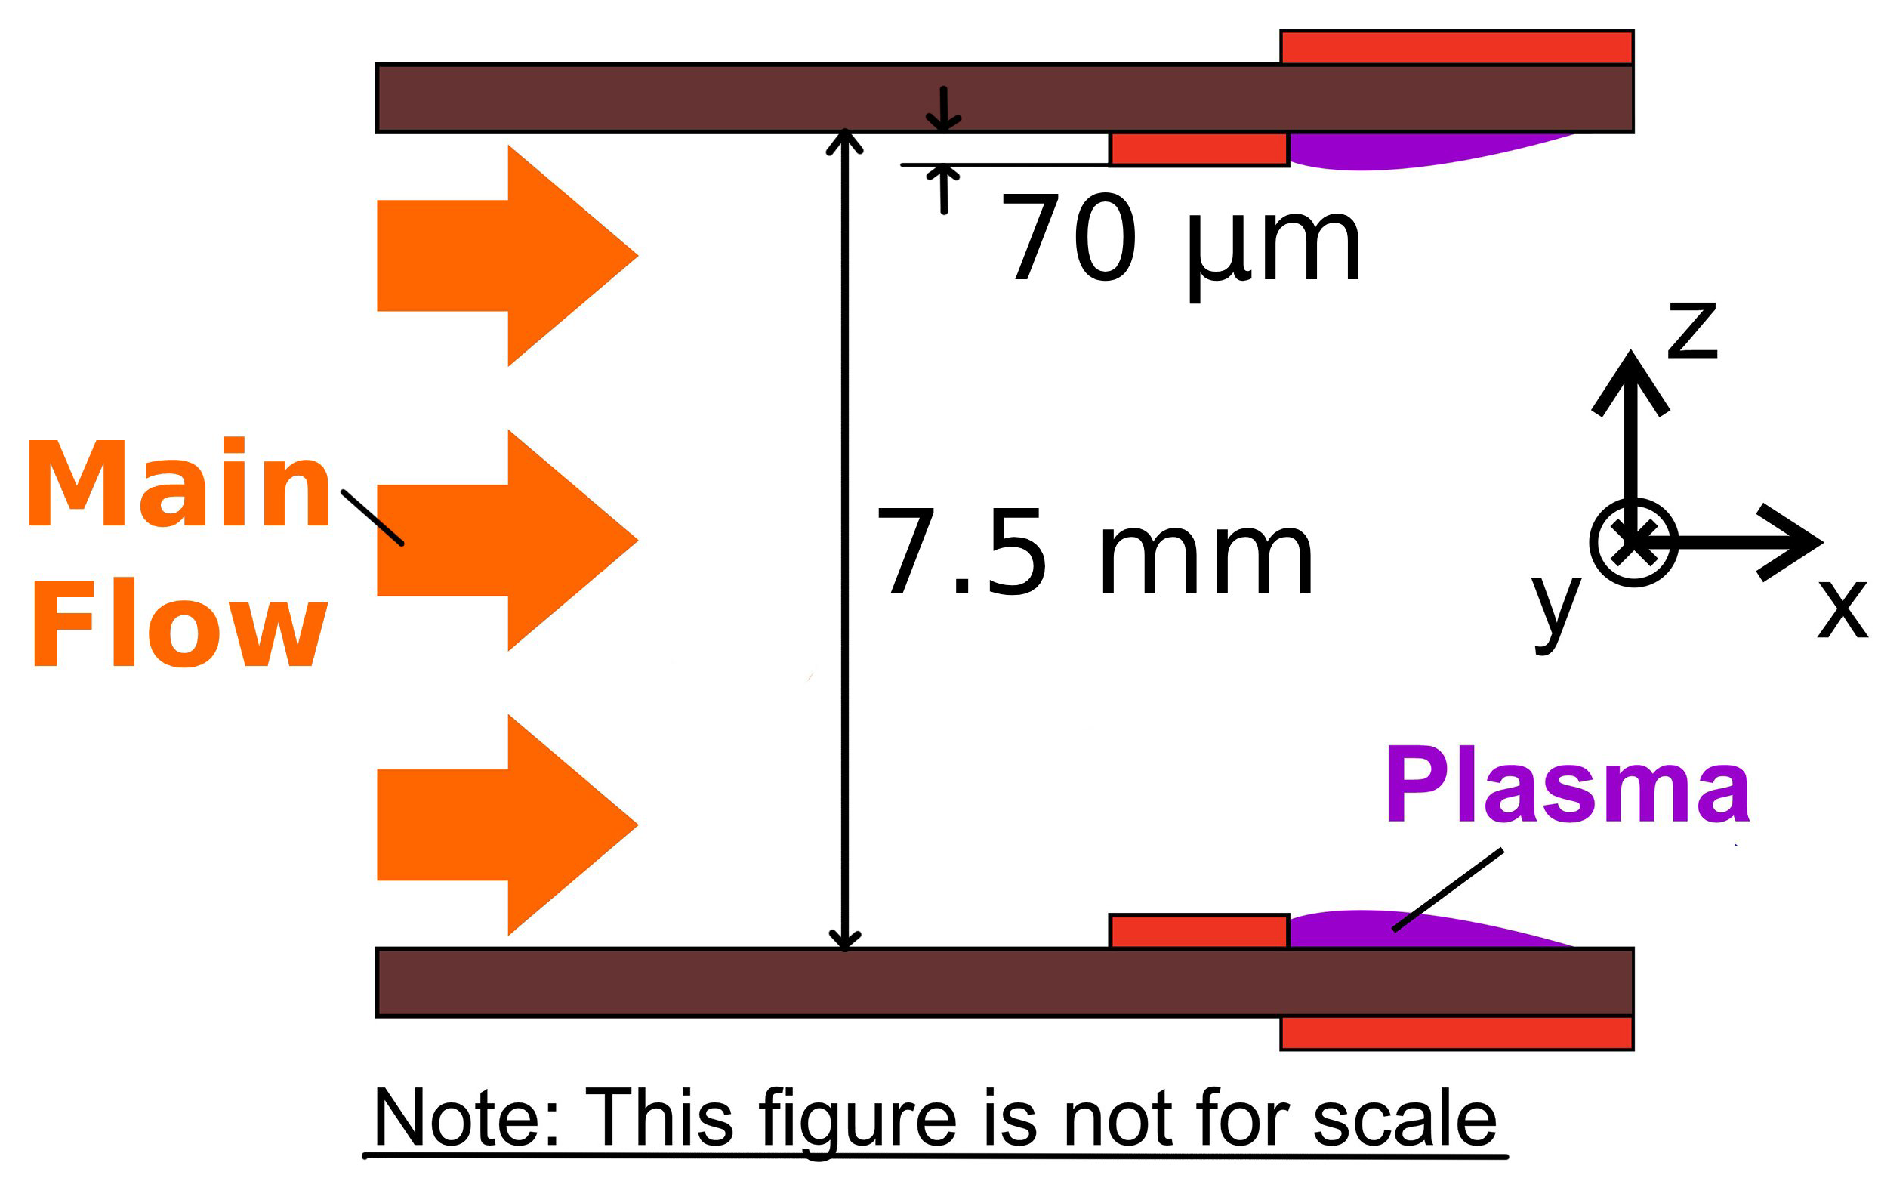
Two PAs were constructed on the tip of the nozzle. Each actuator was composed of an exposed electrode, an electrode covered in copper, and two layers of dielectric material made of a polyamide (Figure 3). The plasma actuator versus the flow direction is illustrated in Figure 5 to describe the forcing direction of the induced flow by PA. The procedure to make the PA from copper and polyamide tape is fully described by Fukagata et al. [27]. The technique for constructing a DBD PA is as follows.
- Cut copper adhesive tape to the designed width and length and paste it onto the edge of Part a (as shown in Figure 3); this becomes the copper-covered electrode. Then, cut the polyamide adhesive tape and attach it next to the copper-covered electrode to complete the first layer.
- Take two layers of polyamide tape and paste them on top of the first layer to create the dielectric layers. These become the second and third layers of the PA.
- Cut copper adhesive tape to the width and length of the exposed electrode and paste it on top of the third layer at the designed position.
The PAs were driven by a high-voltage, high-frequency power supply (PSI-PA1050N, PSI Co., Ltd., Tokyo, Japan). The multi-function I/O device (National Instruments PCI-6133, Austin, TX, USA) generated a pulse-width modulation signal with a duty cycle D ranging from 0% to 100% to control the plasma power supply to generate a high-voltage, high-frequency, pulse-width modulation sinusoidal wave. An oscilloscope was utilized to monitor the signal for precise adjustment of the PA working condition determined by the following parameters: , , , and as the peak-to-peak voltage, base frequency, modular frequency, and phase difference between the upper and lower PAs, respectively. The phase difference between the upper and lower PAs determined the operating time between the two PAs; values of zero and mean that the two PAs were operating simultaneously and alternately, respectively. Details of the experimental conditions are listed in Table 1. The Reynolds number of the HAR rectangular jet was calculated to be equal 2150; the flow was turbulent, as > 2000 [28]. The pressure loss measurement was conducted between two cases: with no PA and the base case with two PAs installed. The results in Figure 6 show that the pressure loss caused by the plasma actuator is negligible, as the intrusion (70 m × 2) of the PAs to the flow is minor compared with the nozzle width (7.5 mm) and the boundary layer thickness (1.5 mm). This means the installation of the PAs had no effect on the HAR rectangular jet flow, and the control effect stemmed from the plasma-induced-flow. The non-disturbed jet exit velocity profiles were also measured to confirm symmetry and uniformity (details can be found in the previous work [13]).
Based on the authors’ previous work [13], notable cases—as displayed in Table 2—were selected to conduct particle image velocimetry (PIV) flow visualization and hot-wire measurement to analyze jet width diverging and converging mechanisms. The details of establishing the test conditions can be found in the authors’ previous work. Because this research aimed to investigate the mechanism of plasma actuators controlling high-aspect–ratio rectangular jet width for automobile air conditioning applications, cases were chosen based on the performance of velocity and temperature. These cases were selected based on the values of the data (the highest and the lowest in velocity and temperature data) after screening 362 PA conditions as the combination of three parameters: modular frequency (50–1000 Hz), duty cycle (0.1–0.9), and phase difference (0 and ) from the centerline where = 70, also known as the driver’s location. During the experiment, the ambient temperature and the outlet temperature were controlled at 40 C and 12 C, respectively, and the experiment was conducted inside a controlled temperature chamber to mimic the confined space inside an automobile cabin on a hot-weather day. The normalized temperature described by Equation (3) was used to evaluate all the temperature results between all measurement points. From Equation (3), it is noted that the normalized temperature is inversely proportional to the measured temperature, which means “higher normalized temperature” means “lower measured temperature” and vice versa. This is due to the upper and lower parts of the numerator on the right side of the equation being negative after calculation in the given experiment condition. Lastly, there was no dummy for the driver because it would have created obstacles in the flow field and changed its characteristics.
where:
- —temperature measured at a point in space;
- —ambient temperature inside the temperature-controlled chamber;
- —temperature at the outlet of the nozzle, where = (0, 0, 0).
From the conclusion of the previous research, when compared to the duty cycle, it is known that the modular frequency significantly affects the velocity of the rectangular jet at the driver’s location. On the other hand, changing the duty cycle has a more significant impact on temperature than changing the modular frequency. The natural frequency of the flow caused by KHI measured at the shear layer where = 3, = 0.5, and = 0 was about 400 Hz, which is also included in the scanning range of the modular frequency. Driving the flow with the modular frequency equal to the natural frequency of the flow has no significant effect on the velocity and temperature at the driver’s location. Furthermore, PAs can perform velocity control with only a minor amount of power compared to the kinetic energy flux and thermal energy flux of the HAR rectangular jet flow, which means the flow manipulation caused the changes in the flow, not the energy injection into the flow (also see [13]).
After the cases were chosen, all velocity measurements and visualizations were conducted at room temperature to avoid the influence of temperature changes and the effects of buoyancy on hot-wire anemometer and visualization results.
3. Results and Discussion
3.1. Flow Features and Turbulent Structure of High-Aspect-Ratio Rectangular Jet Controlled by PAs
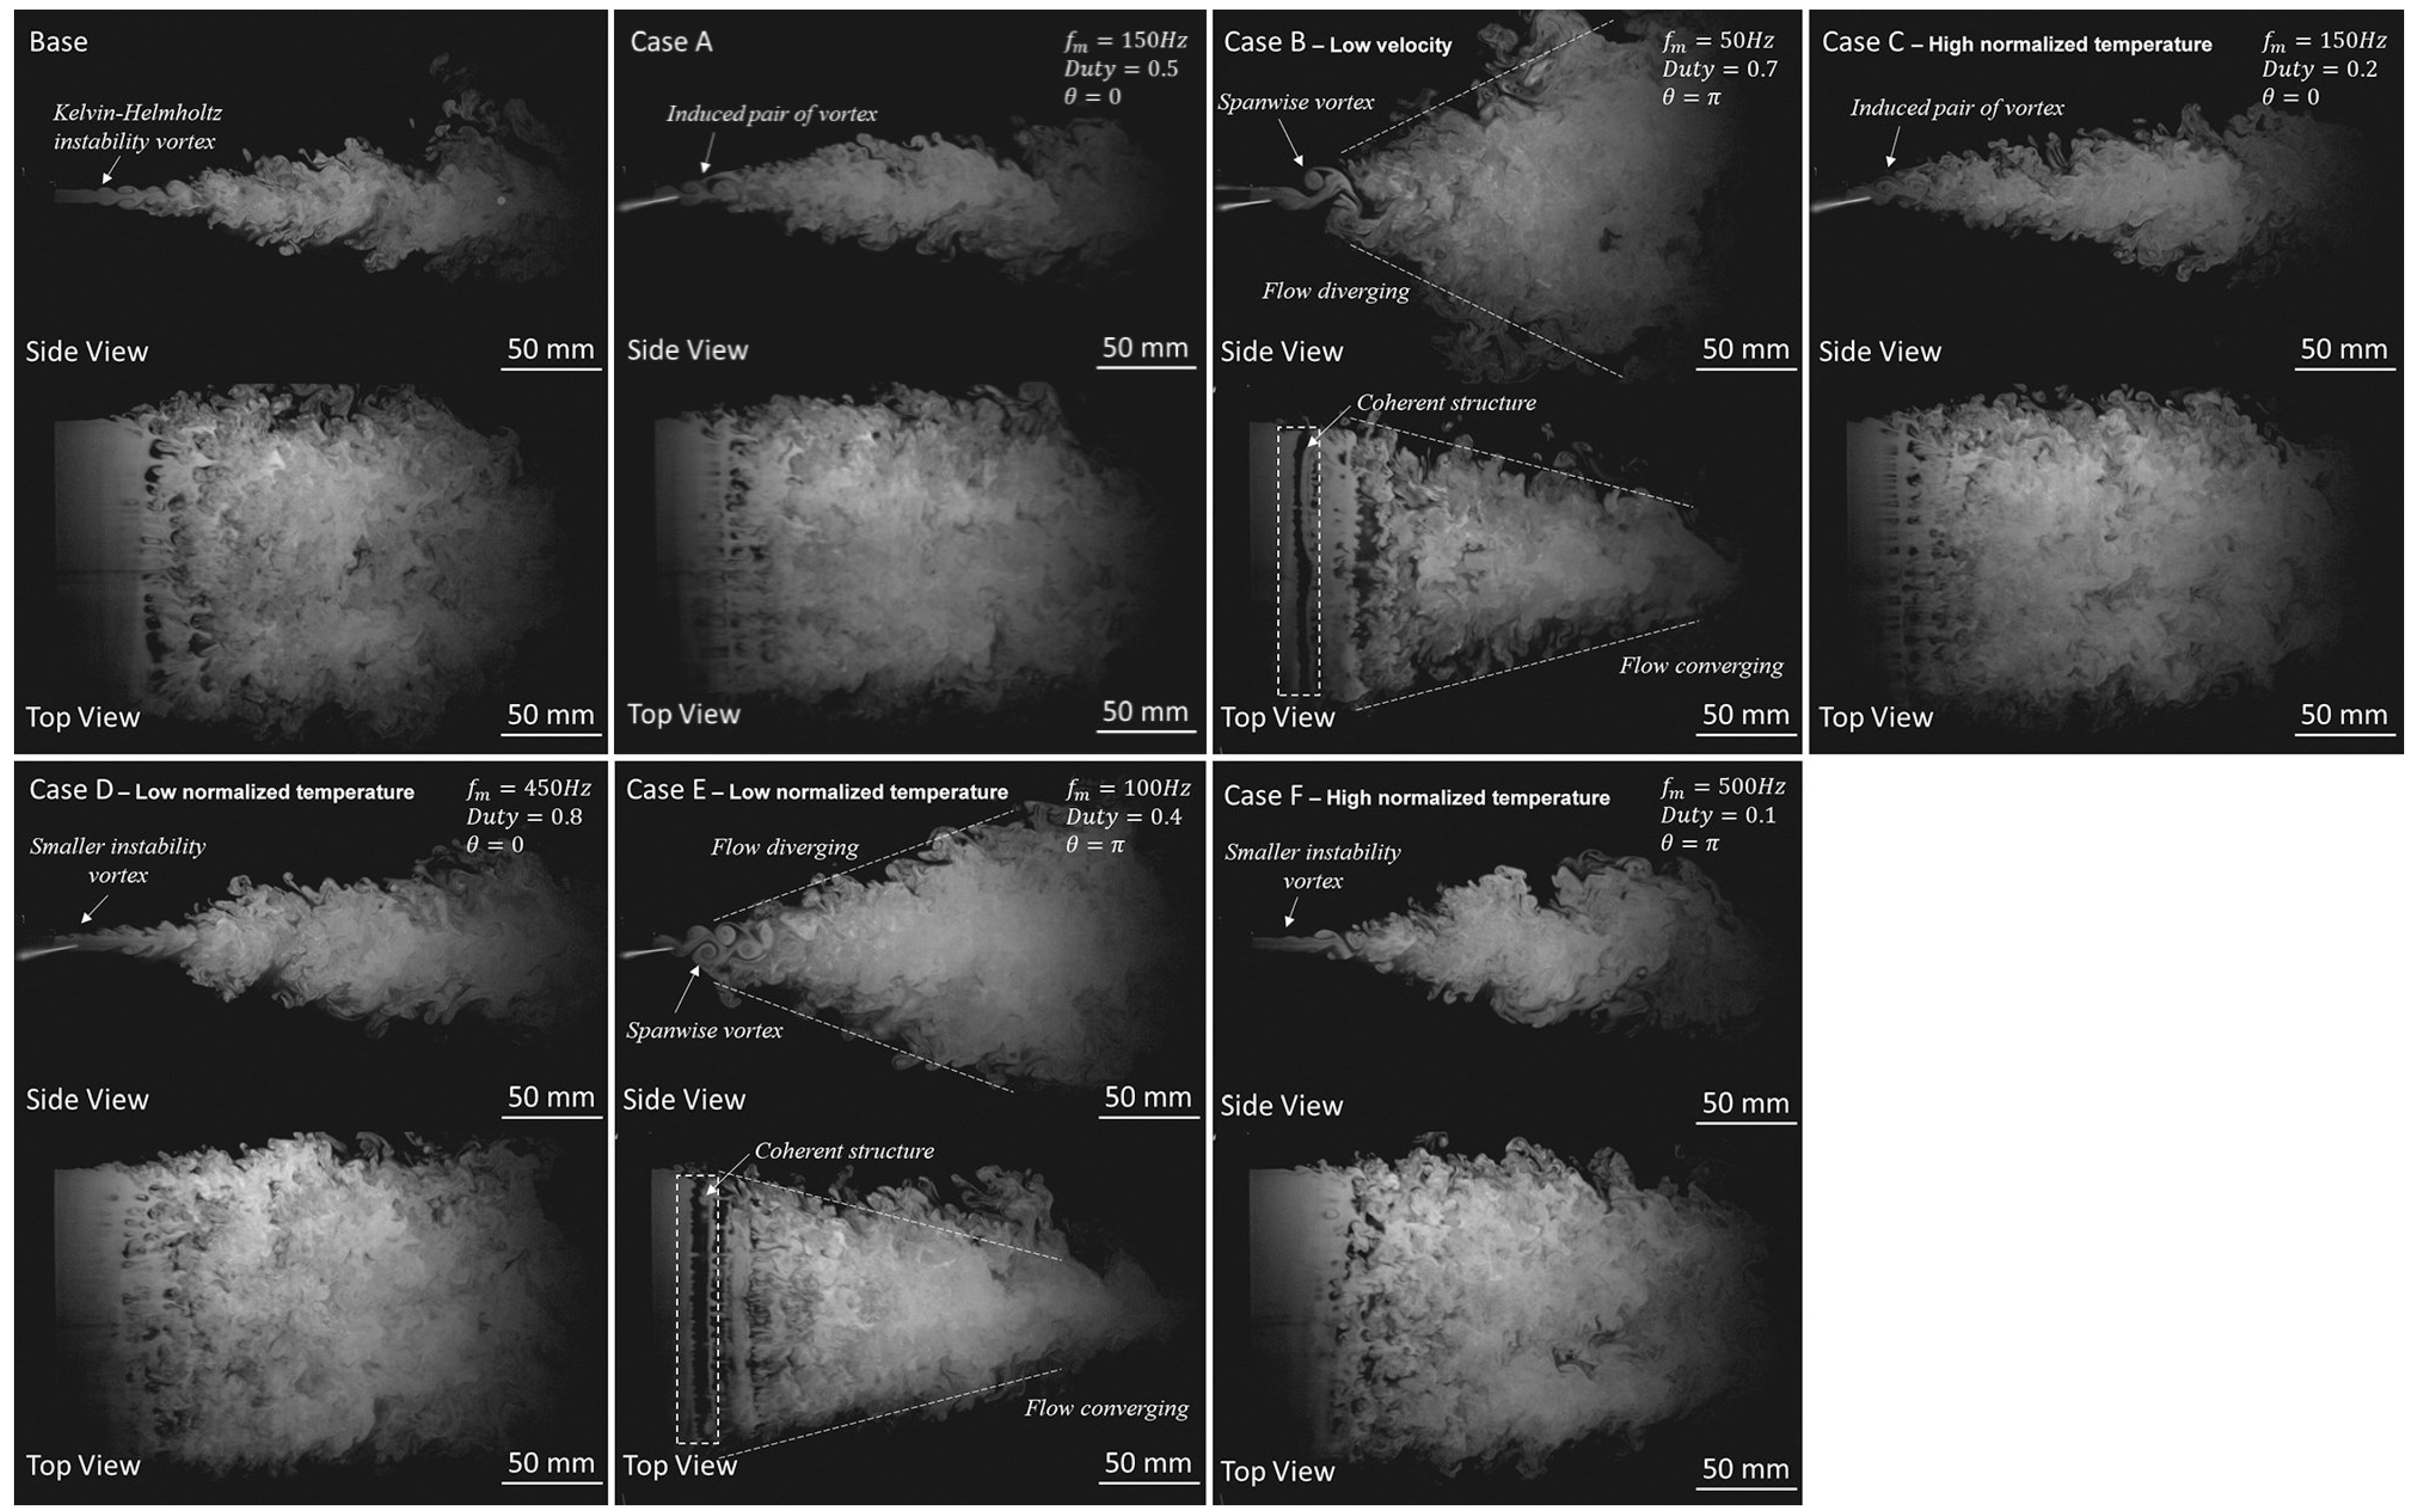
The visualization results of all cases are shown in Figure 7. The Kelvin–Helmholtz instability (KHI) vortex appears in the base case. This instability vortex occurs at the interface where two fluid streams with relative motion come into contact [29,30] because the rectangular jet flows into the still air. The KHI vortex grows until it breaks down into smaller structures at the end of the potential core where = 6 [2] as seen in the X–Z Top View in Figure 7. The KHI mechanism of the vortex roll-up and intense mixing between two fluids is comprehensively described by Caulfield and Peltier [31].
In Cases A and C—the higher-velocity and higher-normalized-temperature cases, respectively—two PAs operating simultaneously induce the flow with plasma wind creating pairs of vortexes, as observed in the X–Y Side View. From the Top View, we see that the flows slightly converge. The vortex-generating frequency can be obtained by counting the number of vortexes in the high-speed camera footage and dividing it by the recorded time. It is found that the vortex-generating frequencies in Cases A, B, C, and E are equal to the modular frequency induced by PAs. Furthermore, minor instability compared with the KHI vortexes was found in Cases D (low normalized temperature) and F (high normalized temperature) when the modular frequency was higher than that in other cases at 450 and 500 Hz, respectively. Therefore, PAs replace the KHI vortex generating frequency.
A train of vortexes is found in Cases B (lower velocity) and E (lower normalized temperature), as seen from the X–Y Side View in Figure 7. Moreover, the sizes of individual structures are different. The small vortical structures are random turbulent motions, whereas the spanwise structures appear as coherent structures. These vortex structures are detected by straight bars of smoke and void sequentially appearing in the visualized footage in the X–Z Top View. This phenomenon stemmed from the vectoring effect of PAs operated in alternating mode (i.e., phase difference equals ) combined with the periodic excitation effect when the modular frequency is applied. Furthermore, PAs make the jet width diverge in the X–Y Side View and converge in the X–Z Top View as the spanwise vortex shortens when traveling in the streamwise direction. This observation alludes to the existence of different structures representing various scales in rectangular jet flows controlled by PAs.
Figure 8 shows a schematic of the scaling in coherent structures [32] to explain the energy cascading concept that can be observed in Figure 7. Two physical phenomena occur simultaneously to assemble the flow features. The first process is the formation and growth of the coherent structures owing to the KHI appearing in the base case and self-organization resulting from the flow excitation of PAs in other cases. The second process is the energy cascade phenomenon, where the vortical structure size gradually decreases owing to the interaction between multi-scale structures. The well-known Kolmogorov length scale theory [33] indicates that the largest structure in the flow is the size of the coherent structure holding approximately 80% of the total kinetic energy [34], known as the integral length scale L. The smallest one includes the cascaded structures and random eddies, known as the dissipation scale l or Kolmogorov scale, which is responsible for turbulent energy dissipation. While the mean and random energies are transferred to the coherent energy by PAs, the coherent energy is transferred to random energy through the cascade. The random energy is then transferred to heat (molecular energy) through the energy dissipation process. There is evidence that excitation at a specific frequency corresponding to a scale can alter the energy cascade process. For example, direct excitation of the small scales within the dissipation range of free shear flow results in accelerated energy transfer from large to small scales, as described in the study by Wiltse et al. [35]. In the work of Chen et al. [36], the cascade at the lower excitation level has a periodic reaction, and the cascade at the higher excitation level produces chaotic reactions.
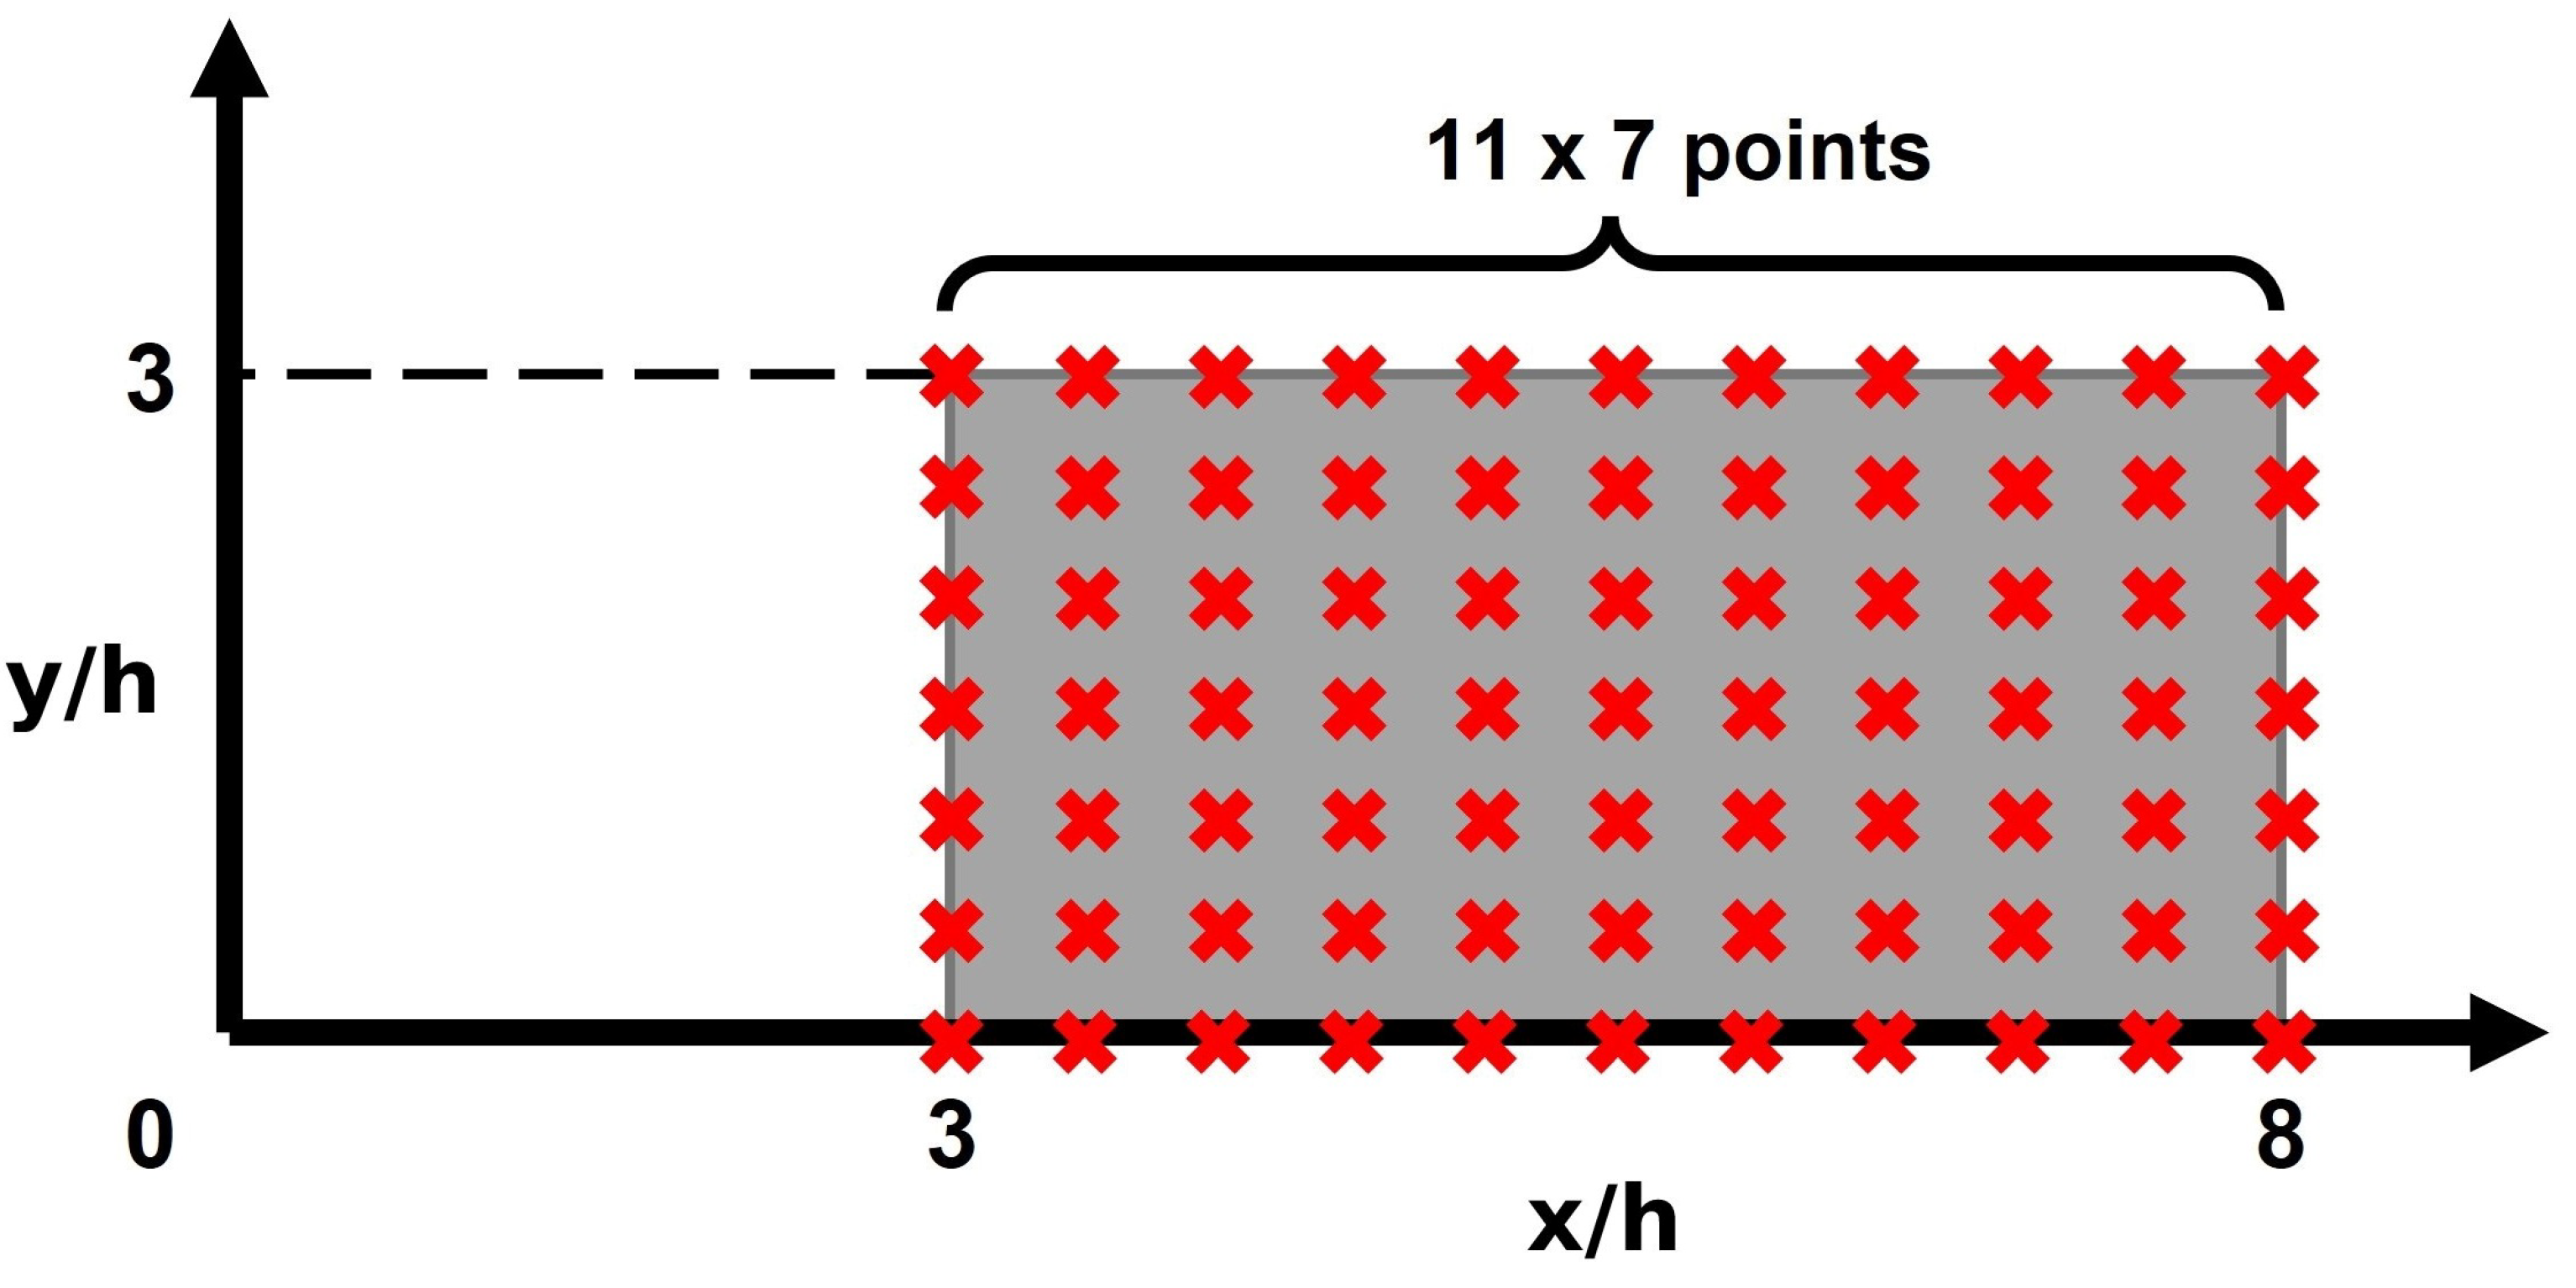
A grid containing 77 measuring points where the vortices appeared the most on the visualization results, as shown in Figure 9, was selected to capture the velocity and the integral and dissipation length scales for all experimental cases to measure the shear layer near the nozzle exit. The quantitative results of these measurements are shown in the contour plots in Figure 10. The setting and procedure for obtaining these results are described in Section 2.1, which refers to the work of El-Gabry et al. [24]. The larger the integral scale in the figures in the middle columns, the larger the coherent structures. The dissipation length scale in the right column figures is one order of magnitude smaller than the integral length scale. When PAs are operating, they increase the integral length scale at locations where there is none for the base case from = 3 to 6. PAs also decrease the dissipation length scale in all cases. Without any actuator, the integral length scale depends only on the size and geometry of the nozzle, and the dissipation scale depends on the dissipation rate and viscosity [37,38]. This result indicates that PAs can change these two length scales without changing the nozzle geometry. Furthermore, when the phase difference equals , the integral length scale shows larger structures in the flow compared with the others. The most significant coherent structures can be found in Case E, where the integral length scale reached the maximum value of 6 mm.
Figure 11 shows the integral length scales along the centerline. Except for the two cases with significant coherent structures (i.e., Cases B and E), other cases behaved similarly as the structures grew from the nozzle outlet to = 30, where they reached approximately 0.5h and then stabilized. In Cases B and E, the integral length scale reached the first peak (where = 10) and then decreased to the first minimum (where = 15). Subsequently, the scale reached its maximum and then decreased linearly. This represents the mechanisms of energy cascading for cases with larger structures that gradually cascade into smaller ones after covering some distance.
3.2. Mechanism of Rectangular Jet Divergence and Convergence by PAs
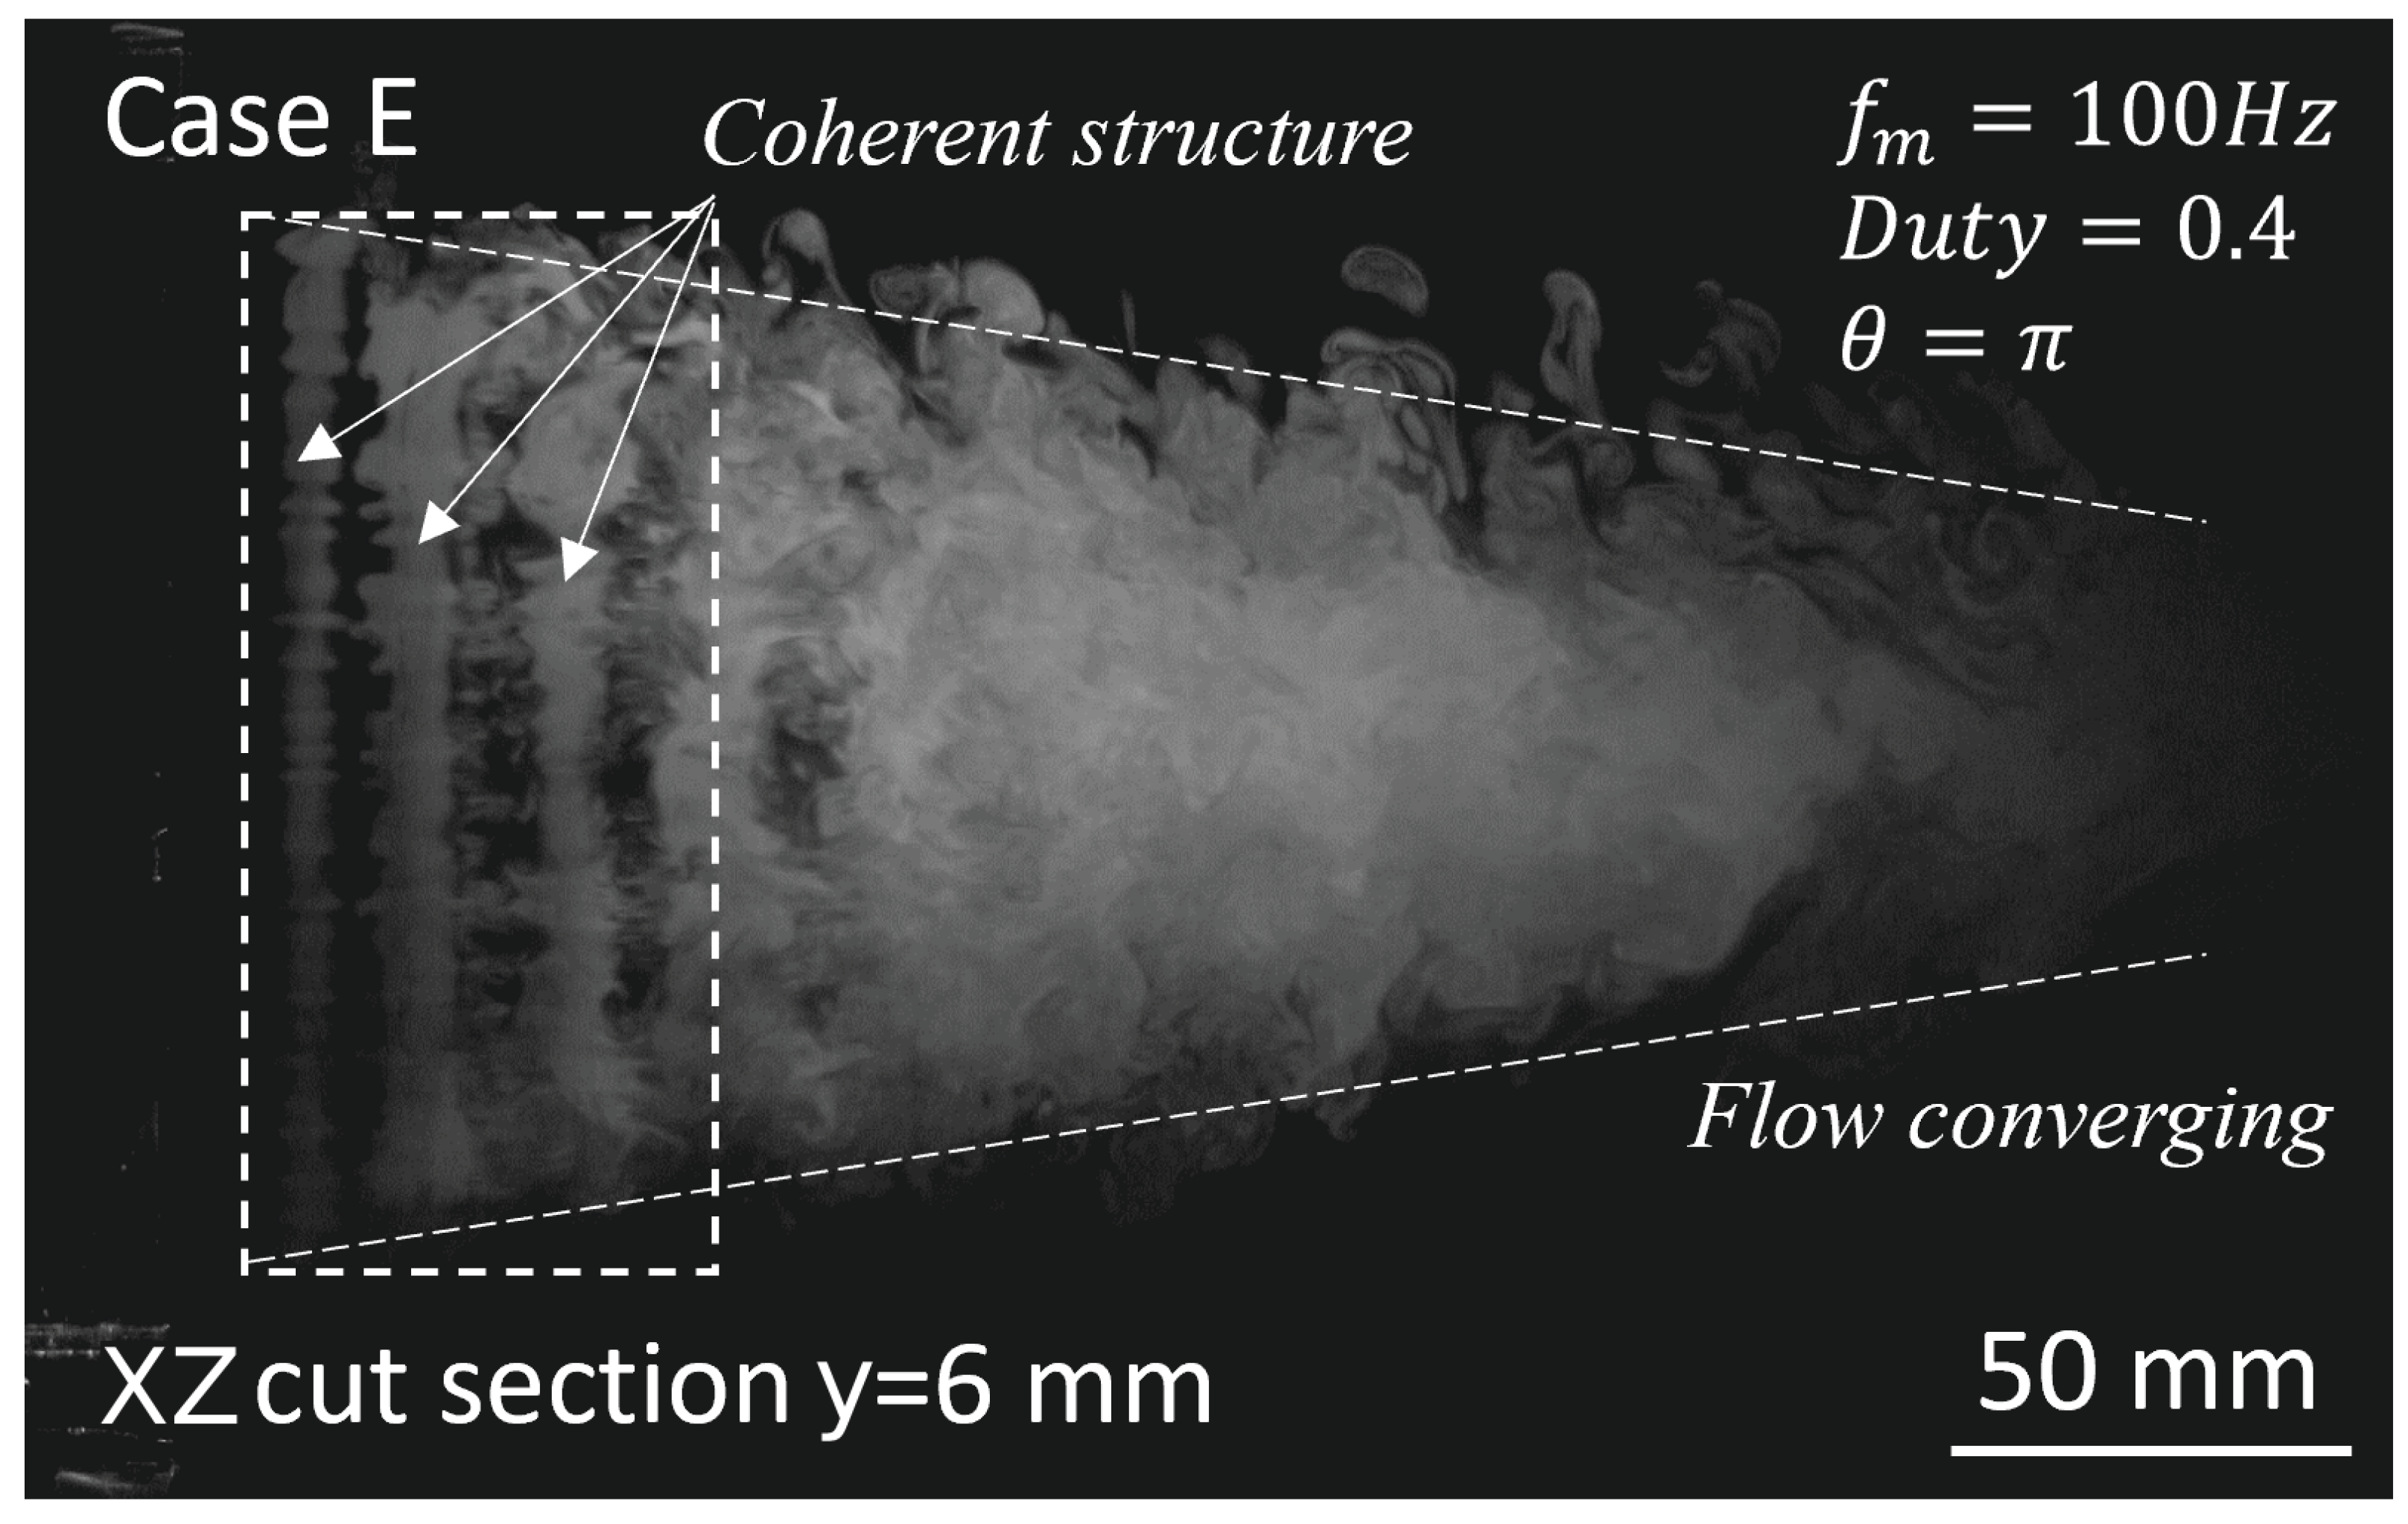
In Cases E and B, the jet width diverges on the X–Y Side View and converges on the X–Z Top View. Because Case E has the largest coherent structure, it was selected to examine the divergent and convergent mechanisms of the rectangular jet width. An observation plane parallel to the X–Z plane where y = 6 mm (Figure 7 for Case E) is shown in Figure 12. Because the observation plane cut through the spanwise vortex cores, it provided better clues than observation of the X–Z Top View of the coherent structures by multiple straight bars of smoke and void sequentially appearing in the observed footage. The initial coherent structure was equal to the length of the PA due to the linear forcing effect or similarity in the velocity profile along the length of the actuator. Moreover, the convergence of the flow can be observed on the observation plane.
Flow visualization videos were analyzed by 2D PIV software to extract the velocity and vorticity data. Since the analysis is only on the observed plane, there is a limitation compared with 3D PIV analysis because the measured velocity has only two-dimensional components on the observation plane. The settings and the PIV algorithm of choice are described in Section 2.1, which refers to [23]. Figure 13 shows the average velocity contour of Case E on the observation plane. The distribution shows the convergent jet width as it is concentrated into a small local area by the centerline from = 15 to 20 with a maximum velocity of 2 m/s. The velocity along the Z-direction as the W-velocity component is extracted from the mean velocity results and is shown in Figure 14. The W-velocity component is directed toward the centerline as the entrained air is drawn into the core of vortexes. This occurs because the train of spanwise vortexes creates a low-pressure zone when it travels streamwise; the same phenomena can be observed in vortex-shedding flow around a cylinder [39,40]. Additionally, the visualization video shows that the edge of the vortex breaks down into smaller structures, which shortens the spanwise vortex when it travels streamwise and finally results in a convergence effect of the flow from the X–Z Top View, as seen in Figure 7. The flow diverges in the X–Y Side View because of momentum conservation.
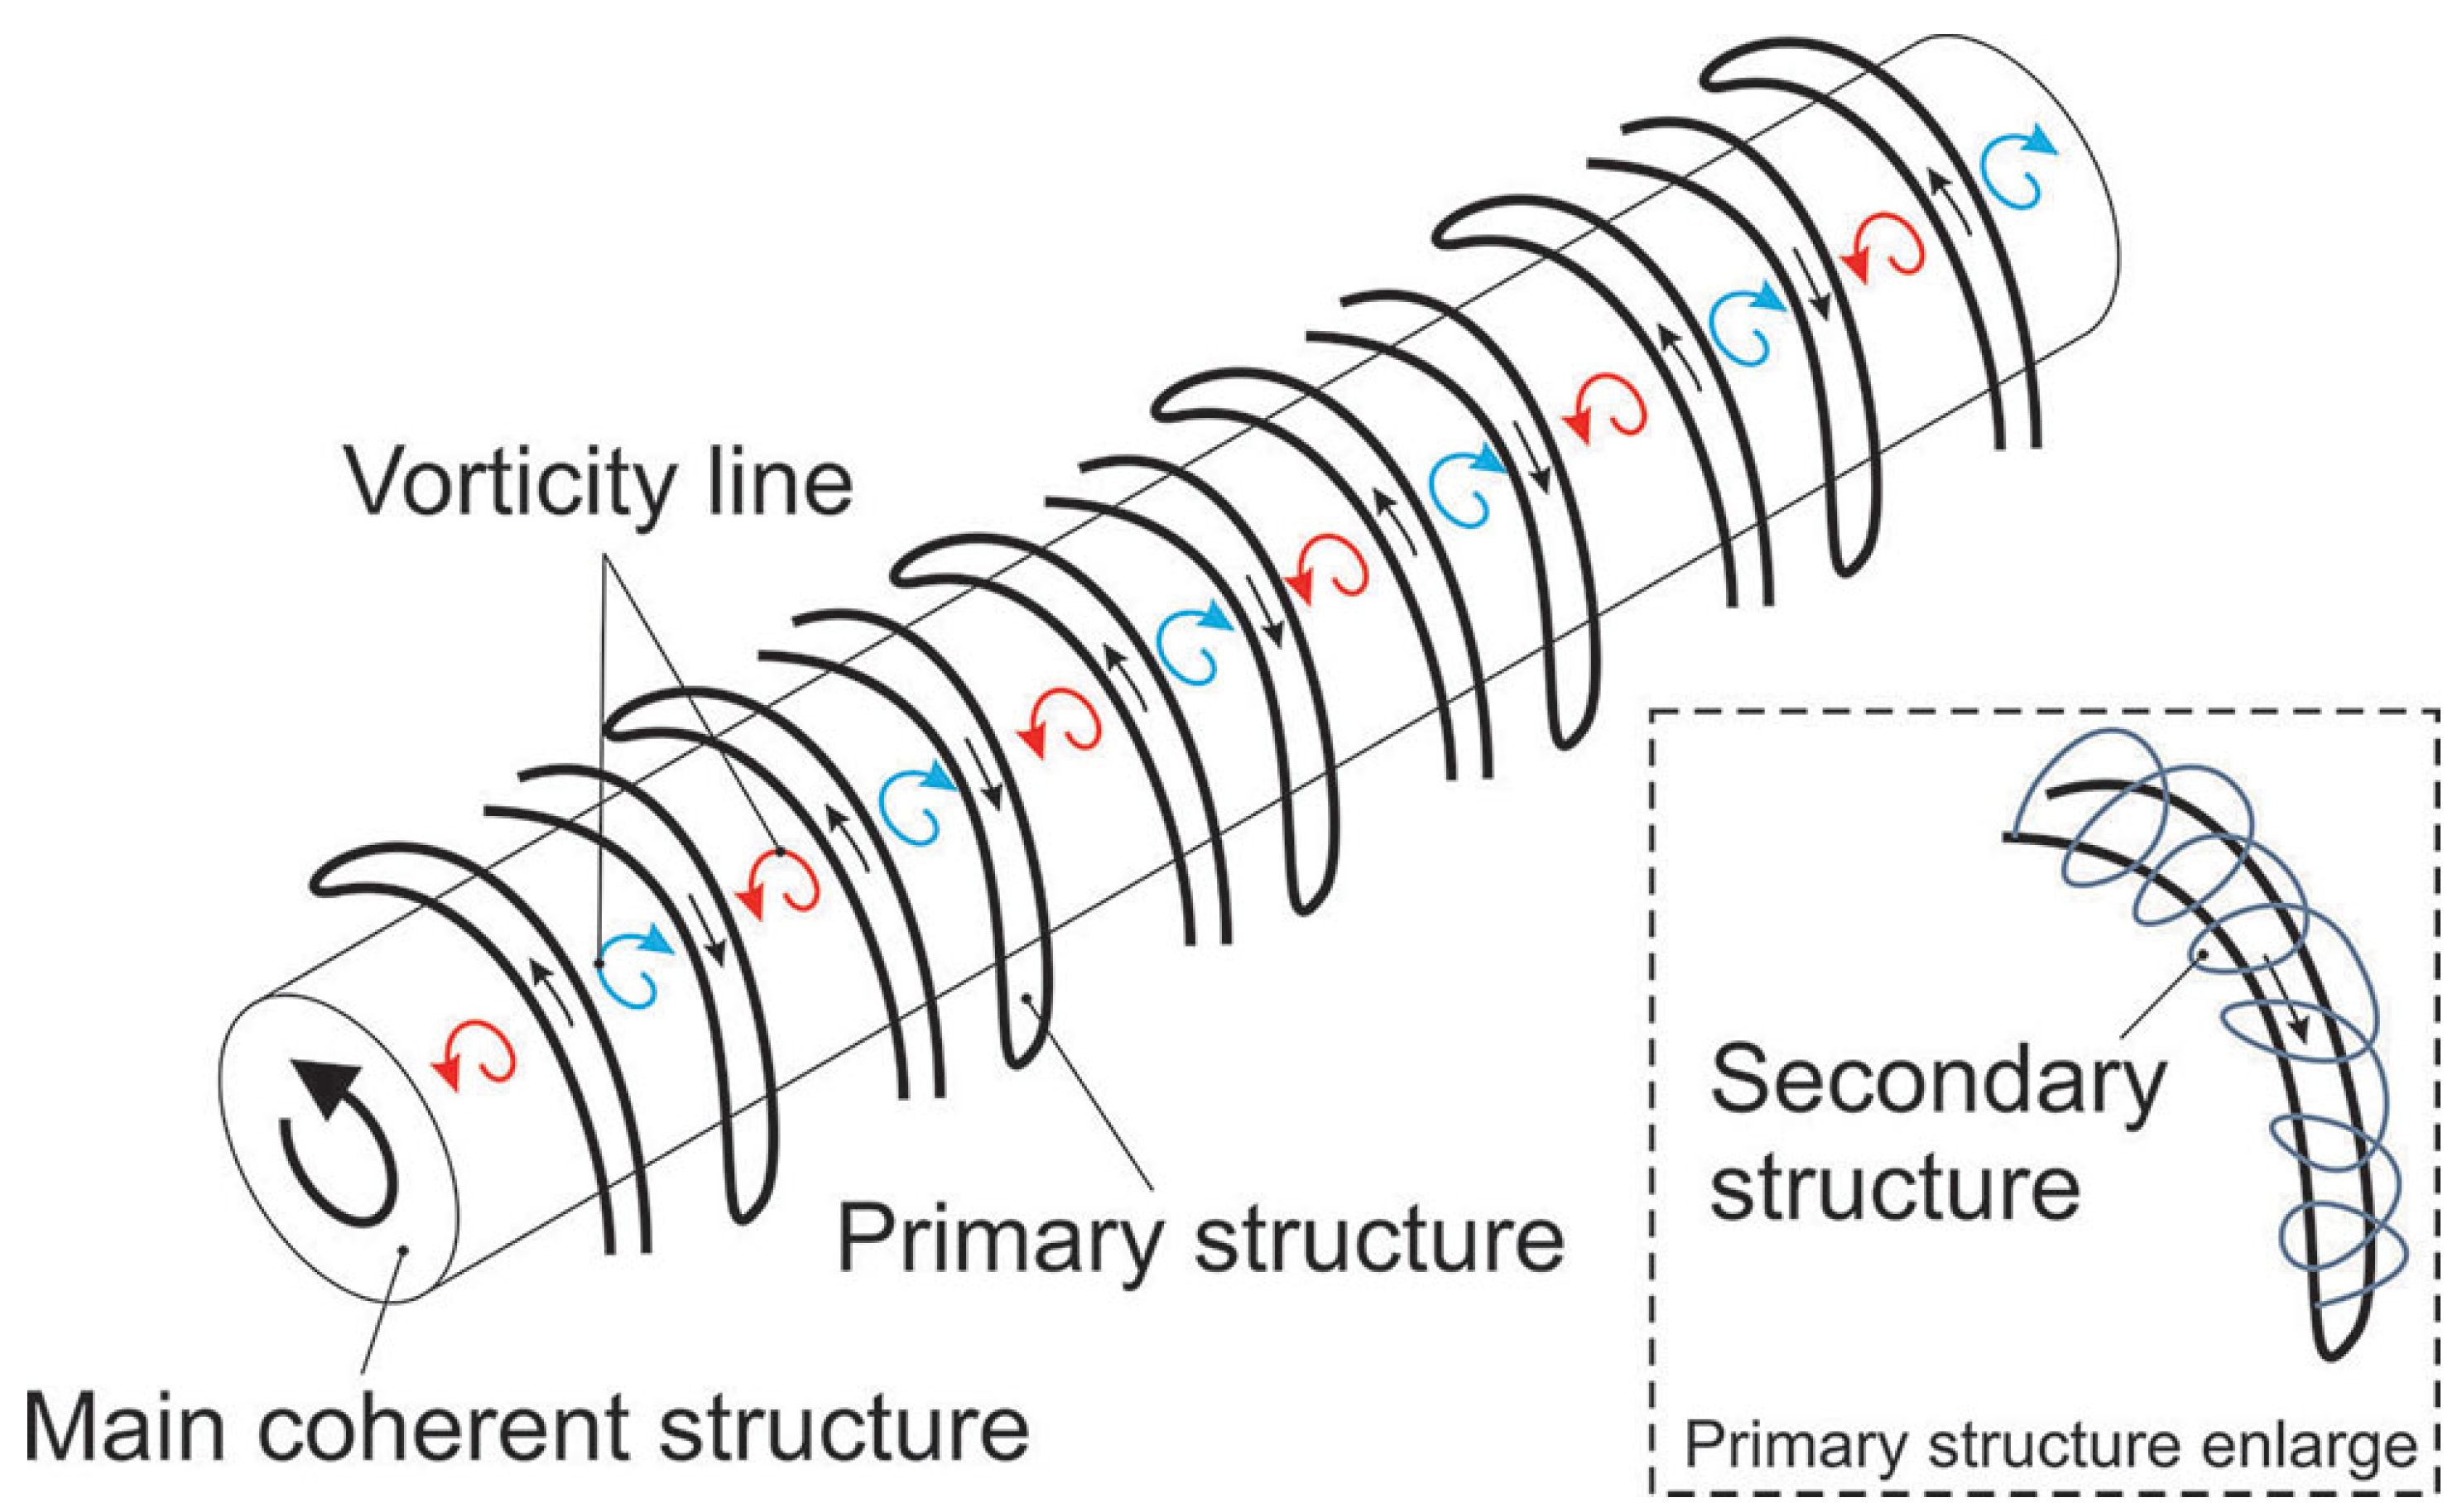
The vorticity distribution on the observation plane is shown in Figure 15. A positive value indicates that the rotation is in the counter-clockwise direction and vice versa. Vorticity values on the top and bottom shear layers have absolute values higher than the inner part of the flow, and their directions are toward the core of the flow. This interpretation is consistent with the W-velocity component results in Figure 14, where the entrainment is directed to the centerline of the flow. When = 5–14, areas with alternating vorticity signs can be observed, as indicated by the signs in Figure 15. The vorticity results reveal that the main turbulent structure interacts with random turbulence in the environment, creating primary and secondary structures as seen in Figure 16. Melander et al. [41] studied these structures by direct numerical simulation (DNS) to show the concept of a coherent structure constantly coupling with a group of smaller-scale vortices winding around it. The primary structures are usually larger and more prominent structures that emerge from interactions between the main coherent structures and the surrounding flow. Secondary structures are smaller-scale structures formed by the interactions of primary structures with the surrounding flow. The existence of these structures is proof of the turbulence cascade and hints at a highly dissipative structure. This proves that the train of spanwise vortexes created by the PA exists in a dissipative environment as the rectangular jet is emitted into the still air.
The vorticity equation is used to explain the mechanisms of jet convergence and divergence induced by the PAs. The equation describes the development and decay of any vortex system on all length scales. The derivation of Equation (4) was carried out by Holton et al. [42].
where:
- —relative vorticity caused by wind or flow control;
- f—planetary vorticity caused by rotation of the earth (for this application, the effect is neglected, as );
- —component of coordinate system;
- —velocity component according to the coordinate system;
- —mean density of the fluid.
Term I on the left side of Equation (4) is the rate of change of absolute vorticity following the fluid motion. Term II is called the ‘divergence term’ or ‘vortex stretching’. It represents the effects of divergence (compression) and convergence (stretching) on absolute vorticity. Terms III and IV are the transfer of vorticity between horizontal and vertical components and the effect of baroclinicity, respectively. In Term II, if or the horizontal flow is divergent, vorticity will be dissipated since vorticity decreases if absolute vorticity is positive and increases if absolute vorticity is negative. Figure 17 shows the vorticity distribution on the X–Y Side View of the flow. The peaks are found at = 7, after which the vorticity decreases. Figure 18 shows the vorticity on the X–Y Side View plane along z = 6 mm for a qualitative comparison. The vorticity sharply increases to achieve the peaks and then quickly decreases. Because the rectangular jet flow exists in a dissipative environment, the horizontal flow is divergent. This results in compression because the absolute vorticity decreases following the fluid motion.
where:
- l—length of the coherent structure.
Rossby [43,44] was the first to introduce the concept of potential vorticity (PV). The PV concept assumes that the fluid is homogeneous and that horizontal scales are much larger than the depth of the fluid. The simple form of the PV equation is expressed by Equation (5), where the ratio of represents PV. Since PV is conserved while the fluid is in motion, it has a clear physical meaning, as the absolute vorticity must be proportional to the length of the coherent structure. When the absolute vorticity decreases, as seen in Figure 17 and Figure 18, the length of the coherent structure also decreases. As a result, the flow converges in the X–Z Top View, and from the X–Y Side View, it diverges owing to the momentum conservation law. This continues until the vortex is fully broken down into smaller structures or turbulent flow. By understanding the mechanism, the spanwise vortex created by PAs can be utilized to introduce a coherent structure into the flow to control the jet width; depending on the orientation of the PA relative the rectangular jet (e.g., on the long edge or the short edge), converging or diverging effects can be achieved.
3.3. Energy Spectra Analysis of Rectangular Jet with PA
By using FFT, the velocity trace in the time domain can be converted into the frequency domain for further analysis. Figure 19 shows the single-sided amplitude and energy density spectra of all cases measured at the shear layer where = 3, = 0.5, and = 0. The X–hot-wire probe axis was positioned parallel with the flow to measure the U-velocity and V-velocity components. The power spectrum indicates the relative magnitudes of the frequency components of the physical phenomena that combine to make up the flow. For the base case, the dominant frequency caused by KHI was 392.6 Hz. The dominant frequencies in cases where PA could create coherent structures, i.e., Cases A, B, C, and E, were double the PA modular frequency applied to the case. The harmonic of the dominant frequency can also be observed in these cases. For example, in Case B, where the modular frequency is 50 Hz and the dominant frequency is 100 Hz, several harmonic frequencies are multiples of the modular frequency as 200, 300, 400 Hz, etc.
Case E was selected for further examination to understand this phenomenon. As seen in Figure 20, the U-velocity trace has a repetitive pattern indicating that the raw velocity signal is the sum product of sine waves. The schematic in Figure 21 illustrates the relationship between spanwise vortexes and the velocity signal wave captured by a hot-wire probe. With a steady vortex pattern, a fixed hot-wire probe can measure the fluctuating velocity signals to detect the vortex row as waves [32]. The wave frequency depends on the length scale or coherent sizes and background flow velocity at a lower frequency. Smaller vortices or a higher uniform velocity led to a higher frequency in the spectrum. I, II, III, and IV represent the positions of a vortex when it passes through the hot-wire probe; the matching results are shown on both the velocity trace in Figure 20 and in the schematic in Figure 21. Position II has the highest velocity because its position is closest to the core of the vortex. Observing the visualization video shows that the frequency of vortexes passing through the measured position equals the PA modular frequency . The modular frequency corresponds to , which is the modular time between two vortexes passing through the hot-wire probe or the time between II–II in the velocity trace. Furthermore, the dominant frequency was found to correspond with the dominant time period measured between I–III, which was half of . These results show that the frequency of vortexes passing through the hot-wire probe equals the PA modular frequency . The dominant frequency is twice the modular frequency because one vortex passing through the hot-wire probe makes two peaks at the U-velocity component.
The forcing frequency (or PA modular frequency) was the input to the flow; however, the response of the HAR rectangular jet to the given excitation was different. Based on this analysis, the dominant frequency in the spectrum can be directly calculated as double the PA modular frequency for cases where coherent structures exist in Cases A, B, C, and E. In contrast, the dominant frequency departed from the natural value at high-frequency excitation. The dominant frequency is also the shedding frequency used in calculating [20,45], as in Equation (6). The Strouhal number is the ratio of flow oscillations caused by the inertial forces to the changes in velocity caused by the convective acceleration in flows where a periodic motion dominates. It reveals quantitative characteristics of coherent structures within the flow [46]. Oscillations dominate the flow at a high number, and the oscillations are swept by the fast-moving fluid at low Strouhal numbers. The Strouhal number can be directly calculated from the modular frequency of PA for cases with the jet diverging and converging phenomena using Equation (7). The calculated results are shown in Table 3.
where:
- —Strouhal number;
- —vortex shedding frequency, also known as the dominant frequency during analysis of the energy density spectrum;
- —PA modular frequency applied to the rectangular jet flow;
- h—characteristic length, i.e., the rectangular nozzle height;
- —velocity of the initial flow.
Similar work on the classification of vortex patterns in oscillating flow by Strouhal number can be found in the work of Gungor et al. [47], and study of an acoustically excited plane jet at low Reynolds numbers can be found in the work of Marzouk et al. [48], which provides an overview of the various appearances and meanings of different numbers. Figure 22 shows some features of the HAR rectangular jet flow in Cases B and E. The number of vortex pairs grows with the Strouhal number before the breakdown of coherent structures at the end of the potential core. Case B has just one vortex pair, with a Strouhal number of 0.168. However, two vortex pairs exist in Case E, with a Strouhal number of 0.334, and the flow is less diverging in the Side View compared with Case B. Additionally, formation of vortex structures on a large scale is observed and measured (see Figure 10) and proves to be larger when the Strouhal number < 0.4. This is consistent with Marzouk’s experimental findings, as cited in [48]. As a result, the flow condition featuring diverging and converging of a HAR rectangular jet controlled by PAs can be predicted by calculating the Strouhal number with a given excitation condition as the PA modular frequency and with phase difference equal to .
4. Conclusions
PA can introduce coherent structures to HAR rectangular jet flows. The combination of the periodic excitation and vectoring effects stem from the modular frequency and phase difference, respectively, which transfers the mean energy of the flow to complex organized structures called spanwise vortexes as large as 6 mm in the established experiment conditions at a flow speed of 4.5 m/s. Simultaneously, during the formation of the coherent structures, the energy cascading process gradually decreases the vortical structures owing to the interaction between multi-scale turbulence structures.
These spanwise vortexes create low-pressure zones when they travel streamwise; these low-pressure zones create suction, drawing low-energy air into the core of the vortexes. When the rectangular jet flow is released into still air, the flow enters a highly dissipative environment. This environment dissipates the vorticity of the coherent structures, making them decrease rapidly after fully forming spanwise vortexes. Compression of the coherent structures then occurs since the absolute vorticity must be proportional to the length of the coherent structure. As a result, the length of the spanwise vortex shortens when it travels streamwise, resulting in a convergence effect in the X–Z Top View and a divergence effect in the X–Y Side View for a HAR rectangular jet with an aspect ratio of 20 (150 × 7.5 mm).
Energy spectra analysis showed that PAs can overwrite the KHI natural frequency at 392.6 Hz, with the lower dominant frequency equaling double the modular frequency for cases where coherent structures are created. Moreover, driving the flow at the natural frequencies has no noticeable effect in the flow features. The flow features and quantitative characteristics of the rectangular jet flow controlled by PAs can be predicted by calculating the Strouhal number using the modular frequency and the phase difference applied to PA to control the flow. For example, Case E had two vortex pairs at = 0.334, which was less diverging in the Side View compared with Case B, which had only one vortex pair at = 0.168.
As an active flow-controlling technique, PAs can create flow features without introducing new hardware into the flow. Plasma actuators are a powerful tool for prototyping and crafting turbulent characteristics within the flow field of a rectangular jet. Understanding how PAs affect the HAR rectangular jet will help recreate flow features in future work with other active flow control techniques and actuators for automobile air conditioning systems and various engineering applications. Additionally, a numerical study of a high-aspect-ratio rectangular jet controlled by plasma actuators can be considered as future work to have a better understanding of the phenomena occurring within the jet. This simulation will also be a valuable tool for studying the effects of PAs and other types of AFC actuators to create turbulence structures without needing costly and time-consuming experiments.
Author Contributions
The authors confirm contribution to the paper as follows: study conception and design: A.V.P. and K.I.; data collection: A.V.P.; analysis and interpretation of results: A.V.P. and K.I.; draft manuscript preparation: A.V.P.; review and editing of manuscript, K.I. All authors have read and agreed to the final version of the manuscript.
Funding
This research received no external funding.
Data Availability Statement
Not applicable.
Acknowledgments
We want to express our very great appreciation to Miyuki Saito at DENSO Corporation for her valuable and constructive suggestions during the planning and development of this research work. This paper and its research would not have been possible without the exceptional support of Toshinori Ochiai and Masaharu Sakai, technical experts at DENSO Corporation. They provided insights and expertise that greatly assisted the research.
Conflicts of Interest
The authors declare no conflict of interest.
Abbreviations
The following abbreviations are used in this manuscript:
| A/C | Air Conditioning |
| AFC | Active Flow Control |
| PA | Plasma Actuator |
| DBD | Dielectric Barrier Discharge |
| HAR | High-Aspect-Ratio |
References
- Castiglioni, G.; Russo, R.N.; Mardall, J.; Mancini, N. Thermal System with High Aspect Ratio Vent. U.S. Patent 10,464,397, 5 November 2019. [Google Scholar]
- Rajaratnam, N. Turbulent Jets; Elsevier: Amsterdam, The Netherlands, 1976; Chapter 13; p. 267. [Google Scholar]
- Shakouchi, T. Jet Flow Engineering-Fundamentals and Application; Morikita-Shuppan Co.: Tokyo, Japan, 2004. (In Japanese) [Google Scholar]
- Yang, X.; Long, X.; Yao, X. Numerical investigation on the mixing process in a steam ejector with different nozzle structures. Int. J. Therm. Sci. 2012, 56, 95–106. [Google Scholar] [CrossRef]
- Deo, R.C.; Mi, J.; Nathan, G.J. The influence of nozzle-exit geometric profile on statistical properties of a turbulent plane jet. Exp. Therm. Fluid Sci. 2007, 32, 545–559. [Google Scholar] [CrossRef]
- Batchelor, G. Fluid Mechanics. J. Fluid Mech. 1989, 205, 593–594. [Google Scholar] [CrossRef]
- Luo, M.; Wang, Z.; Zhang, H.; Arens, E.; Filingeri, D.; Jin, L.; Ghahramani, A.; Chen, W.; He, Y.; Si, B. High-density thermal sensitivity maps of the human body. Build. Environ. 2020, 167, 106435. [Google Scholar] [CrossRef]
- Corke, T.C.; Enloe, C.L.; Wilkinson, S.P. Dielectric barrier discharge plasma actuators for flow control. Annu. Rev. Fluid Mech. 2010, 42, 505–529. [Google Scholar] [CrossRef]
- Kriegseis, J.; Simon, B.; Grundmann, S. Towards in-flight applications? A review on dielectric barrier discharge-based boundary-layer control. Appl. Mech. Rev. 2016, 68, 020802. [Google Scholar] [CrossRef]
- Moreau, E. Airflow control by non-thermal plasma actuators. J. Phys. Appl. Phys. 2007, 40, 605. [Google Scholar] [CrossRef]
- Benard, N.; Moreau, E. Electrical and mechanical characteristics of surface AC dielectric barrier discharge plasma actuators applied to airflow control. Exp. Fluids 2014, 55, 1846. [Google Scholar] [CrossRef] [Green Version]
- Kotsonis, M. Diagnostics for characterisation of plasma actuators. Meas. Sci. Technol. 2015, 26, 092001. [Google Scholar] [CrossRef]
- Pham, A.V.; Inaba, K.; Saito, M.; Sakai, M. Effect of Plasma Actuator on Velocity and Temperature Profiles of High Aspect Ratio Rectangular Jet. Fluids 2022, 7, 281. [Google Scholar] [CrossRef]
- Jakob, H.; Kim, M.K. Feasibility Study on the Use of Non-Thermal Plasma for a Cold Radio Blackout Experiment. In Proceedings of the AIAA Scitech 2020 Forum, Orlando, FL, USA, 6–10 January 2020; p. 2150. [Google Scholar] [CrossRef]
- Jukes, T.N.; Choi, K.S.; Johnson, G.A.; Scott, S.J. Characterization of surface plasma-induced wall flows through velocity and temperature measurements. AIAA J. 2006, 44, 764–771. [Google Scholar] [CrossRef]
- Benard, N.; Bonnet, J.P.; Touchard, G.; Moreau, E. Flow Control by Dielectric Barrier Discharge Actuators: Jet Mixing Enhancement. AIAA J. 2008, 46, 2293–2305. [Google Scholar] [CrossRef]
- Corke, T.; Matlis, E. Phased plasma arrays for unsteady flow control. In Proceedings of the Fluids 2000 Conference and Exhibit, Graz, Austria, 24–29 September 2000; p. 2323. [Google Scholar] [CrossRef]
- Parekh, D.; Kibens, V.; Glezer, A.; Wiltse, J.; Smith, D. Innovative jet flow control-mixing enhancement experiments. In Proceedings of the 34th Aerospace Sciences Meeting and Exhibit, Reno, NV, USA, 15–18 January 1996; p. 308. [Google Scholar] [CrossRef]
- Strykowski, P.; Wilcoxon, R. Mixing enhancement due to global oscillations in jets with annular counterflow. AIAA J. 1993, 31, 564–570. [Google Scholar] [CrossRef]
- Ginevsky, A.; Vlasov, Y.V.; Vlasov, E.V.; Karavosov, R. Acoustic Control of Turbulent Jets; Springer Science & Business Media: Berlin, Germany, 2004; p. 4. [Google Scholar]
- Suzuki, H.; Kasagi, N.; Suzuki, Y. Active control of an axisymmetric jet with distributed electromagnetic flap actuators. Exp. Fluids 2004, 36, 498–509. [Google Scholar] [CrossRef]
- Kozato, Y.; Kikuchi, S.; Imao, S.; Kato, Y.; Okayama, K. Flow control of a rectangular jet by DBD plasma actuators. Int. J. Heat Fluid Flow 2016, 62, 33–43. [Google Scholar] [CrossRef]
- Thielicke, W.; Sonntag, R. Particle Image Velocimetry for MATLAB: Accuracy and enhanced algorithms in PIVlab. J. Open Res. Softw. 2021, 9. [Google Scholar] [CrossRef]
- El-Gabry, L.A.; Thurman, D.R.; Poinsatte, P.E. Procedure for Determining Turbulence Length Scales Using Hotwire Anemometry; Technical Report; National Aeronautics and Space Administration: Hampton, VA, USA, 2014. [Google Scholar]
- Roach, P. The generation of nearly isotropic turbulence by means of grids. Int. J. Heat Fluid Flow 1987, 8, 82–92. [Google Scholar] [CrossRef]
- Tesař, V. Axisymmetric nozzles with chamfered contraction. Sens. Actuators A Phys. 2017, 263, 147–158. [Google Scholar] [CrossRef]
- Fukagata, K.; Yamada, S.; Ishikawa, H. Plasma actuators: Fundamentals and research trends. J. Jpn. Soc. Fluid Mech. 2010, 29, 243–250. [Google Scholar]
- List, E. Turbulent jets and plumes. Annu. Rev. Fluid Mech. 1982, 14, 189–212. [Google Scholar] [CrossRef]
- Von Helmholtz, H. Über Discontinuirliche Flüssigkeits-Bewegungen; Akademie der Wissenschaften zu Berlin: Berlin, Germany, 1868. [Google Scholar]
- Thompson, W.S. Hydrokinetic solutions and observations. Phil. Mag. 1871, 1, 374. [Google Scholar] [CrossRef]
- Caulfield, C.; Peltier, W. The anatomy of the mixing transition in homogeneous and stratified free shear layers. J. Fluid Mech. 2000, 413, 1–47. [Google Scholar] [CrossRef]
- Wu, J.Z.; Ma, H.Y.; Zhou, M.D. Vorticity and Vortex Dynamics; Springer Science & Business Media: New York, NY, USA, 2007. [Google Scholar]
- Kolmogorov, A.N. The local structure of turbulence in incompressible viscous fluid for very large Reynolds numbers. Proc. R. Soc. Lond. Ser. A Math. Phys. Sci. 1991, 434, 9–13. [Google Scholar] [CrossRef]
- Pope, S.B.; Pope, S.B. Turbulent Flows; Cambridge University Press: Cambridge, UK, 2000; p. 242. [Google Scholar]
- Wiltse, J.M.; Glezer, A. Direct excitation of small-scale motions in free shear flows. Phys. Fluids 1998, 10, 2026–2036. [Google Scholar] [CrossRef]
- Chen, J.E.; Theurich, T.; Krack, M.; Sapsis, T.; Bergman, L.A.; Vakakis, A.F. Intense cross-scale energy cascades resembling “mechanical turbulence” in harmonically driven strongly nonlinear hierarchical chains of oscillators. Acta Mech. 2022, 233, 1289–1305. [Google Scholar] [CrossRef]
- Hinze, J. Isotropic turbulence. In Turbulence, 2nd ed.; McGraw-Hill: New York, NY, USA, 1975; p. 790. [Google Scholar]
- Tennekes, H.; Lumley, J.L. A First Course in Turbulence; MIT Press: Cambridge, MA, USA, 1972; p. 300. [Google Scholar]
- Palkin, E.; Hadžiabdić, M.; Mullyadzhanov, R.; Hanjalić, K. Control of flow around a cylinder by rotary oscillations at a high subcritical Reynolds number. J. Fluid Mech. 2018, 855, 236–266. [Google Scholar] [CrossRef]
- Mao, X.; Wang, B. Spanwise localized control for drag reduction in flow passing a cylinder. J. Fluid Mech. 2021, 915, A112. [Google Scholar] [CrossRef]
- Melander, M.V.; Hussain, F. Coupling between a coherent structure and fine-scale turbulence. Phys. Rev. 1993, 48, 2669. [Google Scholar] [CrossRef]
- Holton, J.R.; Hakim, G.J. An Introduction to Dynamic Meteorology, 5th ed.; Academic Press: Boston, MA, USA, 2013; p. 100. [Google Scholar] [CrossRef]
- Rossby, C.G. Dynamics of Steady Ocean Currents in the Light of Experimental Fluid Mechanics; Massachusetts Institute of Technology and Woods Hole Oceanographic Institution: Cambridge, MA, USA, 1936. [Google Scholar]
- Rossby, C.G. Planetary flow pattern in the atmosphere. Quart. J. Roy. Meteor. Soc. 1940, 66, 68–87. [Google Scholar]
- Sakamoto, H.; Haniu, H. A Study on Vortex Shedding From Spheres in a Uniform Flow. J. Fluids Eng. 1990, 112, 386–392. [Google Scholar] [CrossRef]
- Katopodes, N.D. Free-Surface Flow: Environmental Fluid Mechanics; Butterworth-Heinemann: Oxford, UK, 2018; p. 384. [Google Scholar]
- Gungor, A.; Khalid, M.S.U.; Hemmati, A. Classification of vortex patterns of oscillating foils in side-by-side configurations. J. Fluid Mech. 2022, 951, A37. [Google Scholar] [CrossRef]
- Marzouk, S.; Hnaien, N. Experimental study of an acoustically excited plane jet at low Reynolds numbers. J. Appl. Fluid Mech. 2019, 12, 527–537. [Google Scholar] [CrossRef]
Figure 1.
Coordination setup and visualized planes by PIV laser sheet.

Figure 2.
Contraction and rectangular nozzle structure.

Figure 3.
Plasma actuator dimensions, components, and driving signal.

Figure 4.
Plasma actuators on Part (a) and (b) (left side) and the full installation of a HAR rectangular jet nozzle assembly (right side).
Figure 4.
Plasma actuators on Part (a) and (b) (left side) and the full installation of a HAR rectangular jet nozzle assembly (right side).

Figure 5.
Schematic of two plasma actuator directions versus the main flow of HAR rectangular jet.

Figure 6.
Pressure distributions and losses by plasma actuators.

Figure 7.
Spontaneous flow visualization results for different cases in X–Y Side View and X–Z Top View recorded at 2000 fps.
Figure 7.
Spontaneous flow visualization results for different cases in X–Y Side View and X–Z Top View recorded at 2000 fps.

Figure 8.
Scaling in coherent structures.

Figure 9.
Velocity, integral length scale, and dissipation length scale measurement locations.

Figure 10.
U-component velocity, integral length scale, and dissipation scale measurement results for test cases.
Figure 10.
U-component velocity, integral length scale, and dissipation scale measurement results for test cases.

Figure 11.
Integral length scale along the centerline.

Figure 12.
Spontaneous flow visualization result of Case E in X−Y cut section while z = 6 mm recorded at 2000 fps.
Figure 12.
Spontaneous flow visualization result of Case E in X−Y cut section while z = 6 mm recorded at 2000 fps.

Figure 13.
Case E PIV average velocity contour plot in X–Z parallel plane y = 6 mm.

Figure 14.
Case E PIV average W-component velocity contour plot in X–Z parallel plane y = 6 mm.

Figure 15.
Case E vorticity contour plot in the X–Z Top View at y = 6 mm.

Figure 16.
Schematic of a coherent structure interacting with random turbulence to create primary and secondary structures.
Figure 16.
Schematic of a coherent structure interacting with random turbulence to create primary and secondary structures.

Figure 17.
Case E vorticity contour plot in the X–Y Side View.

Figure 18.
Vorticity distribution along y = 0 and z = 6 mm.

Figure 19.
Single-sided amplitude and energy density spectra of all cases at = 3, = 0.5, and = 0.


Figure 20.
U-velocity trace of Case E measured by hot-wire X-wire probe at 50-kHz sampling rate.

Figure 21.
Relationship between spanwise vortexes and velocity signal wave captured by hot-wire probe.
Figure 21.
Relationship between spanwise vortexes and velocity signal wave captured by hot-wire probe.

Figure 22.
Case B and Case E visualizations. Numbers 1 and 2 indicate the number of vortex pairs.


Table 1.
Details of experimental conditions.
| Symbol | Description | Value | Unit |
|---|---|---|---|
| B | Nozzle width | 150 | mm |
| h | Nozzle height | 7.5 | mm |
| Rectangular jet initial velocity | 4.5 | m/s | |
| Peak-to-peak voltage of PA controlling signal | 6 | kV | |
| Base frequency of PA controlling signal | 15 | kHz |
Table 2.
Denoted cases regarding modular frequency , duty cycle D, and phase difference .
| No. | Case Name | Description | (Hz) | D | 1 | 2 | |
|---|---|---|---|---|---|---|---|
| 1 | Base | Base case | - | - | - | - | - |
| 2 | Case A | High Velocity | 150 | 0.5 | 0 | 15.47% | - |
| 3 | Case B | Low Velocity | 50 | 0.7 | −44.98% | - | |
| 4 | Case C | High Normalized Temp. | 150 | 0.2 | 0 | - | 13.68% |
| 5 | Case D | Low Normalized Temp. | 450 | 0.8 | 0 | - | −14.91% |
| 6 | Case E | Low Normalized Temp. | 100 | 0.4 | - | −17.38% | |
| 7 | Case F | High Normalized Temp. | 500 | 0.1 | - | 10.44% |
1 —Velocity increment compared with base case in % at = 70; 2 —Normalized temperature increment compared with base case in % at = 70.
Table 3.
Strouhal number calculation results based on spectrum analysis.
| (Hz) | D | (Hz) | |||
|---|---|---|---|---|---|
| Case A | 150 | 0.5 | 0 | 300.67 | 0.501 |
| Case B | 50 | 0.7 | 100.67 | 0.168 | |
| Case C | 150 | 0.2 | 0 | 300 | 0.500 |
| Case D | 450 | 0.8 | 0 | 154.67 | 0.258 |
| Case E | 100 | 0.4 | 200.67 | 0.334 | |
| Case F | 500 | 0.1 | 373.33 | 0.622 |
Disclaimer/Publisher’s Note: The statements, opinions and data contained in all publications are solely those of the individual author(s) and contributor(s) and not of MDPI and/or the editor(s). MDPI and/or the editor(s) disclaim responsibility for any injury to people or property resulting from any ideas, methods, instructions or products referred to in the content. |
© 2023 by the authors. Licensee MDPI, Basel, Switzerland. This article is an open access article distributed under the terms and conditions of the Creative Commons Attribution (CC BY) license (https://creativecommons.org/licenses/by/4.0/).
Share and Cite
MDPI and ACS Style
Pham, A.V.; Inaba, K. Mechanisms of Plasma Actuators Controlling High-Aspect-Ratio Rectangular Jet Width for Automobile Air Conditioning Systems. Fluids 2023, 8, 186. https://doi.org/10.3390/fluids8070186
AMA Style
Pham AV, Inaba K. Mechanisms of Plasma Actuators Controlling High-Aspect-Ratio Rectangular Jet Width for Automobile Air Conditioning Systems. Fluids. 2023; 8(7):186. https://doi.org/10.3390/fluids8070186
Chicago/Turabian StylePham, Anh Viet, and Kazuaki Inaba. 2023. "Mechanisms of Plasma Actuators Controlling High-Aspect-Ratio Rectangular Jet Width for Automobile Air Conditioning Systems" Fluids 8, no. 7: 186. https://doi.org/10.3390/fluids8070186