STANLIB Funds Limited â 2012 Audited Annual Report
STANLIB Funds Limited â 2012 Audited Annual Report
STANLIB Funds Limited â 2012 Audited Annual Report

You also want an ePaper? Increase the reach of your titles
YUMPU automatically turns print PDFs into web optimized ePapers that Google loves.
<strong>STANLIB</strong> <strong>Funds</strong> <strong>Limited</strong>Statement of Manager’s ResponsibilitiesThe Company Directors require <strong>STANLIB</strong> Fund Managers Jersey <strong>Limited</strong> (the “Manager”) to prepare financial statements for eachyear which give a true and fair view of the state of affairs of the Company and the Company’s total return for the year. In preparingthose financial statements the Manager is required to:ЉЉselect suitable accounting policies and then apply them consistently;ЉЉmake judgements and estimates that are reasonable and prudent;ЉЉstate whether applicable accounting standards have been followed, subject to any material departures disclosed andexplained in the financial statements; andЉЉprepare the financial statements on a going concern basis unless it is inappropriate to presume that the Company willcontinue in business.The Manager is responsible for the management of the Company in accordance with the prospectus. Capita Trust Company (Jersey)<strong>Limited</strong> (the “Custodian”) is responsible for safeguarding the assets of the Company. The Manager and the Custodian are responsiblefor taking reasonable steps for the prevention and detection of fraud and other irregularities as appropriate to their respective dutiesas set out in the prospectus and the Custodian Agreement.The financial statements have been prepared for each class fund, along with an aggregated financial statement for the Company as awhole.The Manager confirms that it has complied with the above requirements in preparing the financial statements.<strong>STANLIB</strong> Fund Managers Jersey <strong>Limited</strong>(formerly Standard Bank Fund Managers Jersey <strong>Limited</strong>)28 May 20133
<strong>STANLIB</strong> <strong>Funds</strong> <strong>Limited</strong><strong>Report</strong> of the CustodianTo the members of <strong>STANLIB</strong> <strong>Funds</strong> <strong>Limited</strong>.It is the opinion of Capita Trust Company (Jersey) <strong>Limited</strong> in respect of the year ended 31 December <strong>2012</strong>, during the time we acted asCustodian to the Class <strong>Funds</strong> of <strong>STANLIB</strong> <strong>Funds</strong> <strong>Limited</strong> (the “Company”), that to the best of our information, knowledge and belief,that in all material respects, the Manager managed the Class <strong>Funds</strong> in that year:a. in accordance with the limitations imposed on the investment and borrowing powers of the Company by the Articles,Prospectus and Class Fund Rules and;b. otherwise in accordance with the provisions of the Management and Custodian Agreements.Capita Trust Company (Jersey) <strong>Limited</strong>JerseyChannel Islands30 May 20134
<strong>STANLIB</strong> <strong>Funds</strong> <strong>Limited</strong>Investment Manager’s <strong>Report</strong>The following table sets out the results achieved since launch, net of fees, for the class funds of <strong>STANLIB</strong> <strong>Funds</strong> <strong>Limited</strong>.USD <strong>Annual</strong> Return since LaunchLaunch Date Class Fund BenchmarkExcessReturnGlobal Property Fund* 1 September 2009 15.90% 15.84% 0.06%<strong>STANLIB</strong> Multi-Manager Global Bond Fund 21 December 1998 5.64% 5.49% 0.15%<strong>STANLIB</strong> Multi-Manager Global Equity Fund 21 December 1998 4.53% 2.87% 1.65%High Alpha Global Equity Fund 28 September 2007 -3.58% -1.82% -1.75%<strong>STANLIB</strong> Global Bond Fund 18 July 2008 8.43% 5.25% 3.18%* Performance since fully invested on 1 September 2009, the Class Fund launched 1 July 2009 and the return is 20.56% v benchmark of 19.18%.<strong>STANLIB</strong> Global Emerging Markets Fund was not included in the above table as it launched on 6 December <strong>2012</strong>.Performance data for the fiscal year <strong>2012</strong> and commentaries of each of the underlying class funds vs. their respective benchmarkshas been provided below.Global Property FundBenchmark UBS Global Investors IndexClass Fund return 26.04%Benchmark return 24.93%Global Property Investors returned 26.04% (USD Total Return)for the year <strong>2012</strong>. The best performing region was Singaporefollowed by Hong Kong, UK and Australia. The worst performingregion was North America followed by Japan and Europe. NorthAmerica was subdued after a strong first half as investorssought a safe haven from the Eurozone crises. Japan listedproperty had a strong second half on the back of monetaryeasing and calls for a 2% inflation target to be created afteryears of deflation. However this strong performance was offsetby the Yen which fell more than 12% relative to the US Dollar.Hong Kong was strong as office rents improved and strongperformance with the rest of Asia as China seemingly averteda hard landing. Europe had a strong second half after sovereigndebt problems in Europe were deferred. Global listed propertyoutperformed global equity and bonds in <strong>2012</strong>. The bestperformance was from listed property in emerging markets.Global Property Developers significantly outperformed GlobalProperty Investors during the year. The best performing stockswere Gagfah and St. Modwen Properties; both returned morethan 100% for the year. The worst performing stocks wereNieuwe Steen Investments NV and Kungsleden AB.The portfolio focuses on listed property in developed marketsand is strongly biased toward Property Investors as opposedto property developers. Property investors earn most of theirearnings from rental income and have a more moderate growthprofile compared to property developers.North America and Hong Kong and Japan made the biggestcontribution to relative return while Europe was the biggestdetractor. Stocks that made the biggest contribution to relativereturn were NEPI, Growthpoint Properties Australia, HCP Incand Hong Kong Land. The biggest detractors from relativereturn were Boston Properties and Alstria Office REIT. Theaverage cash balance held during the year was around 4.1%Policy responses to the global financial crisis around the worldis expected to remain supportive for listed property and newsupply remains constrained across most property sectors. UShouse prices seem to be recovering faster than expected whichbodes well for the US economy and also global GDP growthbut this could also be a double edged sword for REITs if thereis a rotation away from yield oriented investments. Ongoingdebates and negotiations over resolution of the US budgetdeficit may create some uncertainty in the first quarter of 2013.In addition many of the same risks faced in <strong>2012</strong> remain in placefor 2013. The portfolio currently has an implied forward yieldaround 3.8%<strong>STANLIB</strong> Multi-Manager Global Bond FundBenchmarkClass Fund return 6.41%Benchmark return 4.84%Barclays Global MultiverseTR IndexDemand for risky assets saw core government bondsunderperform during the year. Following the strong rally in 2011,Treasuries, Gilts and Bunds were only up by 2%, 3% and 4%respectively in <strong>2012</strong>. These are certainly modest comparedwith the outsized returns of 10%, 17%, and 10% in 2011. Yieldsacross the entire curve in the peripheral Eurozone countries(Italy, Ireland and Portugal) fell in reaction to the ECB’s boldannouncement that it was ready to do what it takes to preservethe Euro. Credit spreads generally narrowed over the year,benefiting from improved sentiment. While all the majorcorporate credit sectors posted strong returns during theperiod under review, financials and the lower-rated segmentsbenefited the most. From a currency perspective, theannouncement of additional quantitative easing and the riskonenvironment caused the US dollar to underperform mostcurrencies with the DXY index declining for the first time in 3years. Conversely the Euro was up for the first time in 3 years,while sterling continued to appreciate against both.5
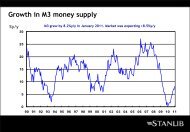
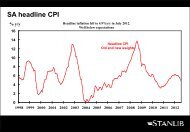
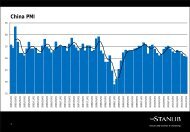
<strong>STANLIB</strong> <strong>Funds</strong> <strong>Limited</strong>Investment Manager’s <strong>Report</strong> (continued)The <strong>STANLIB</strong> Multi Manager Global Bond Fund had a goodyear, outperforming the Barclays Multiverse index by 157basis points (after fees) with a return of 6.4%. This is now thefourth consecutive year of outperforming both peers and thebenchmark. All three of the active managers beat the indexwith Brandywine’s more aggressive country and currencypositioning providing the majority of the outperformance.The biggest contribution to relative returns for the ClassFund was all the active managers’ overweight position in thePolish zloty (one of the best performing currencies) as wellas being underweight in the Japanese yen. The latter wasweakened by hopes of more aggressive monetary policyunder the new Abe-leadership resulting in the yen being theweakest G10 currency against the dollar. Columbia and Capitalderived a significant portion of their outperformance fromhigh yield bond exposure, which performed well as a result ofspread compression in the risk-on environment. Our passivemandate with Blackrock also contributed as the index theyare benchmarked against is GDP weighted rather than marketcap based, implying higher emerging market debt exposure atthe expense of Japan. Unfortunately their risk screen overlaymeant they were underweight the periphery, which detractedas yields in Spain and Italy declined. Finally, it’s interesting tonote the significant difference in performance between theold JP Morgan government bond index (+1.3%) and our current“smart” Barclays Multiverse benchmark (+4.8%). The mainreason for this is currency exposure (more yen in JP Morgan) aswell as corporate and high yield allocation (in Barclays).The paradox of <strong>2012</strong> was how well risk assets performeddespite weak growth and lingering event risk. In our view,the strong performance of risk assets reflected the powerof central bank liquidity and attractive valuations. Lookingforward, we think the paradox of 2013 will be a global economicbackdrop which improves but the performance of risk assetsturns out to be more muted. This reflects less compellingvaluations today. We believe accommodative monetarypolicies of major central banks will support activity and containdownside risk, but the underlying trajectory of global growthremains modest due to lingering structural problems and theneed for deleveraging. For now, we don’t expect inflation to bea significant risk but we do worry that once the headwinds toglobal growth finally fade, inflation could become an issue asthe easiest option for most central banks would be to inflatetheir way out of the problem. Our views on fundamentalvaluations across fixed income sectors remain largelyunchanged. Whilst we are not forecasting a sharp spike in yieldsfrom current levels we expect 2013 to be a year that reinforcesour belief that yields have experienced their lows in the currentcycle. Given current spreads are significantly tighter than ayear ago, reproducing <strong>2012</strong>-like excess returns over the next 12months would be very unlikely and valuations leave investorswith much less protection against unexpected economic,market, or geopolitical shocks.<strong>STANLIB</strong> Multi-Manager Global Equity FundBenchmarkClass Fund return 17.25%Benchmark return 16.38%MSCI ACWI IMI with NetDividends Reinvested<strong>2012</strong> was particularly eventful with regards to political eventsand central bank actions, which eventually proved favourable tofinancial markets. Smooth leadership transitions in the world’sthree largest economies lifted sentiment; quantitative easingfrom the US Federal Reserve and the Bank of Japan propelledrisk-asset rallies; and finally a ‘mini’ fiscal cliff deal in the US,albeit at the very last minute, brought the S&P 500 index toa post-recession high. Earnings remained positive, but on adecelerating path. US GDP was up a surprising 3% and the Fedstated that it would not raise rates until unemployment reached6.5% (currently 7.7%) and inflation does not rise above 2.5%.European equities continued to outperform as investors choseto return to these assets following news on the sovereign crisisfront that was reckoned to be less worrying - despite signs thatGDP in Europe was heading into negative territory. For the yearas a whole the DAX (+29%) had its best year since 2003, whilethe Nikkei (+26%) enjoyed its best returns since 2005. In China,a 15% rally in December helped the Shanghai Composite eraseits earlier losses to finish the year with a modest gain of 6%.The <strong>STANLIB</strong> Multi Manager Global Equity Fund outperformedthe benchmark MSCI AC World IMI by 87 basis points, witha return of 17.25%. This marks the fourth consecutive yearof outperforming both peers and benchmark. Veritas, themanager with the most defensive profile lagged the benchmark,primarily due to a significant underweight in financials, but it’spleasing to note that the other two managers with a defensivebias (Fidelity and Aberdeen) posted stronger relative returns inline or ahead of their respective indices. It is also encouraging tosee that continued strong performance from Capital enabledthe manager to finish the year 140 basis points ahead of thebenchmark, while Marathon extended its outperformance to890 basis points for the full calendar year. The total portfoliocurrently trades at a slight discount to the market (PE of 15.9vs. 16.4) with a dividend yield which is in line with the index at2.7%. From a sector perspective the Class Fund is overweighthealthcare at the expense of financials while remaining biasedtowards Western Europe (specifically Switzerland) andunderweight the US.6
<strong>STANLIB</strong> <strong>Funds</strong> <strong>Limited</strong>Investment Manager’s <strong>Report</strong> (continued)<strong>STANLIB</strong> Multi-Manager Global Equity Fund (continued)Relative valuation provides the strongest argument for equities.In this regard the gap between dividend and cash yields hasnot been this high since the 1950s. Moreover, with 10-yearTreasuries yielding approximately 1.7%, the S&P 100’s projected2013 dividend yield of 2.6% provides large cap dividend incomethat is more than 50% higher. Hence, stocks can be attractiveas not only an appreciating asset but also as one with superiorincome benefits which, in today’s yield hungry environment, isa big plus. In addition, the differential between junk bond yieldsand cash flow yields argues for continued de-equitization. Onthe downside we worry about the ability of central banks toovercome the persistent forces of deleveraging. Clearly thesolution to current indebtedness will take at least a decadeto resolve (implying we are only half way) which will pose achallenge to investor patience. We would also caution againsttrying to forecast political outcomes. To this end, who wouldhave thought Greek equities would gain 37% in <strong>2012</strong> in a periodwhen the countries’ government bonds underwent anotherrestructuring programme while the country continued to slipagainst its fiscal and growth targets? Maybe mean revisionexplains some of the moves last year but we attribute it moreto policy responses (ECB’s LTRO and OMT programs) andrhetoric e.g. “whatever it takes”. Broadly speaking, equities didwell last year as a result of multiple expansion, which we wouldnot expect again in 2013. Given we are probably near the peakof the current earnings’ cycle, some caution is warranted. Whilewe’re bullish over the longer term (due to aforementionedrelative valuations) we expect volatility to pick up and wouldrecommend investors extend their investment horizon.High Alpha Global Equity FundBenchmarkClass Fund return 11.59%Benchmark return 16.13%MSCI AC World Index withNet Dividends ReinvestedThe assets in this Class Fund were transitioned from OriginAsset Management to Threadneedle Asset Managementin November. Threadneedle is the newly appointed subinvestmentmanager.Global equity markets performed well during the <strong>2012</strong> althoughwith significant volatility. Markets as measured by the MSCIWorld All Countries Index increased by 16.8% in U.S. Dollar terms.All regions of the world saw good gains and Emerging marketsoutperformed developed markets posting US$ total returns of+18.6% vs +16.5% (-18.2% vs -5.0% for 2011). The European regionreturns. The European region gained 19.9%, followed by theNorth American (+15.6%) and Pacific (+14.6%) regions.The Class Fund increased in value by 11.6% over the year,underperforming its benchmark. In the light of continuedunder performance by Origin despite continuing to implementits process, <strong>STANLIB</strong> embarked on a global search for areplacement manager that saw Threadneedle being appointed.Threadneedle is an established global asset manager andcurrently has assets under management of US$123.1 billion,of which US$3 billion is in global equities. The portfolio wastransitioned to the new manager during November <strong>2012</strong>.Looking at sector returns, defensiveness was certainly thetheme for the year as a whole. Retailing was the best performerduring the year followed by pharmaceuticals and healthcare. Atthe bottom end came the deep cyclical steel materials (miningsectors) and energy which declined by 14% and 10% respectively.Equity markets gained ground over the final quarter of <strong>2012</strong> asinvestors’ appetite for risk was bolstered by signs that the recoveryin the US economy is gaining momentum and an encouragingimprovement in leading Chinese economic indicators. While theEuropean economic background deteriorated, investors wereencouraged by further measures to address the region’s debtcrisis and avert a break-up of the euro zone. Equity markets werealso reassured by clear signs that the leading central banks remaincommitted to maintaining historically low interest rates and assetpurchase programmes.A deal was anticipated to avoid the US going over the fiscal cliff riskand note the positive signs emerging from the Chinese economy,but believe that the relief rally is unlikely to be sustained giventhe headwinds facing the world economy. On a more positivenote, some US economic surveys are increasingly reflecting thebenefits of lower cost energy from the shale industry and thesustained recovery in the housing market. Given the mixed globaleconomic outlook, Threadneadle retain their cautiously optimisticoverall bias. At the stock level, Threadneadle’s focus remains oncompanies believed to offer sustainable competitive advantagesand relatively attractive earnings growth prospects in the presentlow growth environment.<strong>STANLIB</strong> Global Bond FundBenchmarkClass Fund return * 10.39%Benchmark return 4.32%Barclays Capital GlobalAggregate TR IndexThe assets in this Class Fund are managed solely by BrandywineGlobal who is the appointed sub-investment manager.The <strong>STANLIB</strong> Single Manager Global Bond portfoliooutperformed its Barclays Capital Global Aggregatebenchmark on a net-of-fees basis by 607bps in calendar year<strong>2012</strong>. The portfolio’s relative performance benefited fromeach attribution category. In order of magnitude to relativeperformance, currency decisions, a higher yield profile, sectorand quality decisions, and yield curve effects all contributed.A zero weight to the Japanese yen produced the strongestcontribution to relative returns, and drove currency effectsto produce the most significant contribution to relativeperformance. The yen sank against all major currencies duringthe period following a paradigm change in expectations relatedto the central bank’s definition of price stability. In mid-December <strong>2012</strong>, the Liberal Democratic Party won a sweepingvictory in parliamentary elections on a promise to reflate theeconomy by influencing easier monetary and fiscal policy.An allocation to investment-grade corporates also benefitedperformance. Spreads tightened across all major credit sectorsas tail risks receded and the global growth outlook improvedmodestly. The provision of additional monetary easing alsohelped tighten spreads.7
<strong>STANLIB</strong> <strong>Funds</strong> <strong>Limited</strong>Investment Manager’s <strong>Report</strong> (continued)<strong>STANLIB</strong> Global Bond Fund (continued)Yield curve effects helped relative performance in the fourthquarter, but to a lesser extent than active currency positioning.The conditions encouraging investors to hunt for yield onlystrengthened during the period, boosting the value of debtfrom higher yielding countries like Poland, Hungary, SouthAfrica, and South Korea. Each of these countries cut policyrates during the 12 month period as well, benefiting holdersof fixed rate obligations. Weak external demand conditions,especially emanating from the economic malaise in Europe,and the provision of extraordinary amounts of liquidity fromglobal centrals banks drove these interest rate cuts.The primary detractor from performance over the period wasan underweight position to France since the country’s debtrallied as the European Central Bank expanded its balancesheet through Longer-Term Refinancing Operations and theOutright Monetary Transaction later in the period. Our positionin U.S. Treasuries also detracted since US growth remainedstronger than many market participants expected over thecourse of the year. Our underweight position in the Australiandollar detracted from performance since the Australian dollarrose against the U.S. dollar in <strong>2012</strong> as part of the global searchfor yield, especially given the country’s AAA credit rating. Anoverweight position to the South African rand also detractedfrom relative performance since the mining strikes weighed oninvestor sentiment towards the country and its currency.<strong>STANLIB</strong> Global Emerging Markets FundThe assets in this Class Fund are managed solely byThreadneedle Investments who is the appointed subinvestmentmanager.The Class Fund launched on 6 December <strong>2012</strong>. The issue priceper share was US$1,000. The net asset value per share at yearend was US$ 1,023.68.<strong>STANLIB</strong> Asset Management <strong>Limited</strong>April 20138
<strong>STANLIB</strong> <strong>Funds</strong> <strong>Limited</strong><strong>Report</strong> of the Independent Auditor to the members of<strong>STANLIB</strong> <strong>Funds</strong> <strong>Limited</strong><strong>Report</strong> on the financial statementsWe have audited the accompanying financial statements of <strong>STANLIB</strong> <strong>Funds</strong> <strong>Limited</strong> (“the Company”) and its class funds (the “Class<strong>Funds</strong>”) as noted in page 3 which comprise the aggregated balance sheet and the balance sheet of each class fund as of 31 December<strong>2012</strong> and the aggregated statement of total return, the statement of total return for each class fund, the aggregated statement ofchanges in net assets attributable to holders of redeemable participating shares, the statement of changes in net assets attributableto holders of redeemable participating shares of each class fund for the year then ended and a summary of significant accountingpolicies and other explanatory information.Directors’ responsibility for the financial statementsThe directors are responsible for the preparation of financial statements that give a true and fair view in accordance with UnitedKingdom Accounting Standards and with the requirements of Jersey law. The directors are also responsible for such internal controlas they determine is necessary to enable the preparation of financial statements that are free from material misstatement, whetherdue to fraud or error.Auditors’ responsibilityOur responsibility is to express an opinion on these financial statements based on our audit. We conducted our audit in accordancewith International Standards on Auditing. Those Standards require that we comply with ethical requirements and plan and performthe audit to obtain reasonable assurance whether the financial statements are free from material misstatement.An audit involves performing procedures to obtain audit evidence about the amounts and disclosures in the financial statements.The procedures selected depend on the auditors’ judgment, including the assessment of the risks of material misstatement of thefinancial statements, whether due to fraud or error. In making those risk assessments, the auditor considers internal control relevantto the entity’s preparation and fair presentation of the financial statements in order to design audit procedures that are appropriate inthe circumstances, but not for the purpose of expressing an opinion on the effectiveness of the entity’s internal control. An audit alsoincludes evaluating the appropriateness of accounting policies used and the reasonableness of accounting estimates made by thedirectors, as well as evaluating the overall presentation of the financial statements.We believe that the audit evidence we have obtained is sufficient and appropriate to provide a basis for our audit opinion.OpinionIn our opinion, the financial statements give a true and fair view of the financial position of the Company and the Class <strong>Funds</strong> asof 31 December <strong>2012</strong>, and of their financial performance for the year then ended in accordance with United Kingdom AccountingStandards and have been properly prepared in accordance with the requirements of the Companies (Jersey) Law 1991.<strong>Report</strong> on other legal and regulatory requirementsWe read the other information contained in the <strong>Annual</strong> <strong>Report</strong> and consider the implications for our report if we become aware of anyapparent misstatements or material inconsistencies with the financial statements. The other information comprises the investmentmanager’s report, the report of the directors, fund statistics-unaudited and summary of material portfolio changes -unaudited.In our opinion the information given in the report of the directors is consistent with the financial statements.This report, including the opinion, has been prepared for and only for the Company’s members as a body in accordance with Article11,3A of the Companies (Jersey) Law 1991 and for no other purpose. We do not, in giving this opinion, accept or assume responsibilityfor any other purpose or to any other person to whom this report is shown or into whose hands it may come save where expresslyagreed by our prior consent in writing.Christopher StuartFor and on behalf of PricewaterhouseCoopcrs CI LLPChartered AccountantsJersey, Channel Islands30 May 20139
<strong>STANLIB</strong> <strong>Funds</strong> <strong>Limited</strong>Statement of Total Return for the year ended 31 December <strong>2012</strong>Global Property Fund<strong>STANLIB</strong> Multi-Manager GlobalBond Fund<strong>STANLIB</strong> Multi-Manager GlobalEquity FundHigh Alpha Global Equity Fund<strong>2012</strong> 2011 <strong>2012</strong> 2011 <strong>2012</strong> 2011 <strong>2012</strong> 2011Notes USD USD USD USD USD USD USD USDNet capital gains/(losses) on investments 3 10,110,709 (680,252) 9,686,876 14,487,544 171,389,451 (119,322,503) 68,171,957 (66,274,812)Revenue 4 2,247,525 1,387,264 16,791,205 17,599,423 41,576,912 33,071,277 16,836,951 14,537,779Expenses 5 (369,111) (249,300) (2,813,987) (3,328,710) (13,066,670) (11,753,505) (5,290,553) (6,981,091)Finance costs: Interest (2,388) (857) (15,721) (11,615) (24,592) (31,883) (568) –Net revenue/(expenses) for the year before taxation 1,876,026 1,137,107 13,961,497 14,259,098 28,485,650 21,285,889 11,545,830 7,556,688Taxation (392,381) (179,321) (236,909) (315,991) (6,651,839) (4,854,541) (3,038,960) (2,802,629)Net revenue/(expenses) for the year after taxation 1,483,645 957,786 13,724,588 13,943,107 21,833,811 16,431,348 8,506,870 4,754,059Change in net assets attributable to Shareholders frominvesting activities11,594,354 277,534 23,411,464 28,430,651 193,223,262 (102,891,155) 76,678,827 (61,520,753)Statements of Changes in Net Assets Attributable to Holders of Redeemable Participating SharesGlobal Property Fund<strong>STANLIB</strong> Multi-Manager GlobalBond Fund<strong>STANLIB</strong> Multi-Manager GlobalEquity FundHigh Alpha Global Equity Fund<strong>2012</strong> 2011 <strong>2012</strong> 2011 <strong>2012</strong> 2011 <strong>2012</strong> 2011USD USD USD USD USD USD USD USDNet assets at the start of the year 33,557,524 37,808,990 358,653,440 476,386,117 1,367,888,233 1,171,930,890 753,842,969 889,228,404Amounts received on creation of shares 42,320,608 4,341,234 166,155,173 49,922,997 531,256,608 763,911,750 97,869,895 114,459,800Amounts paid on liquidation of shares (8,387,945) (8,870,234) (14,355,950) (196,312,660) (609,844,100) (466,725,775) (239,290,937) (188,324,482)Swing pricing – – 279,493 226,335 2,221,049 1,662,523 – –Net increase/(decrease) in shareholders’ net assets frominvestment activities (as above)11,594,354 277,534 23,411,464 28,430,651 193,223,262 (102,891,155) 76,678,827 (61,520,753)Net assets at the end of the year 79,084,541 33,557,524 534,143,620 358,653,440 1,484,745,052 1,367,888,233 689,100,754 753,842,969The notes on pages 18 to 188 form an integral part of the financial statements.10
<strong>STANLIB</strong> <strong>Funds</strong> <strong>Limited</strong>Balance Sheet as at 31 December <strong>2012</strong>Global Property Fund<strong>STANLIB</strong> Multi-Manager GlobalBond Fund<strong>STANLIB</strong> Multi-Manager GlobalEquity FundHigh Alpha Global Equity Fund<strong>2012</strong> 2011 <strong>2012</strong> 2011 <strong>2012</strong> 2011 <strong>2012</strong> 2011Notes USD USD USD USD USD USD USD USDAssetsInvestments 76,693,454 32,420,444 513,431,063 346,625,066 1,431,042,898 1,289,675,585 682,386,282 748,591,763Cash and bank balances 2,885,783 1,328,592 51,686,036 28,456,505 57,615,632 77,678,111 8,169,451 6,065,078Unrealised gain on forward foreign currency contracts 12 – – 408,461 1,070,263 – 22,358 – –Unrealised gain on futures contracts 12 – – – – 18,239 147,012 – –Amounts due on creations – 85 – – – 9,865 – –Revenue receivable 277,899 196,163 5,156,077 4,790,899 1,661,307 2,674,633 784,711 1,066,765Amounts due from brokers 715,858 – 5,915,637 1,511,136 286,463 1,492,941 – –Sundry debtors 4,425 – 36,006 – 76,854 – 41,444 –Total assets 80,577,419 33,945,284 576,633,280 382,453,869 1,490,701,393 1,371,700,505 691,381,888 755,723,606EquityNon-redeemable founders' shares 7 – – – – -100 -100 – –Total equity – – – – -100 -100 – –LiabilitiesBank Overdraft – (263,212) (840,447) – (212,442) (60,962) – –Unrealised loss on forward foreign currency contracts 12 – – (938,801) (1,428,952) (2,154) (6,803) – –Amounts due to brokers (1,201,230) – (39,630,153) (21,158,915) (1,359,496) (1,147,122) – –Amounts due on redemptions – – – – – – (1,298,042) –Management fees payable (270,561) (63,831) (1,010,696) (519,388) (4,056,223) (1,723,945) (574,236) (919,592)Accrued expenses (21,087) (60,717) (69,563) (693,174) (325,926) (873,340) (408,856) (961,045)Total liabilities (1,492,878) (387,760) (42,489,660) (23,800,429) (5,956,241) (3,812,172) (2,281,134) (1,880,637)Net assets attributable to unitholders 79,084,541 33,557,524 534,143,620 358,653,440 1,484,745,052 1,367,888,233 689,100,754 753,842,969The financial statements were signed on behalf of the Board of Directors on 28 May 2013 by:Director Michael Farrow Neil DeaconThe notes on pages 18 to 188 form an integral part of the financial statements.12
<strong>STANLIB</strong> <strong>Funds</strong> <strong>Limited</strong>Balance Sheet as at 31 December <strong>2012</strong><strong>STANLIB</strong> Global Bond Fund<strong>STANLIB</strong> Global EmergingMarkets Fund*Aggregated Fund<strong>2012</strong> 2011 <strong>2012</strong> 2011 <strong>2012</strong> 2011Notes USD USD USD USD USD USDAssetsInvestments 77,823,590 64,935,773 98,841,435 – 2,880,218,722 2,482,248,631Cash and bank balances 3,456,216 8,141,073 4,735,293 – 128,548,411 121,669,359Unrealised gain on forward foreign currency contracts 12 135,714 237,028 – – 544,175 1,329,649Unrealised gain on futures contracts 12 – – – – 18,239 147,012Amounts due on creations – – – – – 9,950Revenue receivable 950,524 1,170,654 40,283 – 8,870,801 9,899,114Amounts due from brokers – – 226,415 – 7,144,373 3,004,077Sundry debtors 12,031 – – – 170,760 –Total assets 82,378,075 74,484,528 103,843,426 – 3,025,515,481 2,618,307,792EquityNon-redeemable founders' shares 7 – – – – -100 -100Total equity – – – – -100 -100LiabilitiesBank Overdraft (55,748) – – – (1,108,637) (324,174)Unrealised loss on forward foreign currency contracts 12 (242,941) (908,302) – – (1,183,896) (2,344,057)Amounts due to brokers – – (377,280) – (42,568,159) (22,306,037)Amounts due on redemptions – – – – (1,298,042) –Management fees payable (230,272) (108,656) (43,779) – (6,185,767) (3,335,412)Accrued expenses (12,435) (290,828) (73,435) – (911,302) (2,879,104)Total liabilities (541,396) (1,307,786) (494,494) – (53,255,803) (31,188,784)Net assets attributable to unitholders 81,836,679 73,176,742 103,348,932 – 2,972,259,578 2,587,118,908* Class Fund launched on 6 December <strong>2012</strong>The financial statements were signed on behalf of the Board of Directors on 28 May 2013 by:Director Michael Farrow Neil DeaconThe notes on pages 18 to 188 form an integral part of the financial statements.13
<strong>STANLIB</strong> <strong>Funds</strong> <strong>Limited</strong>Notes to the Financial Statements1.Incorporation<strong>STANLIB</strong> <strong>Funds</strong> <strong>Limited</strong> (the “Company”) was incorporatedas Liberty International <strong>Funds</strong> <strong>Limited</strong> in Jersey on 18 March1996. The name of the Company since 16 May 2006 has been<strong>STANLIB</strong> <strong>Funds</strong> <strong>Limited</strong>.The Company is an open-ended investment company in thatit may issue and redeem participating shares. The Company islisted on the Irish Stock Exchange.As at 31 December <strong>2012</strong>, participating shares were offered inthe Company as shares of the Global Property Fund, <strong>STANLIB</strong>Multi-Manager Global Bond Fund, <strong>STANLIB</strong> Multi-Manager GlobalEquity Fund, High Alpha Global Equity Fund, <strong>STANLIB</strong> GlobalBond Fund and the <strong>STANLIB</strong> Global Emerging Markets Fund.The ultimate controlling party of the Company is LibertyHoldings <strong>Limited</strong> (domiciled in Johannesburg, South Africa).Liberty Group <strong>Limited</strong> (also domiciled in Johannesburg, SouthAfrica), which has direct holdings in the Company’s shares, is awholly-owned subsidiary of Liberty Holdings <strong>Limited</strong>.2.Accounting policiesBasis of accountingThe financial statements have been prepared on a goingconcern basis under the historical cost convention, asmodified by the fair valuation of investments, financialassets and financial liabilities, and in accordance with UnitedKingdom Accounting Standards and with the Statement ofRecommended Practice (“SORP”) for financial statementsof Authorised <strong>Funds</strong> issued by the Investment ManagementAssociation (“IMA”) in October 2010.The principal accounting policies applied in the preparation ofthese financial statements are set out below. These policieshave been consistently applied to all periods presented unlessotherwise stated in the following text.ComparativesThe classification of prior year figures has changed to conformto the current year’s presentation. These changes are strictlyfor presentational purposes and have no affect on the netassets of the Company. The changes were made to the note11 Financial instruments and associated risks and note 5Expenses. Specifically, for note 11 the currency risk disclosurewas updated to only include significant currency positions. Theliquidity risk note was also changed. Details of which can befound in note 11. For note 5 the Administration fee is includedin the Management fee as these are paid by the Manager out oftheir fees.InvestmentsInvestments listed on a recognised stock exchange or any otherorganised market are valued at bid price, or in the event thatthere are several such markets, on the basis of the last availablebid price on the main market for the relevant investment onthe balance sheet date. If the last available bid price for a giveninvestment does not truly reflect its value, then the investmentis valued on the basis of the probable sale price which theCompany’s Board of Directors deems prudent to assume. Nosuch estimates have been included in the financial statementsas at 31 December <strong>2012</strong> and 31 December 2011.Purchases and sales of investments are recognised on tradedate – the date on which the Company commits to purchaseor sell the asset. Investments are initially recognised at fairvalue, and transaction costs for all financial assets and financialliabilities carried at fair value through profit or loss are expensedas incurred. Investments are derecognised when the rights toreceive cash flows from the investments have expired or theCompany has transferred substantially all risks and rewards ofownership.Gains and losses arising from changes in the fair value of the‘Investments’ category are included in the Statement of TotalReturn in the year in which they arise.All related realised and change in unrealised gains and lossesare included in the Statement of Total Return as they arise.Derivative financial instrumentsDerivatives are initially recognised at fair value on the datea derivative contract is entered into and are subsequentlyre-measured at their fair value. Changes in fair value arerecognised immediately in the Statement of Total Return.IncomeDividends on equities are accounted for on an ex-dividendbasis and gross of taxation. Bank and deposit interest isaccounted for on an accruals basis. Interest from debtsecurities is recognised as revenue using the effective interestmethod by reference to the purchase price.ExpensesThe Company is responsible for its own operating expenses,including audit and legal fees and charges incurred on theacquisition and realisation of investments. Such operatingexpenses will be borne by the Class funds as the Directors shalldetermine, and usually pro rata if not clearly attributable to aspecific Class Fund.The expenses of introducing new Share Classes will be chargedto the relevant share class as provided for in the fund rules.The Manager may, at its discretion and without recourse to theCompany, pay commissions directly to investors or to investors’agents in respect of subscription for Shares, subject to thegeneral overriding requirement to treat Shareholders equally.All expenses, including Operating expenses, Custodian fees,Administration fees, Directors’ fees and Management fees areaccounted for on an accruals basis.Share issues and redemptionsParticipating shares in the Company may be issued andredeemed at prices calculated at each valuation date inaccordance with the Articles of Association and prospectus.14
<strong>STANLIB</strong> <strong>Funds</strong> <strong>Limited</strong>Notes to the Financial Statements (continued)Foreign currency translationAssets and liabilities in all other currencies different from thefunctional currency, being USD, are translated based on theexchange rates in effect at the date of the financial statements.Income and expenses in all other currencies different fromthe functional currency are translated based on the exchangerates in effect at the date of the transaction. Foreign currencytranslation gains or losses are credited or charged to theStatement of Total Return.The exchange rates were:Related party disclosuresIn compliance with FRS 8, “Related party disclosures” all relatedparty transactions and balances are disclosed in the thefinancial statements.31 December <strong>2012</strong> 31 December 2011USD/GBP 0.618525 0.643459USD/EUR 0.758188 0.770333Dividend policyDividends may be declared on individual Share Classes fromtime to time provided sufficient net income is available in theproportions attributable to that Share Class in the relevantClass Fund. The Fund Rules for each Share Class may alsospecify whether or not dividends may be paid.Cash flow statementThe Company is exempt from the requirement to prepare a cashflow statement, as it is an open-ended investment fund, whichmeets the conditions for exemption stated under Financial<strong>Report</strong>ing Standards (“FRS”) 1, “Cash Flow Statements”.Total expense ratioTotal expense ratio (“TER”) is calculated and disclosed asper the guidelines issued by the IMA. The ratio expresses thesum of all costs charged on an ongoing basis to each ClassFund’s assets (operating expenses) taken retrospectively as apercentage of each Class Fund’s average net assets. Operatingexpenses exclude transaction costs and commissions inconnection with transactions on the Class Fund’s portfolio.Swing PricingTo the extent that the Directors consider that it is in the bestinterest of the Company, given the prevailing market conditionsand the level of certain subscriptions or redemptions requestedby Shareholders in relation to the size of any Class Fund on anybusiness day, an adjustment, as determined by the Directorsat their discretion, may be reflected in the net asset value pershare of the Class <strong>Funds</strong> for such sum as may represent thepercentage estimate of costs and expenses which may beincurred by the relevant Class Fund under such conditions.The adjustment, where applied, is included within the dealingprice available to Shareholders and is disclosed separatelyunder “Swing pricing” in the Statement of Changes in NetAssets Attributable to Holders of Redeemable ParticipatingShares in accordance with SORP.15
<strong>STANLIB</strong> <strong>Funds</strong> <strong>Limited</strong>Notes to the Financial Statement (continued)3.Net capital movementGlobal Property Fund<strong>STANLIB</strong> Multi-Manager GlobalBond Fund<strong>STANLIB</strong> Multi-Manager GlobalEquity FundHigh Alpha Global Equity Fund<strong>2012</strong> 2011 <strong>2012</strong> 2011 <strong>2012</strong> 2011 <strong>2012</strong> 2011USD USD USD USD USD USD USD USDNon-derivative securities:Net realised gain on investments 1,294,633 1,667,374 4,305,361 15,270,989 28,342,302 41,248,912 94,634,799 40,978,983Net movement in unrealised gain or loss on investments 8,927,737 (2,198,829) 10,036,268 (934,798) 145,595,777 (157,448,309) (25,784,883) (105,809,041)10,222,370 (531,455) 14,341,629 14,336,191 173,938,079 (116,199,397) 68,849,916 (64,830,058)Derivative securities:Net realised (loss)/gain on forward foreign exchangecontracts(111,661) (148,797) (4,483,102) 339,571 (2,402,146) (3,281,914) (677,959) (1,444,754)Net movement in unrealised gain or loss on forwardforeign exchange contracts– – (171,651) (188,218) (146,482) 158,808 – –(111,661) (148,797) (4,654,753) 151,353 (2,548,628) (3,123,106) (677,959) (1,444,754)Net capital gain/(loss) 10,110,709 (680,252) 9,686,876 14,487,544 171,389,451 (119,322,503) 68,171,957 (66,274,812)16
<strong>STANLIB</strong> <strong>Funds</strong> <strong>Limited</strong>Notes to the Financial Statement (continued)3.Net capital movement (con tined)<strong>STANLIB</strong> Global Bond Fund<strong>STANLIB</strong> Global EmergingMarkets Fund*Aggregated Fund<strong>2012</strong> 2011 <strong>2012</strong> 2011 <strong>2012</strong> 2011USD USD USD USD USD USDNon-derivative securities:Net realised gain on investments 2,697,180 5,832,955 1,038,764 – 132,313,039 104,999,213Net movement in unrealised gain or loss on investments 2,262,906 (973,574) 1,160,444 – 142,198,249 (267,364,551)Derivative securities:Net realised (loss)/gain on forward foreign exchangecontracts(1,036,259) 106,558 86,847 – (8,624,280) (4,429,336)Net movement in unrealised gain or loss on forwardforeign exchange contracts564,047 (366,031) – – 245,914 (395,441)Net capital gain/(loss) 4,487,874 4,599,908 2,286,055 – 266,132,922 (167,190,115)Net capital gain/(loss) 10,110,709 (680,252) 9,686,876 14,487,544 171,389,451 (119,322,503)* Class Fund launched on 6 December <strong>2012</strong>4.RevenueGlobal Property Fund<strong>STANLIB</strong> Multi-Manager GlobalBond Fund<strong>STANLIB</strong> Multi-Manager GlobalEquity FundHigh Alpha Global Equity Fund<strong>2012</strong> 2011 <strong>2012</strong> 2011 <strong>2012</strong> 2011 <strong>2012</strong> 2011USD USD USD USD USD USD USD USDDividend income 2,247,472 1,387,145 – – 41,525,300 33,063,858 16,836,951 14,537,779Bond interest – – 16,777,898 17,507,350 – – –Deposit interest 53 119 8,354 92,073 6,328 7,419 – –Other income – – 4,953 – 45,284 – – –Total Revenue 2,247,525 1,387,264 16,791,205 17,599,423 41,576,912 33,071,277 16,836,951 14,537,77917
<strong>STANLIB</strong> <strong>Funds</strong> <strong>Limited</strong>Notes to the Financial Statement (continued)4.Revenue (continued)<strong>STANLIB</strong> Global Bond Fund<strong>STANLIB</strong> Global EmergingMarkets Fund*Aggregated Fund<strong>2012</strong> 2011 <strong>2012</strong> 2011 <strong>2012</strong> 2011USD USD USD USD USD USDDividend income – – 91,727 – 60,701,450 48,988,782Bond interest 4,220,213 4,238,448 – – 20,998,111 21,745,798Deposit interest – 1,221 – – 14,735 100,832Other income – – – – 50,237 –Total Revenue 4,220,213 4,239,669 91,727 – 81,764,533 70,835,412* Class Fund launched on 6 December <strong>2012</strong>5.ExpensesGlobal Property Fund<strong>STANLIB</strong> Multi-Manager GlobalBond Fund<strong>STANLIB</strong> Multi-Manager GlobalEquity FundHigh AlphaGlobal EquityFund<strong>2012</strong> 2011 <strong>2012</strong> 2011 <strong>2012</strong> 2011 <strong>2012</strong> 2011USD USD USD USD USD USD USD USDManagement fees 346,160 215,956 2,633,131 3,060,017 12,032,730 10,501,192 4,926,996 6,247,746Custodian fees 15,960 29,178 125,271 225,664 843,538 899,527 299,981 550,880Directors' fees 1,505 723 12,730 7,731 33,105 42,961 15,446 16,250Other operating expenses 5,486 3,443 42,855 35,298 157,297 309,825 48,130 166,215Total expenses 369,111 249,300 2,813,987 3,328,710 13,066,670 11,753,505 5,290,553 6,981,09118
<strong>STANLIB</strong> <strong>Funds</strong> <strong>Limited</strong>Notes to the Financial Statement (continued)5.Expenses (continued)<strong>STANLIB</strong> Global Bond Fund<strong>STANLIB</strong> Global EmergingMarkets Fund*Aggregated Fund<strong>2012</strong> 2011 <strong>2012</strong> 2011 <strong>2012</strong> 2011USD USD USD USD USD USDManagement fees 620,632 659,442 43,779 – 20,603,428 20,684,353Custodian fees 35,006 54,194 3,348 – 1,323,104 1,759,443Directors' fees 1,931 1,578 261 – 64,978 69,243Other operating expenses 7,908 7,499 69,791 – 331,467 522,280Total expenses 665,477 722,713 117,179 – 22,322,977 23,035,319* Class Fund launched on 6 December <strong>2012</strong>19
<strong>STANLIB</strong> <strong>Funds</strong> <strong>Limited</strong>Notes to the Financial Statement (continued)6.TaxationFor the purposes of Jersey taxation, the Company will fall underArticle 123C of the Income Tax (Jersey) Law 1961, as amended,as a Jersey resident company which is neither a “utilitycompany” nor a “financial services company” and as such willbe charged Jersey income tax at a rate of 0% on its income(other than on any rental income or property developmentprofits arising in respect of Jersey situs real property or land).The Company will not be subject to tax in Jersey on any capitalarising to it.Under applicable foreign tax laws, withholding taxes maybe deducted from interest, dividends and capital gainsattributable to the Company, at various rates. The Companypays withholding tax on dividends, which is deducted at source.This is shown separately as a taxation charge in the Statementof Total Return.7.Share capitalAuthorised100 Founders’ Shares of USD1 each5,000,000 UnclassifiedShares of USD 1 eachUnclassified Shares<strong>2012</strong> 2011USDUSD100 1005,000,000 5,000,0005,000,100 5,000,100The Articles of Association of the Company provide that theunclassified shares may be issued as participating shares ornominal shares.Under FRS 25, “Financial Instruments: Disclosure andPresentation”, each class of share capital falls under thedefinition of ‘non equity’ as participating shares can beredeemed at the direction of the participating shareholders orwhen the rights of other shareholders are restricted.Net assets attributable to holders of the redeemableparticipating shares represent a liability in the Balance Sheet,carried at the redemption amount that would be payable at thebalance sheet date if the holder exercised the right to redeemthe shares from the Company.Participating shares may be redeemed either out of theproceeds of the issue of nominal shares, or out of the income ofthe Class Fund, which would otherwise be available for dividend.On redemption of participating shares out of the income ofthe Class Fund, a sum equal to the nominal value of the sharesredeemed is transferred to a capital redemption reserve account.Nominal shares are subscribed and paid for by the Manager andmay be converted to participating shares upon the payment ofthe appropriate premium.Classes of SharesThe founders’ shares are not redeemable and do not carry anyrights to dividends. As at 31 December <strong>2012</strong> and 31 December2011, 100 founders’ shares were issued and outstanding. Thefounders’ shares and participating shares are entitled to onevote in respect of each share held. The holder of the nominalshares is entitled to one vote irrespective of the number ofshares held. All shares are entitled to participate in the propertyof the Fund on a winding-up as disclosed in the Prospectus.Movements in Share Capital and Share PremiumNumber of shares at31 December 2011Issued during theyearRedeemed duringthe yearGlobal Property Fund 21,964 24,010 (4,839) 41,135<strong>STANLIB</strong> Multi-Manager Global Bond Fund 184,298 81,266 ( 7,116) 258,448<strong>STANLIB</strong> Multi-Manager Global EquityFund865,422 308,994 (372,569) 801,847High Alpha Global Equity Fund-Class A 217,416 49,011 (85,447) 180,980High Alpha Global Equity Fund-Class B 783,907 73,737 (220,497) 637,147<strong>STANLIB</strong> Global Bond Fund 56,057 27,007 (26,207) 56,857<strong>STANLIB</strong> Global Emerging Markets Fund* – 101,093 – 101,093* Class Fund launched on 6 December <strong>2012</strong>Number of shares at31 December <strong>2012</strong>20
<strong>STANLIB</strong> <strong>Funds</strong> <strong>Limited</strong>Notes to the Financial Statement (continued)Swing PricingEffective 1 July 2011, a share price adjustment in the form ofswing pricing has been introduced.To the extent that the Directors consider that it is in the bestinterest of the Company, given the prevailing market conditionsand the level of certain subscriptions or redemptionsrequested by Shareholders in relation to the size of any ClassFund on any business day, an adjustment, as determined bythe Directors at their discretion, may be reflected in the netasset value per share of the Class <strong>Funds</strong> for such sum as mayrepresent the percentage estimate of costs and expenseswhich may be incurred by the relevant Class Fund under suchconditions. For the year ended 31 December <strong>2012</strong>, <strong>STANLIB</strong>Multi-Manager Global Equity Fund, <strong>STANLIB</strong> Multi-ManagerGlobal Bond Fund and <strong>STANLIB</strong> Global Bond Fund were subjectto such adjustment.The adjustment, where applied, is included within the dealingprice available to Shareholders and is disclosed separatelyunder “Swing pricing” in the Statement of Changes in NetAssets Attributable to Holders of Redeemable ParticipatingShares in accordance with SORP.8.Custodian feesPrior to 19 November <strong>2012</strong>, Citibank N.A. Jersey Branch, ascustodian, received a monthly fee being 0.04% per annum ofthe average net asset value of each Class Fund, subject to aminimum annual amount of USD 25,000 per annum. CitibankN.A. Jersey Branch, also received a transaction fee of USD 20for each portfolio transaction.Since 19 November <strong>2012</strong>, Capita Trust Company Jersey <strong>Limited</strong>,(the “Custodian”) has agreed with the Company that it will bepaid a fee at the following rates, subject to an overall minimumfee in respect of each Class Fund of US$5,000 per annum:On amounts less than US$50 million 0.035%On amounts of more than US$50 million, but less thanUS$100 millionOn amounts of more than US$100 million, but less thanUS$500 million0.025%0.010%On amounts over US$500 million 0.005%Such fees shall accrue daily and shall be payable to theCustodian by monthly payments in arrears becoming dueon the first Business Day of each month in respect of thepreceding month.The Custodian is also entitled to be reimbursed out of the Class<strong>Funds</strong> for charges and transaction fees levied on it by the Sub-Custodian and other sub-custodians which shall be at rateswhich have been negotiated on an arm’s length basis or areotherwise on commercial terms.The Custodian is entitled to be reimbursed out of the Class<strong>Funds</strong> for out-of-pocket expenses, and any sub-custodian fees(which will be at normal commercial rates).The total fees charged by the Custodian for the year ended 31December <strong>2012</strong> and 31 December 2011 are disclosed in note 5.9.Directors’ feesAny Director appointed as permanent Chairman is entitled toreceive an annual fee of GBP 25,000. No such appointmentwas applicable in <strong>2012</strong>. All other Directors receive an annual feeof GBP 20,000 with the exception of M Rabe who has waivedhis entitlement. The Directors may also be paid travelling, hoteland other expenses properly incurred by them in attending andreturning from the meetings of the Directors or other meetingsor in connection with the business of the Company.The cost is allocated in proportion to the net assets of each ofthe Class <strong>Funds</strong>. The total Directors’ fees amounted to USD64,978 for the year ended 31 December <strong>2012</strong> (31 December2011: USD 69,243).10.Related party transactionsManagement and investment management<strong>STANLIB</strong> Fund Managers Jersey <strong>Limited</strong> (formerly StandardBank Fund Manager Jersey <strong>Limited</strong>) (the “Manager”) and<strong>STANLIB</strong> Asset Management <strong>Limited</strong> (the “InvestmentManager”) are related parties of the Company, as defined byFRS 8. The Manager may receive a maximum annual fee of2.5% of the average net asset value of each Class Fund of theCompany calculated and accrued on each Dealing Day andpayable monthly in arrears.The Manager’s fees have been agreed at the following rates (perannum):ЉЉGlobal Property Fund 0.75%ЉЉ<strong>STANLIB</strong> Multi-Manager Global Bond Fund 0.75%ЉЉ<strong>STANLIB</strong> Multi-Manager Global Equity Fund 1.00%ЉЉHigh Alpha Global Equity Fund1.00% for class Aand 0.60% for class BЉЉ<strong>STANLIB</strong> Global Bond Fund 0.75%ЉЉ<strong>STANLIB</strong> Global Emerging Markets Fund 0.60%The Manager has delegated the performance of the investmentmanagement function in respect of the Company to theInvestment Manager. The Manager is responsible for the paymentof the fees of the Investment Manager out of the Manager’s fees.The Manager has delegated the administration function to BNYMellon Fund Services (Ireland) <strong>Limited</strong> (effective 19 November<strong>2012</strong>, prior to this the administrative function was carriedout by HSBC Securities Services (Luxembourg) S.A. Theadministration fees are paid for out of the Manager’s fees.The total fees charged by the Manager for the year ended 31December <strong>2012</strong> and 31 December 2011 are disclosed in note 5.11.Financial instruments and associated risksThe Class <strong>Funds</strong> hold a number of financial instrumentsprincipally comprising:ЉЉEquity shares and fixed income securities which areheld in accordance with each Class Fund’s investmentobjective and policies,ЉЉCash, liquid resources and short-term debtors andcreditors that arise directly from its operations, and,ЉЉForward foreign exchange contracts.21
<strong>STANLIB</strong> <strong>Funds</strong> <strong>Limited</strong>Notes to the Financial Statement (continued)11.Financial instruments and associated risks(continued)Under the Investment Management Agreement dated 21December 1998, <strong>STANLIB</strong> Asset Management <strong>Limited</strong> hasdelegated the management of each of the Class <strong>Funds</strong> to therespective managers as disclosed in the Investment Manager’s<strong>Report</strong> on pages 8 to 12. Policies for managing market, foreigncurrency, counterparty and liquidity risks are covered by therespective managers’ policies. The Fund Rules are used by theAdministrator and the Manager in order to monitor compliancewith respect to these risks.Market price riskMarket price risk arises mainly from uncertainty about futureprices of financial instruments held. It represents the potentialloss the Class <strong>Funds</strong> might suffer through holdings in theinvestment portfolio in the face of price movements. Adherenceto investment guidelines and to investment and borrowingpowers set out in the Class Fund Rules mitigate the risk ofexcessive exposure to any particular type of security or issuer.Sensitivity analysisThe table below summarises the sensitivity of the Class<strong>Funds</strong>’ net assets attributable to holders of redeemableparticipating shares to market price movements. It shows theincrease/(decrease) in the net assets attributable to holders ofredeemable participating shares for the Class <strong>Funds</strong>’ given a 5%movement in the underlying investment prices at year-end; allother variables remaining constant:Class Fund <strong>2012</strong> 2011USDUSDGlobal Property Fund 3,834,673 1,621,022<strong>STANLIB</strong> Multi-Manager GlobalBond Fund<strong>STANLIB</strong> Multi-Manager GlobalEquity Fund25,671,553 17,313,31971,552,145 64,491,908High Alpha Global Equity Fund 34,119,314 37,429,588<strong>STANLIB</strong> Global Bond Fund 3,891,180 3,213,225<strong>STANLIB</strong> Global Emerging MarketsFund** Class Fund launched on 6 December <strong>2012</strong>Credit risk4,942,072 –Each Class Fund is restricted to investing no more than 20% ofits net asset value in any one issuer and to investing in no morethan 20% of the total nominal amount of all issued securities ofthe same class in the invested corporation. Further details areincluded within the Portfolio Statement. These limits are testedon a daily basis by the Administrator, on a monthly basis by theManager and confirmation of adherence is received by theBoard of Directors on a quarterly basis, in order to demonstrateeffective control.The Class <strong>Funds</strong> are not exposed to credit risk from theCustodian, Sub-Custodian and banker as all assets of theclass funds are maintained in a segregated account, which aredesignated as client assets and are not co-mingled with anyproprietary assets of the Custodian.The Class <strong>Funds</strong> that use derivative financial instruments areexposed to credit risk from the counterparty to the contracts.Before transacting with any counterparty, the InvestmentManager or its affiliates evaluate both credit-worthinessand reputation by conducting a credit analysis of the party,their business and reputation. The credit risk of approvedcounterparties is then monitored on an ongoing basis, includingperiodic reviews of financial statements and interim financialreports as needed.The following tables analyse the credit quality of the fixedincome securities held on the bond class funds at 31 December<strong>2012</strong>.<strong>STANLIB</strong> Multi-Manager Global Bond FundMoody’srating% of debtsecuritiesMoody’srating% of debtsecuritiesAaa 49.93% A3 3.89%Aa1 8.84% Baa1 7.13%Aa2 1.37% Baa2 6.20%Aa3 10.29% Baa3 3.10%A1 1.79% Other 2.28%A2 5.18% 100.00%<strong>STANLIB</strong> Global Bond FundMoody'srating% of debtsecuritiesMoody'srating% of debtsecuritiesAaa 40.07% Baa1 9.59%Aa1 15.12% Baa2 10.37%Aa3 5.18% Baa3 2.08%A1 1.99% Ba1 1.42%A2 8.29% Other 0.56%A3 5.33% 100.00%Foreign currency riskThe value of assets held by the Class <strong>Funds</strong> is reported in USDollars although the underlying assets are denominated in awide range of currencies. Movements in the relative values ofthese currencies can cause volatility in the reported US Dollarvalues. Although this exposure is not routinely hedged periodicpositions in currencies are created through the use of currencyderivatives where the investment managers believe that it is inthe interest of the Class <strong>Funds</strong>.Details of forward foreign exchange contracts outstanding atthe year-end are detailed in Note 12. Realised foreign exchangegains and losses made during the year are disclosed in theStatement of Total Return for each Class Fund and unrealisedmovements are disclosed in Note 3.22
<strong>STANLIB</strong> <strong>Funds</strong> <strong>Limited</strong>Notes to the Financial Statement (continued)11.Financial instruments and associated risks (continued)Foreign currency risk (continued)Foreign currency monetary assets and liabilitiesThe following tables show the currency exposure for each Class Fund as at 31 December <strong>2012</strong> and 31 December 2011. As part ofthe risk analysis the tables show the estimated change in the market value of investments given a 5% movement in the underlyingcurrency against the base currency of the Class Fund.Global Property Fund31 December <strong>2012</strong> (Values in USD) 31 December 2011 (Values in USD)Currency Market value 5% movement Market value 5% movementAustralian Dollar 8,229,217 411,461 3,747,341 187,366British Pound 4,551,006 227,550 2,290,926 114,546Canadian Dollar 5,313,153 265,658 651,812 32,591Euro 4,805,554 240,278 3,160,283 158,014Hong Kong Dollar 4,448,423 222,421 400,071 20,004Japanese Yen 3,665,704 183,285 1,348,202 67,410Singapore Dollar 3,212,730 160,637 1,585,661 79,283South African Rand 2,024,000 101,200 13 1Swiss Franc 956,733 47,837 166,159 8,308US Dollar 41,475,522 – 20,207,056 –Other Currency* 402,499 20,125 – –<strong>STANLIB</strong> Multi-Manager Global Bond Fund79,084,541 1,880,452 33,557,524 667,52431 December <strong>2012</strong> (Values in USD) 31 December 2011 (Values in USD)Currency Market value 5% movement Market value 5% movementAustralian Dollar 6,075,425 303,771 1,507,392 75,370British Pound 37,555,199 1,877,760 29,765,911 1,488,296Canadian Dollar 9,864,701 493,235 9,225,380 461,269Euro 95,475,890 4,773,795 46,919,529 2,345,976Japanese Yen 55,764,679 2,788,234 54,780,132 2,739,007Malaysian Ringgit 7,177,761 358,888 5,578,351 278,918Mexican Peso 12,267,113 613,356 6,821,488 341,074Polish Zloty 17,096,284 854,814 6,657,823 332,891South African Rand 5,682,324 284,116 4,129,991 206,500Swedish Krona 7,897,887 394,894 2,754,872 137,744US Dollar 242,261,109 – 159,616,547 –Other Currency* 37,025,248 1,851,262 30,896,024 1,544,801534,143,620 14,594,125 358,653,440 9,951,846* Other Currency includes a number of currencies, none of which is greater than 1% of the net assets of the Class Fund.23
<strong>STANLIB</strong> <strong>Funds</strong> <strong>Limited</strong>Notes to the Financial Statement (continued)11.Financial instruments and associated risks (continued)Foreign currency risk (continued)Foreign currency monetary assets and liabilities (continued)<strong>STANLIB</strong> Multi-Manager Global Equity Fund31 December <strong>2012</strong> (Values in USD) 31 December 2011 (Values in USD)Currency Market value 5% movement Market value 5% movementAustralian Dollar 33,228,377 1,661,419 33,473,421 1,673,671British Pound 155,025,743 7,751,287 158,648,667 7,932,433Canadian Dollar 48,784,661 2,439,233 39,976,198 1,998,810Euro 111,126,936 5,556,347 107,835,454 5,391,773Hong Kong Dollar 66,905,299 3,345,265 43,764,836 2,188,242Japanese Yen 95,738,946 4,786,947 69,804,042 3,490,202Singapore Dollar 16,887,343 844,367 6,088,364 304,418South African Rand 18,102,505 905,125 17,204,656 860,233Swedish Krona 32,980,846 1,649,042 17,354,703 867,735Swiss Franc 78,441,432 3,922,072 62,892,645 3,144,632US Dollar 720,843,971 – 715,124,625 –Other Currency* 106,679,093 5,333,955 95,720,622 4,786,0311,484,745,152 38,195,059 1,367,888,233 32,638,180High Alpha Global Equity Fund31 December <strong>2012</strong> (Values in USD) 31 December 2011 (Values in USD)Currency Market value 5% movement Market value 5% movementBritish Pound 81,794,783 4,089,739 28,364,467 1,418,223Canadian Dollar 11,640,924 582,046 14,563,975 728,199Euro 37,325,462 1,866,273 30,218,040 1,510,902Hong Kong Dollar 15,188,470 759,424 18,297,950 914,898Japanese Yen 50,168,460 2,508,423 88,049,319 4,402,466Swiss Franc 39,492,853 1,974,643 10,184,484 509,224US Dollar 414,587,445 – 488,341,084 –Other Currency* 38,902,357 1,945,118 75,823,650 3,791,183689,100,754 13,725,666 753,842,969 13,275,09524
<strong>STANLIB</strong> <strong>Funds</strong> <strong>Limited</strong>Notes to the Financial Statement (continued)11.Financial instruments and associated risks (continued)Foreign currency risk (continued)Foreign currency monetary assets and liabilities (continued)<strong>STANLIB</strong> Global Bond Fund31 December <strong>2012</strong> (Values in USD) 31 December 2011 (Values in USD)Currency Market value 5% movement Market value 5% movementBrazilian Real 1,396,710 69,836 195,270 9,764British Pound 11,677,709 583,885 10,967,448 548,372Chilean Peso 2,840,304 142,015 1,753,670 87,684Euro 4,645,106 232,255 – –Hungarian Forint 1,156,936 57,847 811,783 40,589Indian Rupee 911,302 45,565 – –Malaysian Ringgit 3,837,827 191,891 2,982,495 149,125Mexican Peso 1,878,126 93,906 2,721,406 136,070Polish Zloty 5,719,300 285,965 3,519,605 175,980South African Rand 3,215,195 160,760 2,557,750 127,888Turkish Lira 1,558,294 77,915 1,545,317 77,266US Dollar 38,482,392 – 33,783,558 –Other Currency* 4,517,478 225,874 12,338,440 616,92281,836,679 2,167,714 73,176,742 1,969,660* Other Currency includes a number of currencies, none of which is greater than 1% of the net assets of the Class Fund.<strong>STANLIB</strong> Global Emerging Markets Fund**31 December <strong>2012</strong> (Values in USD) 31 December 2011 (Values in USD)Currency Market value 5% movement Market value 5% movementBrazilian Real 4,824,241 241,212 – –Hong Kong Dollar 14,627,109 731,355 – –Indonesian Rupiah 2,167,019 108,351 – –Mexican Peso 3,592,461 179,623 – –Philippine Peso 3,151,783 157,589 – –Singapore Dollar 1,368,923 68,446 – –South African Rand 3,174,464 158,723 – –South Korean Won 12,261,427 613,071 – –Taiwanese Dollar 11,556,939 577,847 – –Thai Baht 5,125,872 256,294 – –Turkish Lira 4,282,907 214,145 – –US Dollar 33,127,492 – – –Other Currency* 4,088,295 204,415 – –103,348,932 3,511,071 – –* Other Currency includes a number of currencies, none of which is greater than 1% of the net assets of the Class Fund.** Class Fund launched on 6 December <strong>2012</strong>25
<strong>STANLIB</strong> <strong>Funds</strong> <strong>Limited</strong>Notes to the Financial Statement (continued)11.Financial instruments and associated risks (continued)Liquidity riskLiquidity risk in relation to funding of redemptions is managed by receiving daily notifications of forthcoming redemption noticesand ensuring sufficient liquidity within the portfolio. In the prior year investments were split into six different categories dependingon the maturity date of the fixed income securities. Securities with no maturity date were classified separately. The current yearpresentation uses two categories. This is appropriate from a liquidity perspective as it is the intention of the Investment Manager tohold liquid securities traded in active markets and the securities held are valued as such. As these are highly liquid they can be tradedin less than 3 months.Global Property Fund31 December <strong>2012</strong> 31 December 2011Less than 3months3 months to 1yearLess than 3monthsUSD USD USD USDInvestments 76,693,454 – 32,420,444 –Cash and bank balances 2,885,783 – 1,328,592 –Other assets 998,182 – 196,248 –Total assets 80,577,419 – 33,945,284 –Bank overdraft – – (263,212) –Other liabilities (1,492,878) – (124,548) –Net assets attributable to holders of redeemable participating shares (79,084,541) – (33,557,524) –Total liabilities (80,577,419) – (33,945,284) –3 months to 1year<strong>STANLIB</strong> Multi-Manager Global Bond Fund31 December <strong>2012</strong> 31 December 2011Less than 3months3 months to 1yearLess than 3monthsUSD USD USD USDInvestments 513,431,063 – 346,625,066 –Cash and bank balances 51,686,036 – 28,456,505 –Unrealised gain of forwards foreign currency contracts 408,461 – 1,070,263 –Other assets 11,107,720 – 6,302,035 –Total assets 576,633,280 – 382,453,869 –Bank overdraft (840,447) – – –Unrealised loss on forward foreign currency contracts (938,801) – (1,428,952) –Other liabilities (40,710,412) – (22,371,477) –Net assets attributable to holders of redeemable participating shares (534,143,620) – (358,653,440)Total liabilities (576,633,280) – (382,453,869)3 months to 1year26
<strong>STANLIB</strong> <strong>Funds</strong> <strong>Limited</strong>Notes to the Financial Statement (continued)11.Financial instruments and associated risks (continued)Liquidity risk (continued)<strong>STANLIB</strong> Multi-Manager Global Equity Fund31 December <strong>2012</strong> 31 December 2011Less than 3months3 months to 1yearLess than 3monthsUSD USD USD USDInvestments 1,431,042,898 – 1,289,675,585 –Cash and bank balances 57,615,632 – 77,678,111 –Unrealised gain of forwards foreign currency contracts – – 22,358 –Unrealised gain on futures contracts 18,239 – 147,012 –Other assets 2,024,624 – 4,177,439 –Total assets 1,490,701,393 – 1,371,700,505 –Bank overdraft (212,442) – (60,962) –Unrealised loss on forward foreign currency contracts (2,154) – (6,803) –Other liabilities (5,741,745) – (3,744,407) –Net assets attributable to holders of redeemable participating shares (1,484,745,052) – (1,367,888,233) –Total liabilities (1,490,701,393) – (1,371,700,405) –3 months to 1yearHigh Alpha Global Equity Fund31 December <strong>2012</strong> 31 December 2011Less than 3months3 months to 1yearLess than 3monthsUSD USD USD USDInvestments 682,386,282 – 748,591,763 –Cash and bank balances 8,169,451 – 6,065,078 –Other assets 826,155 – 1,066,765 –Total assets 691,381,888 – 755,723,606 –Other liabilities (2,281,134) – (1,880,637) –Net assets attributable to holders of redeemable participating shares (689,100,754) – (753,842,969) –Total liabilities (691,381,888) – (755,723,606) –3 months to 1year<strong>STANLIB</strong> Global Bond Fund31 December <strong>2012</strong> 31 December 2011Less than 3months3 months to 1yearLess than 3monthsUSD USD USD USDInvestments 77,823,590 – 64,935,773 –Cash and bank balances 3,456,216 – 8,141,073 –Unrealised gain of forwards foreign currency contracts 135,714 – 237,028 –Other assets 962,555 – 1,170,654 –Total assets 82,378,075 – 74,484,528 –Bank overdraft (55,748) – – –Unrealised loss on forward foreign currency contracts (242,941) – (908,302) –Other liabilities (242,707) – (399,484) –Net assets attributable to holders of redeemable participating shares (81,836,679) – (73,176,742) –Total liabilities (82,378,075) – (74,484,528) –3 months to 1year27
<strong>STANLIB</strong> <strong>Funds</strong> <strong>Limited</strong>Notes to the Financial Statement (continued)11.Financial instruments and associated risks (continued)Liquidity risk (continued)<strong>STANLIB</strong> Global Emerging Markets Fund*31 December <strong>2012</strong> 31 December 2011Less than 3months3 months to 1yearLess than 3monthsUSD USD USD USDInvestments 98,841,435 – – –Cash and bank balances 4,735,293 – – –Other assets 266,698 – – –Total assets 103,843,426 – – –Other liabilities (494,494) – – –Net assets attributable to holders of redeemable participating shares (103,348,932) – – –Total liabilities (103,843,426) – – –3 months to 1year* Class Fund launched on 6 December <strong>2012</strong>Interest rate riskFor Global Property Fund, <strong>STANLIB</strong> Multi-Manager Global Equity Fund, High Alpha Global Equity Fund and <strong>STANLIB</strong> Global EmergingMarkets Fund the majority of the Class <strong>Funds</strong>’ assets are equity shares and other investments which neither pay interest nor have amaturity date.Within these Classes there are small holdings of interest bearing assets as disclosed in their respective portfolios. In the opinion of theDirectors there would be no benefit in disclosing in the note below the interest rate profiles thereof.The interest rate and currency profiles of the <strong>STANLIB</strong> Multi-Manager Global Bond Fund’s financial assets at 31 December <strong>2012</strong> and 31December 2011 are disclosed in the following tables:<strong>STANLIB</strong> Multi-Manager Global Bond Fund31 December <strong>2012</strong> 31 December 2011TotalInterestbearingNon-InterestbearingTotalInterestbearingUSD USD USD USD USD USDNon-InterestbearingInvestments 513,431,063 480,758,702 32,672,361 346,625,066 322,350,917 24,274,149Unrealised gain of forwardforeign currency contracts408,461 – 408,461 1,070,263 – 1,070,263Cash and bank balances 51,686,036 51,686,036 – 28,456,505 28,456,505 –Other assets 11,107,720 – 11,107,720 6,302,035 – 6,302,035Assets 576,633,280 532,444,738 44,188,542 382,453,869 350,807,422 31,646,447Bank overdraft (840,447) (840,447) – – – –Unrealised loss of forwardforeign currency contracts(938,801) – (938,801) (1,428,952) – (1,428,952)Other liabilities (40,710,412) – (40,710,412) (22,371,477) – (22,371,477)Liabilities (42,489,660) (840,447) (41,649,213) (23,800,429) – (23,800,429)Net interest bearingassets531,604,291 350,807,42228
<strong>STANLIB</strong> <strong>Funds</strong> <strong>Limited</strong>Notes to the Financial Statement (continued)11.Financial instruments and associated risks (continued)Interest rate risk (continued)<strong>STANLIB</strong> Multi-Manager Global Bond Fund (continued)31 December <strong>2012</strong> 31 December 2011Weighted averagecoupon %Weighted averagematurityWeighted averagecoupon %Weighted averagematurityAustralian Dollar 5.63 5 years 1 month 6.04 5 years 5 monthsBrazilian Real 10.58 6 years 2 months 10.97 5 years 8 monthsBritish Pound 4.22 8 years 9 months 4.46 10 years 4 monthsCanadian Dollar 3.84 8 years 5 months 4.45 8 years 4 monthsChilean Peso 5.50 7 years 7 months – –Czech Koruna 4.21 4 years 8 months – –Danish Krone 3.59 6 years 3 months 3.98 10 years 1 monthEuro 3.14 7 years 9 months 4.24 7 years 10 monthsHungarian Forint 5.73 3 years 3 months 5.50 3 years 4 monthsIndonesian Rupiah 10.85 7 years 0 months 10.34 10 years 7 monthsIsraeli Shekel 5.67 4 years 9 months – –Japanese Yen 1.73 8 years 9 months 1.68 8 years 9 monthsMalaysian Ringgit 3.8 1 years 6 months 3.94 1 year 4 monthsMexican Peso 8.45 10 years 6 months 8.51 11 years 1 monthNew Zealand Dollar 5.44 8 years 0 months 5.71 7 years 1 monthNorwegian Krona 4.42 5 years 8 months 6.44 1 year 7 monthsPolish Zloty 5.53 7 years 3 months 5.56 8 years 6 monthsRussian Rubles 7.68 5 years 2 months – –Singapore Dollar 3.33 5 years 5 months 3.31 6 years 5 monthsSouth African Rand 6.89 13 years 2 months 6.90 12 years 10 monthsSouth Korean Won 4.87 4 years 7 months 4.86 4 years 9 monthsSwedish Krona 3.99 5 years 11 months 5.73 3 yearsSwiss Franc 3.82 9 years 9 months 2.38 7 years 11 monthsThai Baht 4.51 6 years 8 months – –US Dollar 1.58 8 years 2 months 4.83 17 years 2 monthsThe interest rate and currency profiles of the <strong>STANLIB</strong> Global Bond Fund’s financial assets at 31 December <strong>2012</strong> and 31 December2011 are disclosed in the following tables:29
<strong>STANLIB</strong> <strong>Funds</strong> <strong>Limited</strong>Notes to the Financial Statement (continued)11.Financial instruments and associated risks (continued)Interest rate risk (continued)<strong>STANLIB</strong> Global Bond Fund31 December <strong>2012</strong> 31 December 2011TotalInterestbearingNon-InterestbearingTotalInterestbearingUSD USD USD USD USD USDInvestments 77,823,590 77,823,590 – 64,935,773 64,935,773 –Unrealised gain of forwardforeign currency contractsNon-Interestbearing135,714 – 135,714 237,028 – 237,028Cash and bank balances 3,456,216 3,456,216 – 8,141,073 8,141,073 –Other assets 962,555 – 962,555 1,170,654 – 1,170,654Assets 82,378,075 81,279,806 1,098,269 74,484,528 73,076,846 1,407,682Bank overdraft (55,748) (55,748) – – – –Unrealised loss of forwardforeign currency contracts(242,941) – (242,941) (908,302) – (908,302)Other liabilities (242,707) – (242,707) (399,484) – (399,484)Liabilities (541,396) (55,748) (485,648) (1,307,786) – (1,307,786)Net interest bearingassets81,224,058 73,076,84631 December <strong>2012</strong> 31 December 2011Weighted averagecoupon %Weighted averagematurityWeighted averagecoupon %Weighted averagematurityAustralian Dollar 6.17 5 years 7 months 6.06 5 years 11 monthsBrazilian Real 10 4 years 0 months 10 5 years 1 monthBritish Pound 4.5 0 years 2 months 4.5 1 year 2 monthsCanadian Dollar – – 2 8 monthsEuro 5 26 years 7 months – –Hungarian Forint 5.5 3 years 1 months 5.5 4 years 2 monthsIndonesian Rupiah – – 10 12 years 11 monthsMalaysian Ringgit 4.95 1 years 4 months 5.09 2 years 4 monthsMexican Peso 8.5 16 years 5 months 8.5 17 years 8 monthsNew Zealand Dollar 5.56 10 years 0 months 5.56 11 years 3 monthsNorwegian Krona – – 6.5 1 year 5 monthsPolish Zloty 5.59 9 years 1 months 5.58 10 years 3 monthsSouth African Rand 6.68 13 years 10 months 6.67 15 years 9 monthsSouth Korean Won 5.34 4 years 11 months 4.65 4 years 10 monthsUS Dollar 2.53 11 years 2 months 4.97 24 years 1 month30
<strong>STANLIB</strong> <strong>Funds</strong> <strong>Limited</strong>Notes to the Financial Statement (continued)11.Financial instruments and associated risks (continued)Interest rate risk (continued)Interest rate sensitivityThe Class <strong>Funds</strong> manage interest rate risk by ensuring that not less than 90% of investments in interest bearing securities are ratedinvestment grade by either Moody’s, Standard and Poor’s or Fitch. An increase of 100 basis points in interest rates as at the reporting datewould have decreased the net assets attributable to holders of redeemable participating shares for each Class Fund by approximately:As at 31 December <strong>2012</strong> As at 31 December 2011Class Fund Decrease Decrease<strong>STANLIB</strong> Multi-Manager Global Bond Fund 5,295,054 3,508,074<strong>STANLIB</strong> Global Bond Fund 813,171 730,768USDUSDA decrease of 100 basis points would have had an equal but opposite effect.The currency and interest rate profiles of cash and bank balances (net of bank overdrafts) held at year-end which did not have a fixedmaturity date, by each of the Class <strong>Funds</strong>, is disclosed in the Balance Sheet. Short-term debtors and creditors have been excludedfrom the disclosures of financial instruments.12.Derivative financial instrumentsForward foreign exchange contractsThe Company has entered into forward foreign exchange contracts to hedge non-functional currency investments held at fair valueand for trading purposes. The fair value of open forward foreign exchange contracts at 31 December <strong>2012</strong> and 31 December 2011 isbooked in the Balance Sheet under “Unrealised gain on forward foreign currency contracts” or “Unrealised loss on forward foreigncurrency contracts”.As at 31 December <strong>2012</strong>, the Company had the following open forward foreign exchange contracts:<strong>STANLIB</strong> Multi-Manager Global Bond FundMaturity date Purchase Currency Amount Sell Currency AmountUnrealised gain on forward currency contracts14/03/2013 USD (240,173) CHF 220,000 50812/02/2013 USD (1,138,144) CLP 552,000,000 7,87412/02/2013 USD (2,744,403) CLP 1,326,370,000 9,30015/05/2013 USD (831,310) CLP 412,330,000 14,28914/03/2013 USD (212,078) DKK 1,200,000 23317/01/2013 USD (400,000) EUR 306,110 3,63514/03/2013 USD (4,775,359) EUR 3,624,000 5,62105/02/2013 USD (439,259) EUR 339,000 7,82210/01/2013 USD (1,150,000) EUR 879,561 9,70810/01/2013 USD (1,000,000) EUR 766,301 10,37410/01/2013 USD (1,400,000) EUR 1,073,011 14,77217/01/2013 USD (2,100,000) EUR 1,606,217 17,94805/02/2013 USD (1,392,486) EUR 1,073,000 22,61224/01/2013 USD (1,767,538) EUR 1,360,000 25,86907/01/2013 USD (227,976) GBP 143,000 4,46612/03/2013 USD (8,630,676) GBP 5,364,000 86,567Unrealised gainUSD31
<strong>STANLIB</strong> <strong>Funds</strong> <strong>Limited</strong>Notes to the Financial Statement (continued)12.Derivative financial instruments (continued)Forward foreign exchange contracts (continued)<strong>STANLIB</strong> Multi-Manager Global Bond Fund (continued)Maturity date Purchase Currency Amount Sell Currency AmountUnrealised gain on forward currency contracts21/03/2013 USD (1,018,136) INR 56,700,000 1,01215/01/2013 USD (274,118) KRW 300,000,000 6,37829/01/2013 USD (1,075,763) KRW 1,170,000,000 19,15810/01/2013 AUD (350,000) USD 365,925 2,84514/03/2013 AUD (1,240,000) USD 1,298,692 18,24114/03/2013 CAD (3,135,000) USD 3,179,336 35,68424/01/2013 MXN (3,900,000) USD 300,050 44615/01/2013 MYR (1,600,000) USD 523,646 54614/03/2013 NZD (280,000) USD 235,087 5,16514/01/2013 NZD (430,000) USD 361,347 6,93013/03/2013 NZD (5,355,000) USD 4,462,268 64,74025/01/2013 PLN (750,000) USD 242,107 46014/03/2013 SGD (440,000) USD 360,752 56114/03/2013 USD (462,065) ZAR 4,000,000 4,697Total unrealised gain on forward currency contracts 408,461Unrealised gainUSDMaturity date Purchase Currency Amount Sell Currency AmountUnrealised loss on forward currency contracts25/01/2013 USD (332,544) AUD 320,000 -98014/03/2013 USD (309,930) AUD 300,000 -14305/02/2013 USD (826,706) CAD 815,000 (8,820)17/01/2013 USD (950,000) EUR 715,475 (6,579)21/03/2013 USD (325,988) INR 17,900,000 (4,246)17/01/2013 EUR (700,000) JPY 77,074,900 (31,488)17/01/2013 EUR (275,000) JPY 30,322,902 (11,867)07/02/2013 USD (5,176,688) JPY 434,746,000 ( 147,117 )Unrealised gainUSD17/01/2013 USD (2,900,000) JPY 241,860,000 (102,398)17/01/2013 USD (1,850,000) JPY 154,382,500 (64,253)10/01/2013 USD (1,150,000) JPY 94,645,000 (55,303)14/03/2013 USD (905,247) JPY 75,750,000 (28,654)14/03/2013 USD (905,115) JPY 75,750,000 (28,522)14/03/2013 USD (905,104) JPY 75,750,000 (28,511)14/03/2013 USD (904,790) JPY 75,750,000 (28,196)17/01/2013 USD (361,612) JPY 30,266,175 (11,522)28/01/2013 USD (480,660) JPY 41,362,697 (2,172)14/03/2013 USD (810,176) JPY 70,000,000 -12208/01/2013 USD (520,532) JPY 45,000,000 -5514/03/2013 USD (1,448,661) MXN 18,610,000 (25,320)14/03/2013 USD (114,777) MXN 1,500,000 -5314/03/2013 USD (153,527) SEK 1,000,000 -6732
<strong>STANLIB</strong> <strong>Funds</strong> <strong>Limited</strong>Notes to the Financial Statement (continued)12.Derivative financial instruments (continued)Forward foreign exchange contracts (continued)<strong>STANLIB</strong> Multi-Manager Global Bond Fund (continued)Maturity date Purchase Currency Amount Sell Currency AmountUnrealised loss on forward currency contracts07/02/2013 USD (623,853) SGD 760,000 (1,706)11/03/2013 USD (2,841,199) TRY 5,117,000 -452Unrealised gainUSD11/02/2013 AUD (10,846,000) USD 10,970,512 (253,673)11/02/2013 AUD (3,425,000) USD 3,532,733 (11,692)14/03/2013 CZK (5,500,000) USD 287,344 (1,806)14/03/2013 EUR (1,600,000) USD 2,110,352 -45610/01/2013 GBP (390,000) USD 629,031 (4,896)14/03/2013 GBP (220,000) USD 356,286 (1,242)14/03/2013 GBP (200,000) USD 324,984 -4114/03/2013 ILS (1,280,000) USD 337,784 (4,494)15/01/2013 KRW (1,770,000,000) USD 1,596,752 (58,174)15/01/2013 KRW (123,000,000) USD 112,293 (2,710)14/03/2013 NOK (940,000) USD 167,235 (1,220)25/01/2013 PLN (930,000) USD 292,186 ( 7,456)14/03/2013 PLN (70,000) USD 22,342 -11114/03/2013 SEK (700,000) USD 105,138 (2,284)Total unrealised loss on forward currency contracts (938,801)<strong>STANLIB</strong> Multi-Manager Global Equity FundMaturity date Purchase Currency Amount Sell Currency AmountUnrealised loss on forward currency contracts22/01/2013 EUR (1,255,000) USD 1,652,760 (2,154)Total unrealised loss on forward currency contracts (2,154)Unrealised gainUSD<strong>STANLIB</strong> Global Bond FundMaturity date Purchase Currency Amount Sell Currency AmountUnrealised gain on forward currency contracts12/02/2013 USD (193,196) CLP 93,700,000 1,33712/02/2013 USD (2,133,251) CLP 1,031,000,000 7,22915/05/2013 USD (496,754) CLP 246,390,000 8,53805/02/2013 USD (1,763,642) EUR 1,359,000 28,63912/03/2013 USD (5,164,890) GBP 3,210,000 51,80621/03/2013 USD (910,397) INR 50,700,000 90513/03/2013 NZD (3,082,000) USD 2,568,200 37,260Total unrealised gain on forward currency contracts 135,714Unrealised gain/(loss)USD33
<strong>STANLIB</strong> <strong>Funds</strong> <strong>Limited</strong>Notes to the Financial Statement (continued)12.Derivative financial instruments (continued)Forward foreign exchange contracts (continued)<strong>STANLIB</strong> Global Bond Fund (continued)Maturity date Purchase Currency Amount Sell Currency AmountUnrealised loss on forward currency contracts03/11/2013 USD (1,606,885) TRY 2,894,000 (48,591)Unrealised gain/(loss)USD11/02/2013 AUD (8,268,000) USD 8,362,917 (193,377)12/02/2013 AUD (291,000) USD 300,153 (973)Total unrealised loss on forward currency contracts (242,941)<strong>STANLIB</strong> Multi-Manager Global Equity FundMaturity date Purchase Currency Amount Sell Currency AmountUnrealised gain on forward currency contracts06/01/<strong>2012</strong> USD 851,000 EUR 638,299 22,358Total unrealised gain on forward currency contracts 22,358Unrealised gainUSDMaturity date Purchase Currency Amount Sell Currency Amount Unrealised lossUSDUnrealised loss on forward currency contracts06/01/<strong>2012</strong> EUR 638,299 USD 835,445 (6,803)Total unrealised loss on forward currency contracts (6,803)<strong>STANLIB</strong> Multi-Manager Global Bond FundMaturity date Purchase Currency Amount Sell Currency AmountUnrealised gain on forward currency contracts06/01/<strong>2012</strong> JPY 279,180,000 EUR 2,700,000 123,78506/01/<strong>2012</strong> USD 450,000 EUR 345,612 1,32606/01/<strong>2012</strong> JPY 7,788,700 USD 100,000 1,24209/01/<strong>2012</strong> USD 6,216,925 EUR 4,625,000 212,62710/01/<strong>2012</strong> JPY 155,850,000 USD 2,000,000 25,94510/01/<strong>2012</strong> AUD 35,000 USD 35,149 68611/01/<strong>2012</strong> USD 4,791,267 NOK 28,245,000 60,40711/01/<strong>2012</strong> CNY 15,969,000 USD 2,504,548 31,85211/01/<strong>2012</strong> CNY 1,897,000 USD 296,592 4,71412/01/<strong>2012</strong> USD 2,202,607 EUR 1,647,000 64,38812/01/<strong>2012</strong> USD 292,911 EUR 222,000 4,70013/01/<strong>2012</strong> AUD 3,400,000 USD 3,343,006 136,79213/01/<strong>2012</strong> JPY 649,630,000 USD 8,350,000 95,14213/01/<strong>2012</strong> CNY 14,867,000 USD 2,314,650 46,59513/01/<strong>2012</strong> CNY 1,826,000 USD 283,320 6,69317/01/<strong>2012</strong> USD 650,431 MXN 8,899,000 13,76717/01/<strong>2012</strong> USD 339,591 GBP 218,000 85319/01/<strong>2012</strong> USD 363,226 EUR 261,000 24,36719/01/<strong>2012</strong> USD 302,577 EUR 217,500 20,19519/01/<strong>2012</strong> USD 302,542 EUR 217,500 20,160Unrealised gainUSD34
<strong>STANLIB</strong> <strong>Funds</strong> <strong>Limited</strong>Notes to the Financial Statement (continued)12.Derivative financial instruments (continued)Forward foreign exchange contracts (continued)<strong>STANLIB</strong> Multi-Manager Global Bond Fund (continued)Maturity date Purchase Currency Amount Sell Currency AmountUnrealised gain on forward currency contracts19/01/<strong>2012</strong> USD 242,078 EUR 174,000 16,17319/01/<strong>2012</strong> USD 246,672 JPY 18,700,000 3,55119/01/<strong>2012</strong> USD 112,119 JPY 8,500,000 1,61019/01/<strong>2012</strong> USD 40,404 EUR 30,000 1,45519/01/<strong>2012</strong> USD 89,663 JPY 6,800,000 1,25519/01/<strong>2012</strong> JPY 11,000,000 USD 141,803 1,20919/01/<strong>2012</strong> USD 85,207 HUF 20,700,000 719/01/<strong>2012</strong> EUR 50,000 USD 64,915 -23/01/<strong>2012</strong> JPY 231,234,000 USD 2,972,484 34,00102/02/<strong>2012</strong> USD 1,486,169 BRL 2,595,000 105,04602/02/<strong>2012</strong> USD 1,060,331 BRL 1,986,000 3,33315/02/<strong>2012</strong> CAD 3,914,000 USD 3,839,137 64501/03/<strong>2012</strong> GBP 4,878,000 USD 7,570,656 5,742Unrealised gainUSDTotal unrealised gain on forward currency contracts 1,070,263Maturity date Purchase Currency Amount Sell Currency AmountUnrealised loss on forward currency contracts05/01/<strong>2012</strong> USD 1,314,823 SEK 9,125,000 (15,831)06/01/<strong>2012</strong> USD 1,087,022 AUD 1,075,000 (14,136)Unrealised lossUSD06/01/<strong>2012</strong> USD 1,063,111 AUD 1,075,000 (38,048)06/01/<strong>2012</strong> EUR 2,542,113 USD 3,400,000 (99,824)10/01/<strong>2012</strong> USD 50,991 AUD 50,000 (201)11/01/<strong>2012</strong> NOK 5,665,000 USD 986,247 (37,395)12/01/<strong>2012</strong> EUR 274,000 USD 356,701 (981)12/01/<strong>2012</strong> EUR 660,000 USD 860,574 (3,728)12/01/<strong>2012</strong> INR 31,553,000 USD 602,501 (10,000)13/01/<strong>2012</strong> USD 1,307,142 CNY 8,318,000 (13,961)13/01/<strong>2012</strong> USD 2,650,000 JPY 206,032,200 (28,403)13/01/<strong>2012</strong> USD 12,076,256 AUD 12,640,000 (860,402)17/01/<strong>2012</strong> GBP 388,000 USD 606,514 (3,622)19/01/<strong>2012</strong> USD 25,999 JPY 2,000,000 (4)19/01/<strong>2012</strong> USD 155,982 JPY 12,000,000 (32)19/01/<strong>2012</strong> HUF 4,140,000 USD 19,193 (2,153)19/01/<strong>2012</strong> HUF 5,175,000 USD 23,941 (2,641)19/01/<strong>2012</strong> HUF 5,175,000 USD 23,946 (2,646)19/01/<strong>2012</strong> HUF 6,210,000 USD 28,875 (3,315)19/01/<strong>2012</strong> PLN 186,000 USD 58,730 (4,669)19/01/<strong>2012</strong> PLN 232,500 USD 73,431 (5,854)19/01/<strong>2012</strong> CHF 132,000 USD 150,349 (9,143)19/01/<strong>2012</strong> CHF 165,000 USD 187,831 (11,323)19/01/<strong>2012</strong> CHF 165,000 USD 187,849 (11,342)35
<strong>STANLIB</strong> <strong>Funds</strong> <strong>Limited</strong>Notes to the Financial Statement (continued)12.Derivative financial instruments (continued)Forward foreign exchange contracts (continued)<strong>STANLIB</strong> Multi-Manager Global Bond Fund (continued)Maturity date Purchase Currency Amount Sell Currency AmountUnrealised loss on forward currency contracts19/01/<strong>2012</strong> CZK 2,600,000 USD 145,289 (12,926)19/01/<strong>2012</strong> PLN 511,500 USD 161,826 (13,157)19/01/<strong>2012</strong> CHF 198,000 USD 225,588 (13,779)23/01/<strong>2012</strong> USD 365,668 PLN 1,270,000 (3,322)23/01/<strong>2012</strong> USD 339,884 JPY 26,460,000 (4,146)25/01/<strong>2012</strong> KRW 312,818,000 USD 275,939 (4,899)26/01/<strong>2012</strong> CLP 473,350,000 USD 922,512 (14,942)Unrealised lossUSD26/01/<strong>2012</strong> CLP 853,020,000 USD 1,674,427 (38,903)10/02/<strong>2012</strong> TRY 4,196,000 USD 2,309,390 (109,882)14/02/<strong>2012</strong> MYR 650,000 USD 204,841 (342)14/02/<strong>2012</strong> USD 395,909 TWD 12,000,000 (746)14/02/<strong>2012</strong> TWD 12,000,000 USD 398,208 (1,553)14/02/<strong>2012</strong> KRW 1,190,000,000 USD 1,045,235 (15,132)23/02/<strong>2012</strong> SGD 3,990,000 USD 3,087,041 (10,201)09/03/<strong>2012</strong> USD 2,906,250 NZD 3,750,000 (5,368)Total unrealised loss on forward currency contracts (1,428,952)<strong>STANLIB</strong> Global Bond FundMaturity date Purchase Currency Amount Sell Currency AmountUnrealised gain on forward currency contracts11/01/<strong>2012</strong> CNY 12,004,000 USD 1,882,685 23,94311/01/<strong>2012</strong> USD 3,796,373 NOK 22,380,000 47,86413/01/<strong>2012</strong> CNY 2,054,000 USD 321,264 4,96213/01/<strong>2012</strong> CNY 11,678,000 USD 1,818,154 36,60002/02/<strong>2012</strong> USD 1,692,916 BRL 2,956,000 119,66001/03/<strong>2012</strong> GBP 3,397,000 USD 5,272,144 3,999Total unrealised gain on forward currency contracts 237,028Unrealised gainUSDMaturity date Purchase Currency Amount Sell Currency AmountUnrealised loss on forward currency contractsUnrealised lossUSD11/01/<strong>2012</strong> NOK 6,567,000 USD 1,184,481 (84,550)13/01/<strong>2012</strong> USD 9,118,338 AUD 9,544,000 (649,658)13/01/<strong>2012</strong> AUD 2,994,000 USD 3,098,464 (34,195)13/01/<strong>2012</strong> USD 1,184,528 CNY 7,549,000 (14,439)26/01/<strong>2012</strong> CLP 588,220,000 USD 1,154,640 (26,827)26/01/<strong>2012</strong> CLP 326,420,000 USD 636,160 (10,304)10/02/<strong>2012</strong> TRY 2,948,000 USD 1,622,517 ( 77,201)23/02/<strong>2012</strong> SGD 2,812,000 USD 2,175,629 ( 7,189)09/03/<strong>2012</strong> USD 2,132,800 NZD 2,752,000 (3,939)Total unrealised loss on forward currency contracts (908,302)36
<strong>STANLIB</strong> <strong>Funds</strong> <strong>Limited</strong>Notes to the Financial Statements (continued)12.Derivative financial instruments (continued)Futures contractsThe fair value of open futures contracts at 31 December <strong>2012</strong> and 31 December 2011 is booked in the Balance Sheet under “Unrealisedgain on futures contracts” or “Unrealised loss on futures contracts”.As at 31 December <strong>2012</strong>, the Company had the following open futures contracts:<strong>STANLIB</strong> Multi-Manager Global Equity FundDescriptionMaturity dateNumber ofContractsCost USDMarket ValueUSDS&P 500 E-mini Future 15/03/2013 15 1,062,857 1,065,000 2,143Topix Index Future 07/03/2013 2 190,619 199,271 16,446Euro Stoxx 50 Future 15/03/2013 7 240,329 241,330 593FTSE 100 Index Future 15/03/2013 3 285,409 285,178 (943)Unrealised gain on futures contracts 18,239Unrealisedappreciation /(depreciation)USDAs at 31 December 2011, the Company had the following open futures contracts:<strong>STANLIB</strong> Multi-Manager Global Equity FundDescriptionMaturity dateNumber ofContractsCost USDMarket ValueUSDCME S&P 500 E-Mini Future 16/03/<strong>2012</strong> 19 1,159,155 1,189,875 30,720Unrealisedappreciation /(depreciation)USDEUX Euro Stoxx 50 16/03/<strong>2012</strong> 273 8,066,816 8,179,404 112,588TSE Topix Index Futures 08/03/<strong>2012</strong> 3 280,153 283,857 3,704Unrealised gain on futures contracts 147,01213.Portfolio transaction costsGlobal Property FundAnalysis of total purchase costs <strong>2012</strong> 2011USDUSDPurchases before transaction costs 48,849,500 12,048,010Total purchase transaction costs 109,217 35,912Gross purchases 48,958,717 12,083,922Analysis of total sales costsGross sales before transaction costs 15,039,083 15,859,606Total sales transaction costs 30,874 46,008Total sales, net of transaction costs 15,008,209 15,813,59837
<strong>STANLIB</strong> <strong>Funds</strong> <strong>Limited</strong>Notes to the Financial Statements (continued)13.Portfolio transaction costs (continued)<strong>STANLIB</strong> Multi-Manager Global Bond FundAnalysis of total purchase costs <strong>2012</strong> 2011USDUSDPurchases before transaction costs 802,321,827 556,359,647Total purchase transaction costs 45,163 35,845Gross purchases 802,366,990 556,395,492Analysis of total sales costsGross sales before transaction costs 637,823,867 690,445,231Total sales transaction costs 76,490 129,115Total sales, net of transaction costs 637,747,377 690,316,116<strong>STANLIB</strong> Multi-Manager Global Equity FundAnalysis of total purchase costs <strong>2012</strong> 2011USDUSDPurchases before transaction costs 1,112,563,242 975,425,174Total purchase transaction costs 1,343,836 1,298,423Gross purchases 1,113,907,078 976,723,597Analysis of total sales costsGross sales before transaction costs 1,147,963,333 723,090,603Total sales transaction costs 807,514 611,798Total sales, net of transaction costs 1,147,155,819 722,478,805High Alpha Global Equity FundAnalysis of total purchase costs <strong>2012</strong> 2011USDUSDPurchases before transaction costs 1,081,218,893 713,905,371Total purchase transaction costs 1,115,623 466,472Gross purchases 1,082,334,516 714,371,843Analysis of total sales costsGross sales before transaction costs 1,218,175,085 779,219,105Total sales transaction costs 661,125 639,400Total sales, net of transaction costs 1,217,513,960 778,579,705<strong>STANLIB</strong> Global Bond FundAnalysis of total purchase costs <strong>2012</strong> 2011USDUSDPurchases before transaction costs 60,849,485 64,037,350Total purchase transaction costs 3,190 3,080Gross purchases 60,852,675 64,040,430Analysis of total sales costsGross sales before transaction costs 53,235,007 81,295,463Total sales transaction costs 31,830 53,718Total sales, net of transaction costs 53,203,177 81,241,74538
<strong>STANLIB</strong> <strong>Funds</strong> <strong>Limited</strong>Notes to the Financial Statements (continued)13.Portfolio transaction costs (continued)<strong>STANLIB</strong> Global Emerging Markets Fund*Analysis of total purchase costs <strong>2012</strong>USDPurchases before transaction costs 186,975,041Total purchase transaction costs 81,356Gross purchases 187,056,397Analysis of total sales costsGross sales before transaction costs 90,621,544Total sales transaction costs 81,890Total sales, net of transaction costs 90,539,654* Class Fund launched on 6 December <strong>2012</strong>14.Total expense ratioTotal expense ratios for each of the Class <strong>Funds</strong> were as follows:For the year ended 31 December <strong>2012</strong><strong>STANLIB</strong> Multi-Manager Global Equity Fund 0.86<strong>STANLIB</strong> Multi-Manager Global Bond Fund 0.69High Alpha Global Equity Fund 0.74<strong>STANLIB</strong> Global Bond Fund 0.84Global Property Fund 0.68<strong>STANLIB</strong> Global Emerging Markets Fund* 0.68TotalExpenseRatio (%)For the year ended 31 December 2011<strong>STANLIB</strong> Multi-Manager Global Equity Fund 0.91<strong>STANLIB</strong> Multi-Manager Global Bond Fund 0.72High Alpha Global Equity Fund 1.08<strong>STANLIB</strong> Global Bond Fund 0.84Global Property Fund 0.71TotalExpenseRatio (%)* <strong>Annual</strong>ised39
<strong>STANLIB</strong> <strong>Funds</strong> <strong>Limited</strong>Notes to the Financial Statements (continued)15. Reconciliation of net assetsThe following tables reconcile the difference between the Class <strong>Funds</strong>’ net assets for financial reporting purposes and its net assets for shareholder dealing purposes for the year ended 31 December <strong>2012</strong>and 31 December 2011.Global Property Fund<strong>STANLIB</strong> Multi-ManagerGlobal Bond Fund<strong>STANLIB</strong> Multi-ManagerGlobal Equity FundHigh Alpha Global EquityFund<strong>2012</strong>USD2011USD<strong>2012</strong>USD2011USD<strong>2012</strong>USD2011USD<strong>2012</strong>USD2011USDNet asset value per audited financial statements 79,084,541 33,557,524 534,143,620 358,653,440 1,484,745,052 1,367,888,233 689,100,754 753,842,969Bid adjustment1 126,824 – 1,045,951 – 1,240,007 – 293,978 –Non-redeemable founders’ shares – – – – 100 – – –Net asset value for shareholder dealing 79,211,365 33,557,524 535,189,571 358,653,440 1,485,985,159 1,367,888,233 689,394,732 753,842,969<strong>STANLIB</strong> Global Bond Fund<strong>STANLIB</strong> Global EmergingMarkets Fund*Aggregated Fund<strong>2012</strong>USD2011USD<strong>2012</strong>USD2011USD<strong>2012</strong>USD2011USDNet asset value per audited financial statements 81,836,679 73,176,742 103,348,932 – 2,972,259,578 2,587,118,908Bid adjustment1 93,050 – 138,615 – 2,938,425 –Non-redeemable founders’ shares – – – – 100 –Net asset value for shareholder dealing 81,929,729 73,176,742 103,487,547 – 2,975,198,103 2,587,118,908* Class Fund launched on 6 December <strong>2012</strong>1 The adjustment is the difference between the mid value of investments on the valuation date and the bid value of investments on the final trading day of the fiscal year. The SORP and United Kingdom Accounting Standards require investments in long positions to be valued at bid pricewhere available. Investments are valued at mid-price where available for the purpose of shareholder dealing valuation in accordance with the prospectus.16.Post balance sheet eventsThere were no significant events since the year end that require disclosure in the financial statements.40
<strong>STANLIB</strong> <strong>Funds</strong> <strong>Limited</strong>Portfolio StatementGlobal Property Fund as at 31 December <strong>2012</strong>Common StockTransferable securities listed on an exchange or dealt in on another regulated marketNominal holding Cost Market Value % of Net AssetsUSDUSDAustraliaCFS Retail Property Trust Group 193,474 327,316 384,646 0.49Dexus Property Group 596,730 488,049 625,731 0.79Goodman Group 154,294 541,767 687,210 0.87GPT Group 180,593 567,750 686,217 0.87Growthpoint Properties Australia 546,117 1,087,694 1,253,011 1.58Investa Office Fund 131,989 289,300 405,615 0.51Mirvac Group 280,650 356,599 431,219 0.55Stockland 185,000 668,307 668,387 0.85Westfield Group 138,152 1,227,496 1,501,698 1.89Westfield Retail Trust 458,603 1,309,857 1,433,134 1.81Total Australia 10.21% (2011: 11.03%) 8,076,868 10.21BermudaHongkong Land Holdings Ltd 94,021 531,216 656,267 0.83Total Bermuda 0.83% (2011: 2.03%) 656,267 0.83CanadaBoardwalk Real Estate Investment Trust 3,000 190,826 193,764 0.25Brookfield Office Properties Inc 48,077 734,684 814,569 1.03Calloway Real Estate Investment Trust 20,557 577,177 596,667 0.75Canadian Apartment Properties REIT 30,709 724,812 764,261 0.97Canadian Real Estate Investment Trust 17,321 685,194 752,199 0.95Cominar Real Estate Investment Trust 22,704 552,941 514,189 0.65Primaris Retail Real Estate Investment Trust 30,617 692,856 825,930 1.04RioCan Real Estate Investment Trust 29,650 735,447 818,900 1.04Total Canada 6.68% (2011: 2.28%) 5,280,479 6.68FranceKlepierre 10,023 386,840 394,574 0.5Unibail-Rodamco SE 8,549 1,674,691 2,050,732 2.59Total France 3.09% (2011: 4.64%) 2,445,306 3.09GermanyAlstria Office REIT-AG 47,326 583,473 579,076 0.74Deutsche Euroshop AG 8,000 296,198 333,973 0.42GSW Immobilien AG 8,700 342,771 366,293 0.46Total Germany 1.62% (2011: 2.00%) 1,279,342 1.62Hong KongHang Lung Properties Ltd 146,000 464,904 579,226 0.73Link REIT/The 269,804 990,745 1,348,858 1.71Swire Properties Ltd 100,000 304,628 332,870 0.42Wharf Holdings Ltd 204,000 1,177,389 1,584,448 2Yuexiu Real Estate Investment Trust 1,200,000 574,544 569,760 0.7241
<strong>STANLIB</strong> <strong>Funds</strong> <strong>Limited</strong>Portfolio Statement (continued)Global Property Fund as at 31 December <strong>2012</strong> (continued)Common Stock continuedNominal holding Cost Market Value % of Net AssetsUSDUSDTotal Hong Kong 5.58% (2011: 2.40%) 4,415,162 5.58JapanAdvance Residence Investment Corp 231 485,256 473,141 0.6Japan Real Estate Investment Corp 59 522,657 577,956 0.73Japan Retail Fund Investment Corp 336 595,951 616,314 0.78Kenedix Realty Investment Corp 143 479,395 497,808 0.63Mitsui Fudosan Co Ltd 19,000 399,743 458,822 0.58Nippon Building Fund Inc 72 693,751 741,942 0.94Nomura Real Estate Office Fund Inc 44 286,492 252,403 0.32Total Japan 4.58% (2011: 4.54%) 3,618,386 4.58JerseyAtrium European Real Estate Ltd 49,425 288,716 287,752 0.36Total Jersey 0.36% (2011: 0.00%) 287,752 0.36NetherlandsCorio NV 8,671 481,160 391,650 0.5Eurocommercial Properties NV 10,000 378,057 396,438 0.5Total Netherlands 1.00% (2011: 3.88%) 788,088 1SingaporeCapitaCommercial Trust 321,000 364,068 441,503 0.56CapitaMall Trust 368,000 524,595 641,719 0.81CapitaRetail China Trust 100,000 123,176 133,850 0.17Global Logistic Properties Ltd 248,000 454,082 564,423 0.71Lippo Malls Indonesia Retail Trust 1,000,000 263,644 401,100 0.51Mapletree Industrial Trust 250,000 218,370 277,325 0.35Mapletree Logistics Trust 400,000 205,362 371,680 0.47Parkway Life Real Estate Investment Trust 200,000 313,890 348,760 0.44Total Singapore 4.02% (2011: 4.76%) 3,180,360 4.02SwedenCastellum AB 28,300 366,180 401,523 0.51Total Sweden 0.51% (2011: 0.00%) 401,523 0.51SwitzerlandPSP Swiss Property AG 5,700 520,655 538,958 0.68Swiss Prime Site AG 5,000 391,338 417,054 0.53Total Switzerland 1.21% (2011: 0.75%) 956,012 1.21United KingdomBig Yellow Group Plc 62,536 293,647 351,921 0.44British Land Co Plc 112,191 862,527 1,024,898 1.3Derwent London Plc 10,040 309,906 343,699 0.43Great Portland Estates Plc 62,802 387,775 498,887 0.63Hammerson Plc 126,259 877,159 1,001,752 1.27Land Securities Group Plc 73,487 804,474 971,153 1.23Segro Plc 84,897 379,532 339,206 0.4342
<strong>STANLIB</strong> <strong>Funds</strong> <strong>Limited</strong>Portfolio Statement (continued)Global Property Fund as at 31 December <strong>2012</strong> (continued)Common Stock continuedNominal holding Cost Market Value % of Net AssetsUSDUSDTotal United Kingdom 5.73% (2011: 5.82%) 4,531,516 5.73United StatesAlexandria Real Estate Equities Inc 6,099 402,158 422,356 0.53American Campus Communities Inc 22,685 943,740 1,045,779 1.33AvalonBay Communities Inc 11,741 1,436,266 1,591,493 2.02Boston Properties Inc 16,178 1,348,904 1,711,794 2.16Brookfield Office Properties Inc 12,000 192,526 204,240 0.26Camden Property Trust 9,928 555,182 677,487 0.86Colonial Properties Trust 25,153 566,347 537,520 0.68DDR Corp 47,963 685,018 750,141 0.95Digital Realty Trust Inc 9,361 577,479 634,957 0.81Duke Realty Corp 24,600 326,663 341,202 0.43Equity Residential 29,219 1,464,942 1,654,964 2.09Essex Property Trust Inc 4,481 566,517 657,363 0.83Extra Space Storage Inc 14,900 444,915 542,062 0.69Federal Realty Investment Trust 7,165 652,719 745,303 0.95General Growth Properties Inc 48,000 796,493 953,280 1.21Glimcher Realty Trust 57,000 472,113 632,130 0.8HCP Inc 25,800 1,074,543 1,165,128 1.47Health Care REIT Inc 13,699 640,400 839,612 1.06Home Properties Inc 9,306 477,209 570,644 0.72Host Hotels & Resorts Inc 81,229 1,303,486 1,272,858 1.61Kilroy Realty Corp 15,253 598,449 722,840 0.91Kimco Realty Corp 40,332 654,775 779,214 0.98LaSalle Hotel Properties 10,000 257,514 254,000 0.32Lexington Realty Trust 51,000 467,071 532,440 0.67Liberty Property Trust 10,298 339,576 368,359 0.47Macerich Co/The 19,992 973,964 1,164,934 1.47Mid-America Apartment Communities Inc 8,231 538,852 532,793 0.67National Retail Properties Inc 14,781 396,080 461,019 0.58Prologis Inc 55,859 1,673,225 2,038,295 2.57Public Storage 16,797 1,958,592 2,435,061 3.08Regency Centers Corp 7,852 292,262 369,515 0.47Simon Property Group Inc 35,331 4,223,553 5,585,477 7.06SL Green Realty Corp 11,293 764,023 865,608 1.1Tanger Factory Outlet Centers 34,366 1,037,826 1,174,630 1.48Taubman Centers Inc 10,704 716,074 842,298 1.07UDR Inc 36,021 826,733 856,579 1.08Ventas Inc 24,016 1,285,355 1,553,835 1.96Vornado Realty Trust 16,216 1,316,161 1,298,415 1.64Total United States 49.04% (2011: 55.93%) 38,785,625 49.04Total Common Stock 94.46% (2011: 99.61%) 74,702,686 94.4643
<strong>STANLIB</strong> <strong>Funds</strong> <strong>Limited</strong>Portfolio Statement (continued)Global Property Fund as at 31 December <strong>2012</strong> (continued)Investment CompaniesNominal holding Cost Market Value % of Net AssetsUSDUSDSouth AfricaNew Europe Property Investments Plc 318,686 1,250,503 1,990,768 2.52Total South Africa 2.52% (2011: 0.00%) 1,990,768 2.52Total Investment Companies 2.52% (2011: 0.00%) 1,990,768 2.52Total Investments 65,855,237 76,693,454 96.98Net current assets 2,391,087 3.02Total net assets 79,084,541 100<strong>STANLIB</strong> Multi-Manager Global Bond Fund as at 31 December <strong>2012</strong>Investment CompaniesTransferable securities listed on an exchange or dealt in on another regulated marketIrelandInstitutional Cash Series Plc - Institutional US Dollar LiquidityFundNominal holding Cost Market Value % of Net AssetsUSDUSD15,000,000 15,000,000 15,000,000 2.81iShares Barclays Euro Inflation Linked Bond 4,530 1,068,274 1,174,327 0.22iShares Markit iBoxx Euro High Yield Bond 2,167 267,316 314,349 0.06Total Ireland 3.09% (2011: 0.00%) 16,488,676 3.09LuxembourgCapital International Global High Income Opportunities 366,341 12,438,071 15,082,273 2.82Total Luxembourg 2.82% (2011: 0.00%) 15,082,273 2.82United StatesiShares iBoxx $ High Yield Corporate Bond Fund 11,800 999,261 1,101,412 0.21Total United States 0.21% (2011: 0.00%) 1,101,412 0.21Total Investment Companies 6.12% (2011: 0.00%) 32,672,361 6.12BondsArgentinaNominal holding Cost Market Value % of Net AssetsArgentina Bonar Bonds 7.00% 12/09/2013 165,000 132,201 164,010 0.03Total Argentina 0.03 (2011: 0.05%) 164,010 0.03AustraliaAustralia & New Zealand Banking Group Ltd 3.25%01/03/2016USDUSD100,000 99,937 106,005 0.02Australia Government Bond 5.50% 15/12/2013 100,000 96,363 106,576 0.02Australia Government Bond 4.50% 21/10/2014 650,000 679,580 696,561 0.13Australia Government Bond 4.75% 15/06/2016 250,000 235,634 276,843 0.05Australia Government Bond 4.25% 21/07/2017 550,000 584,152 606,949 0.1144
<strong>STANLIB</strong> <strong>Funds</strong> <strong>Limited</strong>Portfolio Statement (continued)<strong>STANLIB</strong> Global Bond Fund as at 31 December <strong>2012</strong> (continued)Bonds continuedNominal holding Cost Market Value % of Net AssetsUSDUSDAustralia (continued)Australia Government Bond 5.75% 15/05/2021 350,000 413,056 432,534 0.08Australia Government Bond 5.75% 15/07/2022 450,000 539,999 563,130 0.11Australia Government Bond 5.50% 21/04/2023 300,000 380,552 371,414 0.07Australia Treasury Bill –% 08/02/2013 1,395,000 1,440,165 1,443,815 0.27BHP Billiton Finance Ltd 2.25% 25/09/2020 100,000 128,718 135,472 0.03BHP Billiton Finance USA Ltd 4.13% 24/02/2042 50,000 50,342 52,912 0.01Commonwealth Bank of Australia 4.25% 10/11/2016 100,000 144,219 148,451 0.03Commonwealth Bank of Australia 5.00% 19/03/2020 100,000 105,002 114,899 0.02FMG Resources August 2006 Pty Ltd 7.00% 01/11/2015 8,000 8,151 8,440 0FMG Resources August 2006 Pty Ltd 8.25% 01/11/2019 15,000 15,112 16,013 0National Australia Bank Ltd 3.50% 23/01/2015 50,000 64,251 69,668 0.01National Australia Bank Ltd 3.00% 27/07/2016 200,000 206,313 211,740 0.04New South Wales Treasury Corp 5.25% 01/05/2013 200,000 174,661 209,285 0.04New South Wales Treasury Corp 6.00% 01/04/2016 6,390,000 6,574,994 7,198,046 1.36New South Wales Treasury Corp 6.00% 01/05/2023 235,000 274,566 287,322 0.05Newcrest Finance Pty Ltd 4.20% 01/10/2022 50,000 51,895 51,425 0.01Nufarm Australia Ltd 6.38% 15/10/2019 2,000 2,000 2,105 0Queensland Treasury Corp 6.00% 14/10/2015 300,000 215,523 335,815 0.06Queensland Treasury Corp 6.25% 14/06/2019 400,000 408,032 478,108 0.09Queensland Treasury Corp 6.25% 21/02/2020 3,995,000 4,333,462 4,718,802 0.88Queensland Treasury Corp 6.00% 21/07/2022 1,200,000 1,317,361 1,412,280 0.26Rio Tinto Finance USA Ltd 6.50% 15/07/2018 100,000 115,145 125,277 0.02Telstra Corp Ltd 6.13% 06/08/2014 50,000 87,024 87,292 0.02Treasury Corp of Victoria 6.00% 15/06/2020 240,000 244,587 285,313 0.05Western Australian Treasury Corp 7.00% 15/04/2015 125,000 117,899 141,048 0.03Western Australian Treasury Corp 7.00% 15/10/2019 70,000 85,808 87,105 0.02Westpac Banking Corp 4.88% 19/11/2019 150,000 156,537 174,843 0.03Woodside Finance Ltd 4.50% 10/11/2014 80,000 79,472 84,617 0.02Woodside Finance Ltd 4.60% 10/05/2021 250,000 250,843 275,764 0.05Total Australia 3.99 (2011: 3.69%) 21,315,869 3.99AustriaAustria Government Bond 3.40% 20/10/2014 50,000 68,297 69,853 0.01Austria Government Bond 3.50% 15/07/2015 600,000 817,975 857,069 0.16Austria Government Bond 3.65% 20/04/2022 325,000 472,603 500,301 0.09Austria Government Bond 3.40% 22/11/2022 250,000 338,645 377,874 0.07Austria Government Bond 4.15% 15/03/2037 300,000 448,103 508,833 0.1Total Austria 0.43 (2011: 0.02%) 2,313,930 0.43BahrainBahrain Government International Bond 5.50% 31/03/2020 425,000 455,624 457,385 0.09Total Bahrain 0.09 (2011: 0.00%) 457,385 0.09BelgiumAnheuser-Busch InBev NV 8.63% 30/01/2017 175,000 284,162 301,457 0.0645
<strong>STANLIB</strong> <strong>Funds</strong> <strong>Limited</strong>Portfolio Statement (continued)<strong>STANLIB</strong> Multi-Manager Global Bond Fund as at 31 December <strong>2012</strong> (continued)Bonds continuedBelgium (continued)Nominal holding Cost Market Value % of Net AssetsAnheuser-Busch InBev NV 4.00% 02/06/2021 50,000 68,694 76,017 0.01Belgium Government Bond 4.00% 28/03/2014 380,000 504,891 524,699 0.1Total Belgium 0.17 (2011: 0.32%) 902,173 0.17BermudaBacardi Ltd 7.45% 01/04/2014 35,000 39,677 37,764 0.01Bermuda Government International Bond 5.60%20/07/2020100,000 117,115 116,854 0.02Novartis Securities Investment Ltd 5.13% 10/02/2019 50,000 53,930 59,563 0.01Total Bermuda 0.04 (2011: 0.03%) 214,181 0.04BrazilBanco Bradesco SA 4.10% 23/03/2015 150,000 155,016 156,750 0.03Banco Santander Brasil SA/Brazil 4.50% 06/04/2015 100,000 100,205 103,489 0.02Banco Votorantim SA 7.38% 21/01/2020 100,000 107,666 112,176 0.02Brazil Notas do Tesouro Nacional 10.00% 01/01/2017 3,075,000 1,511,474 1,510,106 0.27Brazilian Government International Bond 12.50% 05/01/2016 1,640,000 961,186 989,210 0.19Brazilian Government International Bond 5.88% 15/01/2019 200,000 223,927 248,000 0.05Brazilian Government International Bond 4.88% 22/01/2021 400,000 456,216 480,378 0.09Brazilian Government International Bond 8.50% 05/01/2024 750,000 420,370 445,973 0.08Brazilian Government International Bond 10.25% 10/01/2028 725,000 453,542 461,204 0.09Brazilian Government International Bond 5.63% 07/01/2041 150,000 177,807 196,500 0.04Itau Unibanco Holding SA/Cayman Island 5.75% 22/01/2021 100,000 103,624 107,000 0.02Oi SA 5.75% 10/02/2022 615,000 615,098 641,262 0.12Samarco Mineracao SA 4.13% 01/11/2022 200,000 200,492 202,468 0.04Vale SA 5.63% 11/09/2042 50,000 53,365 54,151 0.01Total Brazil 1.07 (2011: 1.04%) 5,708,667 1.07CanadaBank of Montreal 2.85% 09/06/2015 100,000 105,615 105,579 0.02Bank of Montreal 4.55% 01/08/2017 130,000 129,846 143,081 0.03Bank of Nova Scotia 3.34% 25/03/2015 150,000 147,963 155,636 0.03Bank of Nova Scotia 1.65% 29/10/2015 150,000 154,543 154,539 0.03Bank of Nova Scotia 1.95% 30/01/2017 1,100,000 1,125,664 1,145,877 0.22Barrick Gold Corp 3.85% 01/04/2022 100,000 103,976 106,053 0.02Canada Housing Trust No 1 4.10% 15/12/2018 90,000 96,899 101,838 0.02Canada Housing Trust No 1 2.65% 15/03/2022 100,000 99,887 103,470 0.02Canadian Government Bond 1.00% 01/02/2014 1,200,000 1,196,240 1,203,800 0.24Canadian Government Bond 2.00% 01/12/2014 160,000 150,625 163,258 0.03Canadian Government Bond 1.50% 01/03/2017 1,000,000 1,001,900 1,009,415 0.19Canadian Government Bond 4.25% 01/06/2018 1,700,000 1,833,917 1,955,851 0.38Canadian Government Bond 3.75% 01/06/2019 630,000 669,889 716,811 0.13Canadian Government Bond 3.25% 01/06/2021 580,000 632,068 651,891 0.12Canadian Government Bond 8.00% 01/06/2027 200,000 340,354 347,038 0.06Canadian Government Bond 5.75% 01/06/2029 100,000 99,940 149,152 0.03USDUSD46
<strong>STANLIB</strong> <strong>Funds</strong> <strong>Limited</strong>Portfolio Statement (continued)<strong>STANLIB</strong> Multi-Manager Global Bond Fund as at 31 December <strong>2012</strong> (continued)Bonds continuedNominal holding Cost Market Value % of Net AssetsUSDUSDCanada (continued)Canadian Government Bond 4.00% 01/06/2041 580,000 754,228 778,559 0.15Canadian Imperial Bank of Commerce 2.60% 02/07/2015 100,000 105,138 105,055 0.02Canadian Imperial Bank of Commerce 2.35% 11/12/2015 100,000 104,719 105,101 0.02Encana Corp 6.50% 01/02/2038 50,000 56,548 62,803 0.01Hydro One Inc 5.18% 18/10/2017 50,000 52,163 57,234 0.01Hydro-Quebec 5.00% 15/02/2045 140,000 152,655 180,547 0.03Inmet Mining Corp 8.75% 01/06/2020 21,000 21,191 22,995 0Inmet Mining Corp 7.50% 01/06/2021 8,000 8,000 8,320 0Kodiak Oil & Gas Corp 8.13% 01/12/2019 46,000 49,062 50,830 0.01MEG Energy Corp 6.38% 30/01/2023 22,000 22,714 22,935 0National Bank of Canada 2.20% 19/10/2016 250,000 258,474 262,810 0.05Petro-Canada 6.05% 15/05/2018 195,000 231,059 237,614 0.04Province of British Columbia 5.30% 18/06/2014 204,000 205,310 216,846 0.04Province of British Columbia 4.70% 18/06/2037 150,000 166,559 184,443 0.03Province of Manitoba Canada 5.50% 15/11/2018 70,000 73,659 83,488 0.02Province of New Brunswick Canada 5.65% 27/12/2028 50,000 52,881 64,460 0.01Province of Ontario Canada 5.00% 08/03/2014 1,112,000 1,157,002 1,165,742 0.23Province of Ontario Canada 3.25% 08/09/2014 75,000 74,551 77,761 0.01Province of Ontario Canada 0.95% 26/05/2015 485,000 486,944 490,482 0.09Province of Ontario Canada 1.88% 15/09/2015 150,000 154,353 155,417 0.03Province of Ontario Canada 5.60% 02/06/2035 370,000 423,133 497,044 0.09Province of Quebec Canada 1.60% 09/05/2013 10,000,000 115,761 116,160 0.02Province of Quebec Canada 4.50% 01/12/2017 762,000 781,422 855,994 0.16Province of Quebec Canada 3.50% 29/07/2020 200,000 222,544 222,585 0.04Province of Quebec Canada 4.25% 01/12/2043 100,000 108,231 114,257 0.02Quebecor Media Inc 5.75% 15/01/2023 22,000 22,320 23,183 0Rogers Communications Inc 3.00% 06/06/2017 100,000 102,060 102,373 0.02Royal Bank of Canada 4.97% 05/06/2014 50,000 52,449 52,673 0.01Royal Bank of Canada 2.98% 07/05/2019 100,000 100,598 102,936 0.02Royal Bank Of Canada 3.25% 18/01/2013 40,000 50,602 52,761 0.01Shaw Communications Inc 5.65% 01/10/2019 50,000 56,383 56,352 0.01Teck Resources Ltd 5.40% 01/02/2043 50,000 51,517 53,231 0.01Toronto-Dominion Bank 4.88% 23/01/2013 50,000 73,231 66,076 0.01Toronto-Dominion Bank 5.38% 14/05/2015 50,000 65,141 73,269 0.01Toronto-Dominion Bank 1.63% 14/09/2016 996,000 1,014,799 1,026,054 0.19Toronto-Dominion Bank 1.50% 13/03/2017 240,000 239,216 245,665 0.05Toronto-Dominion Bank 5.48% 02/04/2020 150,000 154,685 162,390 0.03TransCanada PipeLines Ltd 4.00% 15/06/2013 100,000 104,634 101,652 0.02TransCanada PipeLines Ltd 6.50% 15/08/2018 325,000 385,612 409,934 0.08TransCanada PipeLines Ltd 6.20% 15/10/2037 50,000 69,040 66,400 0.01Videotron Ltd 5.00% 15/07/2022 20,000 20,443 20,975 0Xstrata Finance Canada Ltd 4.00% 25/10/2022 100,000 100,691 100,954 0.0247
<strong>STANLIB</strong> <strong>Funds</strong> <strong>Limited</strong>Portfolio Statement (continued)<strong>STANLIB</strong> Multi-Manager Global Bond Fund as at 31 December <strong>2012</strong> (continued)Bonds continuedCanada (continued)Nominal holding Cost Market Value % of Net AssetsTotal Canada 3.20 (2011: 2.24%) 17,069,649 3.2Cayman IslandsBraskem Finance Ltd 7.00% 07/05/2020 100,000 110,458 112,929 0.02Hutchison Whampoa International 09 Ltd 7.63% 09/04/2019 100,000 118,772 128,467 0.02IPIC GMTN Ltd 4.88% 14/05/2016 100,000 134,947 146,276 0.03Offshore Group Investment Ltd 11.50% 01/08/2015 20,000 20,991 21,900 0Petrobras International Finance Co - Pifco 7.88% 15/03/2019 500,000 615,828 621,596 0.13Petrobras International Finance Co - Pifco 5.75% 20/01/2020 80,000 91,822 90,776 0.02Petrobras International Finance Co - Pifco 5.38% 27/01/2021 210,000 234,071 235,780 0.04Transocean Inc 5.05% 15/12/2016 295,000 320,931 328,026 0.06Vale Overseas Ltd 4.38% 11/01/2022 400,000 406,227 427,536 0.08Voto-Votorantim Ltd 6.75% 05/04/2021 125,000 148,873 146,317 0.03Voto-Votorantim Overseas Trading Operations NV 6.63%25/09/2019USDUSD150,000 167,374 175,407 0.03Total Cayman Islands 0.46 (2011: 0.07%) 2,435,010 0.46ChileChile Government International Bond 5.50% 05/08/2020 50,000,000 104,937 116,200 0.02Total Chile 0.02 (2011: 0.00%) 116,200 0.02ColombiaColombia Government International Bond 4.38% 12/07/2021 350,000 385,518 404,250 0.08Colombia Government International Bond 6.13% 18/01/2041 200,000 190,736 272,472 0.05Transportadora de Gas Internacional SA ESP 5.70%20/03/2022200,000 223,664 220,601 0.04Total Colombia 0.17 (2011: 0.10%) 897,323 0.17CroatiaCroatia Government International Bond 6.75% 05/11/2019 475,000 483,748 544,778 0.1Total Croatia 0.10 (2011: 0.17%) 544,778 0.1Czech RepublicCzech Republic Government Bond 4.00% 11/04/2017 8,600,000 464,806 513,180 0.09Czech Republic Government Bond 5.00% 11/04/2019 2,100,000 111,340 133,988 0.03Total Czech Republic 0.12 (2011: 0.00%) 647,168 0.12DenmarkDanske Bank A/S 3.88% 28/02/2017 100,000 131,274 144,738 0.03Danske Bank A/S 4.13% 26/11/2019 75,000 98,342 115,890 0.02Denmark Government Bond 4.00% 15/11/2015 1,400,000 256,442 273,923 0.05Denmark Government Bond 4.00% 15/11/2017 1,000,000 197,643 208,505 0.04Denmark Government Bond 4.50% 15/11/2039 400,000 92,935 108,072 0.02Nykredit Realkredit A/S 5.00% 01/04/2028 330,557 65,691 62,547 0.01Total Denmark 0.17 (2011: 0.25%) 913,675 0.17El SalvadorEl Salvador Government International Bond 7.75%24/01/202335,000 37,805 41,563 0.01Total El Salvador 0.01 (2011: 0.01%) 41,563 0.0148
<strong>STANLIB</strong> <strong>Funds</strong> <strong>Limited</strong>Portfolio Statement (continued)<strong>STANLIB</strong> Multi-Manager Global Bond Fund as at 31 December <strong>2012</strong> (continued)Bonds continuedFinlandNominal holding Cost Market Value % of Net AssetsFinland Government Bond 3.13% 15/09/2014 225,000 306,579 312,066 0.06Finland Government Bond 3.88% 15/09/2017 375,000 533,874 573,324 0.11Finland Government Bond 3.38% 15/04/2020 50,000 72,330 76,514 0.01Finland Government Bond 3.50% 15/04/2021 920,000 1,342,807 1,421,851 0.27Nordea Bank Finland Plc 4.00% 10/02/2021 100,000 137,372 156,523 0.03Total Finland 0.48 (2011: 0.42%) 2,540,278 0.48FranceAgence Francaise de Developpement 1.80% 19/06/2015 20,000,000 238,118 236,680 0.04Agence Francaise de Developpement 1.63% 04/10/2017 150,000 151,775 151,927 0.03AXA SA 5.25% 16/04/2040 50,000 64,006 68,884 0.01BNP Paribas Home Loan SFH 4.50% 30/05/2014 100,000 136,543 139,405 0.03BNP Paribas SA 5.00% 16/12/2013 100,000 133,781 137,407 0.03BNP Paribas SA 5.00% 15/01/2021 175,000 173,686 197,018 0.04BNP Paribas SA 5.02% 29/04/2049 50,000 43,636 62,333 0.01Bouygues SA 3.64% 29/10/2019 50,000 69,629 71,663 0.01Caisse d'Amortissement de la Dette Sociale 4.00%25/10/2014Caisse d'Amortissement de la Dette Sociale 4.00%15/12/2025USDUSD150,000 208,585 211,079 0.04200,000 283,719 310,816 0.06Caisse de Refinancement de l'Habitat SA 2.50% 07/05/2015 150,000 196,140 207,336 0.04Caisse de Refinancement de l'Habitat SA 3.75% 19/02/2020 100,000 129,146 151,920 0.03Caisse Francaise de Financement Local 1.80% 09/05/2017 56,000,000 608,976 645,568 0.12Caisse Francaise de Financement Local 4.50% 13/11/2017 100,000 135,995 149,644 0.03Cie de Financement Foncier SA 2.50% 16/09/2015 300,000 299,066 311,087 0.06Cie de Financement Foncier SA 4.50% 16/05/2018 60,000 85,726 92,462 0.02Cie de Financement Foncier SA 4.38% 25/04/2019 100,000 136,422 154,426 0.03Cie de Financement Foncier SA 4.00% 24/10/2025 100,000 135,806 152,855 0.03CIF Euromortgage SA 3.25% 03/02/2016 100,000 136,693 139,714 0.03CNP Assurances 4.75% 29/12/2049 50,000 35,229 56,029 0.01Credit Agricole Home Loan SFH 2.25% 29/01/2013 50,000 63,728 65,999 0.01Credit Agricole SA 5.97% 01/02/2018 50,000 70,945 74,568 0.01Credit Mutuel - CIC Home Loan SFH 3.13% 21/01/2015 50,000 64,659 69,380 0.01Electricite De France S.A. 5.63% 23/01/2013 5.63%23/01/2013150,000 189,884 198,219 0.04Electricite de France SA 5.00% 05/02/2018 50,000 67,419 77,650 0.01Electricite de France SA 4.63% 26/04/2030 50,000 68,370 75,793 0.01Electricite de France SA 5.60% 27/01/2040 125,000 125,889 143,724 0.03France Government Bond OAT 4.00% 25/10/2013 450,000 655,922 612,033 0.11France Government Bond OAT 5.00% 25/10/2016 438,000 693,490 676,743 0.13France Government Bond OAT 4.25% 25/10/2017 830,000 1,231,810 1,276,887 0.24France Government Bond OAT 3.75% 25/10/2019 600,000 854,945 919,534 0.17France Government Bond OAT 3.25% 25/10/2021 630,000 885,114 930,469 0.17France Government Bond OAT 4.25% 25/10/2023 550,000 816,958 870,435 0.1649
<strong>STANLIB</strong> <strong>Funds</strong> <strong>Limited</strong>Portfolio Statement (continued)<strong>STANLIB</strong> Multi-Manager Globa Bond Fund as at 31 December <strong>2012</strong> (continued)Bonds continuedFrance (continued)Nominal holding Cost Market Value % of Net AssetsFrance Government Bond OAT 5.50% 25/04/2029 350,000 560,231 638,465 0.12France Government Bond OAT 5.75% 25/10/2032 100,000 179,478 192,919 0.04France Government Bond OAT 4.50% 25/04/2041 210,000 311,524 356,428 0.07France Telecom SA 4.75% 21/02/2017 190,000 266,797 285,067 0.05France Telecom SA 5.63% 22/05/2018 50,000 74,961 79,489 0.01French Treasury Note BTAN 3.00% 12/07/2014 830,000 1,112,536 1,143,057 0.21GDF Suez 2.63% 20/07/2022 100,000 122,220 135,067 0.03Pernod-Ricard SA 4.88% 18/03/2016 100,000 136,264 146,518 0.03Reseau Ferre de France 4.25% 07/10/2026 100,000 151,116 155,730 0.03Sanofi 4.00% 29/03/2021 100,000 99,569 113,557 0.02Schneider Electric SA 3.75% 12/07/2018 100,000 143,982 148,015 0.03Societe Financement de l'Economie Francaise 3.25%16/01/2014USDUSD100,000 130,737 135,970 0.03Societe Generale SA 3.13% 21/09/2017 150,000 182,368 212,491 0.04Societe Generale SCF SA 4.75% 06/06/2013 50,000 67,065 67,145 0.01Total Capital International SA 1.55% 28/06/2017 60,000 61,365 60,906 0.01Total Capital SA 4.88% 28/01/2019 100,000 139,647 159,743 0.03Veolia Environnement SA 4.38% 16/01/2017 76,000 101,321 112,897 0.02Veolia Environnement SA 6.00% 01/06/2018 150,000 169,954 175,962 0.03Vivendi SA 4.13% 18/07/2017 100,000 132,117 144,465 0.03Total France 2.64 (2011: 2.98%) 14,103,578 2.64GermanyBerlin-Hannoversche Hypothekenbank AG 1.38% 30/05/2017 100,000 124,020 136,217 0.03Bundesobligation 1.25% 14/10/2016 700,000 938,159 962,487 0.18Bundesrepublik Deutschland 4.25% 04/01/2014 1,080,000 1,554,216 1,484,468 0.27Bundesrepublik Deutschland 4.25% 04/07/2014 600,000 889,242 841,212 0.16Bundesrepublik Deutschland 3.75% 04/01/2015 1,310,000 1,838,840 1,857,630 0.35Bundesrepublik Deutschland 4.00% 04/07/2016 650,000 945,896 974,255 0.18Bundesrepublik Deutschland 3.75% 04/01/2017 250,000 365,195 376,966 0.07Bundesrepublik Deutschland 4.00% 04/01/2018 200,000 300,091 311,499 0.06Bundesrepublik Deutschland 4.25% 04/07/2018 240,000 350,419 381,983 0.07Bundesrepublik Deutschland 3.50% 04/07/2019 534,000 784,380 831,236 0.16Bundesrepublik Deutschland 2.50% 04/01/2021 500,000 642,063 736,304 0.14Bundesrepublik Deutschland 2.25% 04/09/2021 2,025,000 2,814,606 2,920,420 0.54Bundesrepublik Deutschland 2.00% 04/01/2022 150,000 196,661 211,649 0.04Bundesrepublik Deutschland 6.50% 04/07/2027 1,243,000 2,487,242 2,626,444 0.48Bundesrepublik Deutschland 4.75% 04/07/2028 435,000 704,237 796,785 0.15Bundesrepublik Deutschland 6.25% 04/01/2030 150,000 307,033 321,192 0.06Bundesrepublik Deutschland 5.50% 04/01/2031 235,000 384,373 472,130 0.09Bundesrepublik Deutschland 4.75% 04/07/2034 1,043,000 1,914,673 2,006,676 0.37Bundesrepublik Deutschland 4.75% 04/07/2040 330,000 547,584 672,250 0.13Bundesrepublik Deutschland 3.25% 04/07/2042 575,000 809,075 945,723 0.1850
<strong>STANLIB</strong> <strong>Funds</strong> <strong>Limited</strong>Portfolio Statement (continued)<strong>STANLIB</strong> Multi-Manager Global Bond Fund as at 31 December <strong>2012</strong> (continued)Bonds continuedGermany (continued)Nominal holding Cost Market Value % of Net AssetsBundesrepublik Deutschland 2.50% 04/07/2044 350,000 469,031 496,084 0.09Bundesschatzanweisungen 0.25% 14/03/2014 500,000 648,014 661,110 0.12Daimler AG 4.63% 02/09/2014 100,000 137,601 140,391 0.03Deutsche Bank AG/London 6.00% 01/09/2017 100,000 120,477 120,108 0.02Deutsche Genossenschafts-Hypothekenbank AG 4.00%31/10/2016USDUSD500,000 733,713 747,393 0.14Deutsche Pfandbriefbank AG 3.13% 15/09/2014 50,000 66,045 68,914 0.01FMS Wertmanagement AoeR 1.38% 16/01/2015 100,000 129,802 135,068 0.03Gemeinsame Deutsche Bundeslaender 3.25% 29/04/2014 100,000 133,006 137,051 0.03Hypothekenbank Frankfurt AG 4.50% 21/01/2013 400,000 605,399 528,288 0.1Hypothekenbank Frankfurt AG 3.75% 25/05/2016 150,000 205,784 217,826 0.04KFW 0.38% 03/04/2014 200,000 258,087 264,697 0.05KFW 2.75% 21/10/2014 375,000 387,817 390,467 0.07KFW 3.75% 07/09/2016 170,000 267,782 304,606 0.06KFW 3.88% 21/01/2019 300,000 405,350 465,265 0.09KFW 6.25% 04/12/2019 1,320,000 1,234,443 1,556,103 0.29KFW 2.63% 25/01/2022 150,000 151,129 158,625 0.03KFW 2.05% 16/02/2026 121,000,000 1,519,316 1,562,836 0.29KFW 2.60% 20/06/2037 33,000,000 348,514 438,108 0.08Landeskreditbank Baden-Wuerttemberg Foerderbank3.25% 29/01/2014100,000 132,691 136,264 0.03Landwirtschaftliche Rentenbank 1.38% 23/10/2019 150,000 149,595 149,396 0.03Muenchener Rueckversicherungs AG 7.63% 21/06/2028 50,000 89,258 97,153 0.02NRW Bank 2.13% 22/04/2014 100,000 126,588 134,923 0.03State of Berlin 3.50% 13/02/2014 150,000 198,795 204,918 0.04State of Hesse 2.25% 29/01/2014 150,000 195,494 202,070 0.04State of North Rhine-Westphalia 4.50% 15/02/2018 150,000 209,440 233,179 0.04UniCredit Bank AG 6.00% 05/02/2014 125,000 165,909 170,907 0.03UniCredit Bank AG 2.63% 31/05/2017 100,000 127,559 142,275 0.03Unitymedia Hessen GmbH & Co KG 5.50% 15/01/2023 10,000 10,174 10,325 0Volkswagen Financial Services AG 6.88% 15/01/2014 100,000 133,095 140,279 0.03WL BANK AG Westfaelische Landschaft Bodenkreditbank3.00% 18/05/201650,000 70,629 71,632 0.01Total Germany 5.61 (2011: 6.92%) 29,953,787 5.61HungaryHungary Government Bond 5.50% 12/02/2016 420,000,000 1,911,897 1,880,340 0.35Hungary Government Bond 6.75% 24/02/2017 89,000,000 409,697 415,096 0.08Total Hungary 0.43 (2011: 0.69%) 2,295,436 0.43IndonesiaIndonesia Government International Bond 3.75%25/04/2022250,000 246,170 265,801 0.05Indonesia Government International Bond 8.50% 12/10/2035 100,000 109,281 160,750 0.03Indonesia Treasury Bond 10.75% 15/05/2016 2,850,000,000 288,539 350,883 0.07Indonesia Treasury Bond 11.00% 15/11/2020 7,089,000,000 940,044 1,005,774 0.1951
<strong>STANLIB</strong> <strong>Funds</strong> <strong>Limited</strong>Portfolio Statement (continued)<strong>STANLIB</strong> Multi-Manager Global Bond Fund as at 31 December <strong>2012</strong> (continued)Bonds continuedIndonesia (continued)Nominal holding Cost Market Value % of Net AssetsIndonesia Treasury Bond 10.25% 15/07/2022 1,300,000,000 174,388 183,300 0.03Perusahaan Listrik Negara PT 5.50% 22/11/2021 250,000 282,995 281,945 0.05Perusahaan Penerbit SBSN Indonesia 8.80% 23/04/2014 75,000 80,808 81,938 0.02Total Indonesia 0.44 (2011: 0.66%) 2,330,391 0.44IrelandArdagh Packaging Finance Plc 7.38% 15/10/2017 9,000 9,628 9,831 0Cloverie Plc for Zurich Insurance Co Ltd 8.25% 29/01/2049 100,000 105,972 115,052 0.02GE Capital European Funding 5.25% 18/05/2015 50,000 68,303 72,610 0.01GE Capital European Funding 5.38% 23/01/2020 175,000 243,490 282,668 0.06German Postal Pensions Securitisation Plc 3.38% 18/01/2016 50,000 65,137 71,437 0.01Iberdrola Finance Ireland Ltd 3.80% 11/09/2014 100,000 100,100 102,716 0.02Total Ireland 0.12 (2011: 4.11%) 654,314 0.12IsraelIsrael Government Bond - Fixed 5.50% 28/02/2017 2,775,000 783,383 869,274 0.17Israel Government Bond - Fixed 6.00% 28/02/2019 1,350,000 385,821 442,260 0.08Total Israel 0.25 (2011:0.00%) 1,311,534 0.25ItalyEnel SpA 5.25% 20/05/2024 50,000 62,952 68,100 0.01Eni SpA 4.63% 30/04/2013 100,000 132,004 133,413 0.02Intesa Sanpaolo SpA 4.00% 08/11/2018 100,000 113,384 134,687 0.03Italy Buoni Poliennali Del Tesoro 3.75% 01/08/2016 550,000 730,902 750,509 0.14Italy Buoni Poliennali Del Tesoro 4.75% 01/05/2017 290,000 399,352 406,645 0.08Italy Buoni Poliennali Del Tesoro 4.25% 01/03/2020 330,000 429,584 444,684 0.08Italy Buoni Poliennali Del Tesoro 5.00% 01/08/2039 4,835,000 5,364,929 6,365,141 1.19Italy Government International Bond 4.50% 31/07/2014 100,000 137,021 136,545 0.03Italy Government International Bond 6.88% 27/09/2023 190,000 218,879 219,735 0.04Telecom Italia SpA 8.25% 21/03/2016 125,000 151,639 194,712 0.04Total Italy 1.66 (2011: 1.33%) 8,854,171 1.66JapanBank of Tokyo-Mitsubishi UFJ Ltd 2.35% 23/02/2017 200,000 201,483 207,585 0.04Development Bank of Japan Inc 1.75% 17/03/2017 70,000,000 887,705 864,920 0.16Development Bank of Japan Inc 1.70% 20/09/2022 20,000,000 271,810 252,000 0.05Development Bank of Japan Inc 2.30% 19/03/2026 200,000,000 2,860,028 2,658,200 0.5Japan Finance Organization for Municipalities 2.00%09/05/2016USDUSD70,000,000 852,630 861,490 0.16Japan Government Five Year Bond 1.00% 20/06/2013 180,000,000 2,095,954 2,090,160 0.39Japan Government Forty Year Bond 2.00% 20/03/2052 10,000,000 120,805 112,050 0.02Japan Government Ten Year Bond 1.30% 20/03/2014 20,000,000 263,276 234,640 0.04Japan Government Ten Year Bond 1.50% 20/09/2014 185,000,000 2,302,388 2,190,585 0.41Japan Government Ten Year Bond 1.20% 20/06/2015 102,000,000 1,245,983 1,211,352 0.23Japan Government Ten Year Bond 1.70% 20/09/2016 150,000,000 1,980,370 1,836,000 0.34Japan Government Ten Year Bond 1.90% 20/06/2017 42,000,000 536,848 523,194 0.152
<strong>STANLIB</strong> <strong>Funds</strong> <strong>Limited</strong>Portfolio Statement (continued)<strong>STANLIB</strong> Multi-Manager Global Bond Fund as at 31 December <strong>2012</strong> (continued)Bonds continuedNominal holding Cost Market Value % of Net AssetsUSDUSDJapan (continued)Japan Government Ten Year Bond 1.70% 20/09/2017 135,000,000 1,542,941 1,673,190 0.31Japan Government Ten Year Bond 1.50% 20/09/2018 105,000,000 1,407,627 1,300,005 0.24Japan Government Ten Year Bond 1.30% 20/06/2020 130,000,000 1,541,162 1,591,460 0.3Japan Government Ten Year Bond 1.00% 20/09/2020 120,000,000 1,534,949 1,436,040 0.27Japan Government Ten Year Bond 1.20% 20/06/2021 330,000,000 4,305,091 3,995,309 0.76Japan Government Ten Year Bond 0.80% 20/09/2022 27,000,000 330,398 313,713 0.06Japan Government Thirty Year Bond 2.50% 20/09/2035 35,000,000 453,539 454,160 0.09Japan Government Thirty Year Bond 2.30% 20/12/2035 140,000,000 1,705,069 1,754,900 0.33Japan Government Thirty Year Bond 2.00% 20/09/2041 26,000,000 332,980 304,512 0.06Japan Government Twenty Year Bond 2.10% 20/06/2025 150,000,000 1,841,256 1,939,650 0.36Japan Government Twenty Year Bond 2.00% 20/12/2025 35,000,000 483,497 447,825 0.08Japan Government Twenty Year Bond 2.10% 20/06/2029 45,000,000 568,094 – –Japan Government Twenty Year Bond 2.10% 20/09/2029 25,000,000 309,682 312,875 0.06Japan Government Twenty Year Bond 1.80% 20/06/2030 9,000,000 103,200 107,181 0.02Japan Government Twenty Year Bond 1.80% 20/09/2031 38,000,000 497,635 447,336 0.08Japan Government Twenty Year Bond 1.60% 20/03/2032 30,000,000 376,215 340,620 0.06Japan Government Twenty Year Bond 1.70% 20/09/2032 30,000,000 376,702 344,220 0.06Mizuho Corporate Bank Ltd 1.55% 17/10/2017 200,000 201,186 200,341 0.04Total Japan 5.62 (2011: 9.20%) 30,005,513 5.62JerseyAnnington Repackaging No 1 Ltd 5.32% 10/01/2023 20,000 29,490 37,151 0.01Heathrow Funding Ltd 4.60% 15/02/2018 100,000 125,429 149,502 0.02Total Jersey 0.03 (2011: 0.00%) 186,653 0.03Korea, Republic of (South Korea)Export-Import Bank of Korea 8.13% 21/01/2014 150,000 160,819 160,875 0.03Export-Import Bank of Korea 5.88% 14/01/2015 550,000 585,015 601,420 0.11Export-Import Bank of Korea 4.00% 29/01/2021 150,000 138,614 160,899 0.03Export-Import Bank of Korea 5.00% 11/04/2022 500,000 552,615 576,877 0.11Korea Monetary Stabilization Bond 3.59% 02/10/2013 1,600,000,000 1,391,893 1,502,400 0.28Korea Treasury Bond 3.00% 10/12/2013 1,105,000,000 985,107 1,034,284 0.19Korea Treasury Bond 4.25% 10/09/2014 1,700,000,000 1,463,258 1,649,000 0.31Korea Treasury Bond 4.50% 10/03/2015 750,000,000 665,901 736,500 0.14Korea Treasury Bond 5.50% 10/09/2017 700,000,000 659,698 737,100 0.14Korea Treasury Bond 5.75% 10/09/2018 5,288,400,000 4,991,284 5,714,464 1.06Korea Treasury Bond 5.00% 10/06/2020 700,000,000 651,432 735,000 0.14Korea Treasury Bond 4.00% 10/12/2031 500,000,000 440,248 516,000 0.1Total Korea, Republic of (South Korea) 2.64 (2011: 2.22%) 14,124,819 2.64LithuaniaLithuania Government International Bond 5.13% 14/09/2017 245,000 255,983 276,084 0.05Total Lithuania 0.05 (2011: 0.04%) 276,084 0.05LuxembourgArcelorMittal 7.25% 01/03/2041 47,000 41,417 43,548 0.0153
<strong>STANLIB</strong> <strong>Funds</strong> <strong>Limited</strong>Portfolio Statement (continued)<strong>STANLIB</strong> Multi-Manager Global Bond Fund as at 31 December <strong>2012</strong> (continued)Bonds continuedNominal holding Cost Market Value % of Net AssetsUSDUSDLuxembourg (continued)Calcipar SA 6.88% 01/05/2018 16,000 15,076 16,315 0ConvaTec Healthcare E SA 10.50% 15/12/2018 20,000 21,629 21,950 0Covidien International Finance SA 6.55% 15/10/2037 50,000 61,111 69,996 0.01Gazprom Neft OAO Via GPN Capital SA 4.38% 19/09/2022 350,000 352,235 357,874 0.08Gazprom OAO Via Gaz Capital SA 8.15% 11/04/2018 200,000 208,719 246,759 0.05Glencore Finance Europe SA 4.13% 03/04/2018 100,000 138,296 142,611 0.03Intelsat Jackson Holdings SA 7.25% 01/04/2019 20,000 20,000 21,500 0Intelsat Jackson Holdings SA 7.25% 15/10/2020 41,000 42,895 44,280 0.01Intelsat Jackson Holdings SA 6.63% 15/12/2022 11,000 10,963 11,358 0Intelsat Luxembourg SA 11.50% 04/02/2017 10,000 10,091 10,575 0Silver II Borrower 7.75% 15/12/2020 9,000 9,343 9,315 0Telecom Italia Capital SA 5.25% 01/10/2015 150,000 154,700 159,637 0.03Wind Acquisition Finance SA 7.25% 15/02/2018 3,000 2,997 3,042 0Total Luxembourg 0.22 (2011: 3.07%) 1,158,760 0.22MalaysiaMalaysia Government Bond 5.09% 30/04/2014 1,150,000 378,403 386,134 0.07Malaysia Government Bond 3.74% 27/02/2015 6,480,000 2,131,185 2,148,645 0.4Malaysia Government Bond 4.26% 15/09/2016 2,000,000 671,425 679,428 0.13Malaysia Government Bond 3.58% 28/09/2018 675,000 215,336 223,339 0.04Malaysia Government Bond 3.89% 15/03/2027 550,000 177,784 183,658 0.03Malaysia Govt Bond 3.7% 25/02/2013 3.70% 25/02/2013 12,170,000 4,009,579 3,983,545 0.76Petronas Capital Ltd 5.25% 12/08/2019 150,000 158,661 178,670 0.03Total Malaysia 1.46 (2011: 1.55%) 7,783,419 1.46MexicoAmerica Movil SAB de CV 3.75% 28/06/2017 100,000 143,144 146,592 0.03America Movil SAB de CV 5.00% 30/03/2020 100,000 108,131 116,383 0.02America Movil SAB de CV 6.38% 01/03/2035 200,000 246,242 258,500 0.05Grupo Televisa SAB 6.63% 18/03/2025 100,000 122,038 129,199 0.02Mexican Bonos 8.00% 19/12/2013 4,950,000 448,221 393,436 0.07Mexican Bonos 9.50% 18/12/2014 7,500,000 608,849 628,628 0.12Mexican Bonos 8.00% 17/12/2015 26,680,000 2,273,231 2,226,980 0.43Mexican Bonos 5.00% 15/06/2017 4,000,000 312,560 306,320 0.06Mexican Bonos 7.75% 14/12/2017 3,300,000 273,495 282,863 0.05Mexican Bonos 8.00% 11/06/2020 4,500,000 367,397 406,652 0.08Mexican Bonos 6.50% 10/06/2021 7,500,000 618,366 624,165 0.12Mexican Bonos 10.00% 05/12/2024 14,000,000 841,768 1,508,570 0.28Mexican Bonos 8.50% 31/05/2029 35,500,000 3,140,227 3,440,659 0.65Mexican Bonos 10.00% 20/11/2036 5,000,000 544,443 556,545 0.1Mexican Bonos 8.50% 18/11/2038 2,400,000 209,655 233,551 0.04Mexico Government International Bond 5.88% 17/02/2014 174,000 190,334 182,961 0.03Mexico Government International Bond 5.95% 19/03/2019 100,000 124,084 123,000 0.02Mexico Government International Bond 3.63% 15/03/2022 450,000 469,220 490,390 0.0954
<strong>STANLIB</strong> <strong>Funds</strong> <strong>Limited</strong>Portfolio Statement (continued)<strong>STANLIB</strong> Multi-Manager Global Bond Fund as at 31 December <strong>2012</strong> (continued)Bonds continuedMexico (continued)Nominal holding Cost Market Value % of Net AssetsMexico Government International Bond 4.75% 08/03/2044 200,000 205,271 224,243 0.04Petroleos Mexicanos 5.50% 21/01/2021 450,000 503,767 524,541 0.1Petroleos Mexicanos 4.88% 24/01/2022 200,000 225,895 223,650 0.04Total Mexico 2.44 (2011: 2.12%) 13,027,828 2.44NetherlandsAbn Amro Bank NV 3.25% 18/01/2013 100,000 126,823 131,984 0.02ABN AMRO Bank NV 4.75% 11/01/2019 100,000 134,326 154,301 0.03Allianz Finance II BV 4.00% 23/11/2016 50,000 56,349 74,093 0.01Allianz Finance II BV 4.75% 22/07/2019 100,000 140,010 157,728 0.03Bank Nederlandse Gemeenten 3.75% 16/12/2013 100,000 132,214 136,343 0.03Bank Nederlandse Gemeenten 1.38% 23/03/2015 220,000 219,270 223,285 0.04Bank Nederlandse Gemeenten 3.88% 26/05/2023 200,000 292,586 310,595 0.06BMW Finance NV 8.88% 19/09/2013 70,000 91,988 97,797 0.02Cooperatieve Centrale Raiffeisen-Boerenleenbank BA/Australia 6.75% 03/07/2014Cooperatieve Centrale Raiffeisen-Boerenleenbank BA/Netherlands 4.38% 22/01/2014Cooperatieve Centrale Raiffeisen-Boerenleenbank BA/Netherlands 4.75% 15/01/2020USDUSD100,000 105,306 108,734 0.02100,000 132,848 137,268 0.03150,000 156,247 171,657 0.03Deutsche Bahn Finance BV 1.65% 01/12/2014 73,000,000 844,452 867,021 0.16Deutsche Telekom International Finance BV 4.00%19/01/2015Deutsche Telekom International Finance BV 6.63%29/03/2018Deutsche Telekom International Finance BV 4.25%16/03/2020215,000 309,684 301,097 0.06100,000 155,281 166,172 0.0350,000 64,166 76,274 0.01E.ON International Finance BV 6.38% 29/05/2017 50,000 79,152 80,673 0.02E.ON International Finance BV 5.50% 02/10/2017 35,000 49,970 55,044 0.01E.ON International Finance BV 6.65% 30/04/2038 50,000 60,566 68,373 0.01Enel Finance International NV 3.88% 07/10/2014 275,000 277,371 283,292 0.05Enel Finance International NV 5.00% 14/09/2022 50,000 67,204 69,702 0.01Generali Finance BV 6.21% 29/06/2049 50,000 50,537 65,811 0.01Heineken NV 0.80% 01/10/2015 150,000 150,280 149,807 0.03ING Bank NV 3.88% 23/12/2016 100,000 155,607 173,077 0.03ING Bank NV 3.38% 11/01/2018 100,000 130,851 147,205 0.03ING Groep NV 4.75% 31/05/2017 85,000 125,225 128,245 0.02JP Morgan Structured Products BV 7.50% 19/03/2018 9,650,000 327,757 330,590 0.06KazMunaiGaz Finance Sub BV 9.13% 02/07/2018 100,000 106,878 132,250 0.02Koninklijke KPN NV 7.50% 04/02/2019 110,000 135,720 184,293 0.03LyondellBasell Industries NV 6.00% 15/11/2021 105,000 112,972 123,375 0.02LyondellBasell Industries NV 5.75% 15/04/2024 10,000 10,047 11,785 0Nederlandse Waterschapsbank NV 4.38% 22/01/2018 100,000 137,362 154,504 0.03Netherlands Government Bond 4.25% 15/07/2013 625,000 867,625 842,096 0.16Netherlands Government Bond 3.25% 15/07/2015 1,300,000 1,739,667 1,851,473 0.35Netherlands Government Bond 4.00% 15/07/2016 1,622,000 2,352,642 2,421,288 0.4655
<strong>STANLIB</strong> <strong>Funds</strong> <strong>Limited</strong>Portfolio Statement (continued)<strong>STANLIB</strong> Multi-Manager Global Bond Fund as at 31 December <strong>2012</strong> (continued)Bonds continuedNetherlands (continued)Nominal holding Cost Market Value % of Net AssetsNetherlands Government Bond 3.50% 15/07/2020 1,925,000 2,775,359 2,972,165 0.57Netherlands Government Bond 3.25% 15/07/2021 480,000 686,257 730,728 0.14Netherlands Government Bond 4.00% 15/01/2037 260,000 398,717 456,316 0.09NXP BV 9.75% 01/08/2018 10,000 10,293 11,650 0RWE Finance BV 5.50% 06/07/2022 50,000 79,298 95,807 0.02Schaeffler Finance BV 8.50% 15/02/2019 46,000 49,883 51,980 0.01Shell International Finance BV 4.00% 21/03/2014 175,000 182,768 182,730 0.03Shell International Finance BV 4.38% 25/03/2020 100,000 114,180 115,901 0.02Shell International Finance BV 3.63% 21/08/2042 90,000 93,119 89,066 0.02Siemens Financieringsmaatschappij NV 5.25% 14/09/2066 100,000 133,175 146,329 0.03Telefonica Europe BV 5.88% 14/02/2033 50,000 63,729 72,922 0.01TenneT Holding BV 4.50% 09/02/2022 50,000 66,309 77,927 0.01Total Netherlands 2.88 (2011: 2.39%) 15,390,753 2.88New ZealandNew Zealand Government Bond 6.00% 15/04/2015 35,000 23,659 31,087 0.01New Zealand Government Bond 6.00% 15/12/2017 350,000 309,885 329,683 0.06New Zealand Government Bond 5.00% 15/03/2019 2,470,000 2,088,851 2,255,915 0.42New Zealand Government Bond 6.00% 15/05/2021 1,170,000 962,645 1,149,099 0.22New Zealand Government Bond 5.50% 15/04/2023 2,425,000 2,250,977 2,335,959 0.43Total New Zealand 1.14 (2011: 0.95%) 6,101,743 1.14NorwayDNB Bank ASA 3.88% 29/06/2020 150,000 204,762 225,751 0.04DNB Boligkreditt AS 2.38% 11/04/2017 50,000 65,675 70,320 0.01Norway Government Bond 4.25% 19/05/2017 5,700,000 1,061,181 1,142,930 0.21Norway Government Bond 4.50% 22/05/2019 10,410,000 2,122,697 2,177,115 0.41SpareBank 1 Boligkreditt AS 3.38% 07/09/2021 100,000 134,508 148,694 0.03SpareBank 1 SR Bank ASA 3.50% 21/04/2016 50,000 68,347 70,734 0.01Statoil ASA 5.13% 30/04/2014 100,000 109,800 106,350 0.02Statoil ASA 1.20% 17/01/2018 30,000 29,966 30,025 0.01Statoil ASA 5.25% 15/04/2019 40,000 48,668 47,584 0.01Statoil ASA 2.45% 17/01/2023 30,000 29,904 29,840 0.01Total Norway 0.76 (2011: 1.34%) 4,049,343 0.76PanamaPanama Government International Bond 6.70% 26/01/2036 125,000 167,810 176,303 0.03Total Panama 0.03 (2011: 0.00%) 176,303 0.03PeruPeruvian Government International Bond 7.35% 21/07/2025 300,000 394,813 432,750 0.08Total Peru 0.08 (2011: 0.04%) 432,750 0.08PhilippinesPower Sector Assets & Liabilities Management Corp 7.25%27/05/2019USDUSD100,000 99,130 128,358 0.02Total Philippines 0.02 (2011: 0.03%) 128,358 0.0256
<strong>STANLIB</strong> <strong>Funds</strong> <strong>Limited</strong>Portfolio Statement (continued)<strong>STANLIB</strong> Multi-Manager Global Bond Fund as at 31 December <strong>2012</strong> (continued)Bonds continuedPolandNominal holding Cost Market Value % of Net AssetsPoland Government Bond 5.25% 25/04/2013 1,570,000 517,459 510,305 0.1Poland Government Bond 5.00% 24/10/2013 1,600,000 511,162 524,501 0.1Poland Government Bond 5.75% 25/04/2014 3,825,000 1,255,850 1,277,198 0.24Poland Government Bond 5.25% 25/10/2017 7,615,000 2,512,370 2,678,546 0.5Poland Government Bond 5.25% 25/10/2020 10,945,000 3,475,468 3,956,628 0.74Poland Government Bond 5.75% 25/10/2021 4,525,000 1,517,431 1,694,581 0.32Poland Government Bond 5.75% 23/09/2022 17,750,000 6,054,118 6,721,605 1.25Poland Government International Bond 6.38% 15/07/2019 325,000 352,035 405,178 0.08Poland Government International Bond 5.13% 21/04/2021 80,000 94,637 94,880 0.02Poland Government International Bond 5.25% 20/01/2025 250,000 343,911 400,345 0.07Total Poland 3.42 (2011: 2.12%) 18,263,767 3.42QatarQatar Government International Bond 9.75% 15/06/2030 50,000 80,206 90,065 0.02Ras Laffan Liquefied Natural Gas Co Ltd III 5.50% 30/09/2014 250,000 270,030 268,877 0.05Total Qatar 0.07 (2011: 0.00%) 358,942 0.07RomaniaRomanian Government International Bond 6.75%07/02/2022USDUSD200,000 231,218 242,525 0.05Total Romania 0.05 (2011: 0.00%) 242,525 0.05RussiaRussian Foreign Bond - Eurobond 7.85% 10/03/2018 10,000,000 352,173 356,290 0.07Russian Foreign Bond - Eurobond 7.50% 31/03/2030 694,875 728,017 892,011 0.16Total Russia 0.23 (2011: 0.13%) 1,248,301 0.23SingaporeSingapore Government Bond 3.63% 01/07/2014 800,000 708,934 688,293 0.13Singapore Government Bond 4.00% 01/09/2018 850,000 810,676 832,416 0.16Singapore Government Bond 3.25% 01/09/2020 140,000 117,416 133,169 0.02Singapore Government Bond 2.25% 01/06/2021 800,000 697,123 712,340 0.13Total Singapore 0.44 (2011: 0.60%) 2,366,218 0.44SupernationalAsian Development Bank 2.35% 21/06/2027 10,000,000 143,553 132,290 0.02Council Of Europe Development Bank 5.75% 16/09/2014 125,000 132,212 134,652 0.03European Financial Stability Facility 2.00% 15/05/2017 200,000 257,825 277,504 0.05European Financial Stability Facility 2.25% 05/09/2022 200,000 261,717 273,866 0.05European Investment Bank 4.25% 15/07/2013 300,000 319,303 305,791 0.06European Investment Bank 1.63% 15/01/2015 150,000 195,440 203,802 0.04European Investment Bank 1.63% 15/06/2017 150,000 149,892 154,711 0.03European Investment Bank 1.00% 15/12/2017 300,000 300,538 299,914 0.06European Investment Bank 2.63% 15/03/2018 200,000 251,896 288,974 0.05European Investment Bank 4.63% 15/04/2020 675,000 987,600 1,093,545 0.2European Investment Bank 4.50% 15/10/2025 200,000 304,218 330,832 0.06European Investment Bank 1.90% 26/01/2026 26,000,000 259,953 316,238 0.0657
<strong>STANLIB</strong> <strong>Funds</strong> <strong>Limited</strong>Portfolio Statement (continued)<strong>STANLIB</strong> Multi-Manager Global Bond Fund as at 31 December <strong>2012</strong> (continued)Bonds continuedSupernational (continued)Nominal holding Cost Market Value % of Net AssetsEuropean Investment Bank 2.15% 18/01/2027 119,000,000 1,335,265 1,472,387 0.28European Investment Bank 6.00% 07/12/2028 115,000 200,586 252,821 0.05European Union 3.63% 06/04/2016 100,000 134,788 146,157 0.03European Union 2.75% 04/04/2022 250,000 335,555 362,830 0.07Inter-American Development Bank 3.88% 17/09/2019 250,000 281,737 291,409 0.05International Bank for Reconstruction & Development 0.55%25/04/2014International Bank for Reconstruction & Development 3.88%20/05/2019USDUSD200,000 200,496 200,000 0.04270,000 383,078 421,809 0.08Nordic Investment Bank 1.70% 27/04/2017 180,000,000 2,277,288 2,225,881 0.41Total Supernational 1.72 (2011: 1.21%) 9,185,413 1.72South AfricaSouth Africa Government Bond 8.75% 21/12/2014 3,940,000 481,426 496,294 0.09South Africa Government Bond 6.75% 31/03/2021 24,425,000 3,100,193 2,948,440 0.56South Africa Government Bond 6.50% 28/02/2041 13,875,000 1,311,985 1,340,283 0.25Total South Africa 0.90 (2011: 1.14%) 4,785,017 0.9SpainAyt Cedulas Cajas Global 4.00% 21/03/2017 100,000 113,401 122,722 0.02AyT Cedulas Cajas VIII Fondo de Titulizacion de Activos4.00% 18/11/2014100,000 120,855 128,240 0.02Banco Bilbao Vizcaya Argentaria SA 3.00% 09/10/2014 100,000 130,372 132,180 0.02Banco Bilbao Vizcaya Argentaria SA 4.25% 18/01/2017 100,000 124,987 137,346 0.03Banco Financiero y de Ahorros SA 3.13% 21/01/2015 100,000 121,516 129,165 0.02Banco Santander SA 3.88% 06/02/2026 100,000 107,036 123,066 0.02Bankia SA 4.25% 05/07/2016 50,000 62,562 63,357 0.01BBVA Senior Finance SAU 4.88% 15/04/2016 100,000 143,476 137,741 0.03CaixaBank 3.75% 26/05/2014 50,000 63,995 66,901 0.01Catalunya Banc SA 3.00% 29/10/2014 100,000 124,745 128,991 0.02Cedulas TDA 4.13% 29/11/2019 100,000 103,899 112,625 0.02IM Cedulas 9 4.25% 09/06/2016 100,000 121,002 122,328 0.02Instituto de Credito Oficial 3.88% 31/10/2014 100,000 127,698 133,325 0.02Instituto de Credito Oficial 4.38% 20/05/2019 150,000 187,638 191,143 0.04Santander Issuances SAU 5.91% 20/06/2016 100,000 105,097 102,500 0.02Spain Government Bond 3.30% 31/10/2014 150,000 195,801 198,866 0.04Spain Government Bond 3.80% 31/01/2017 510,000 647,487 668,252 0.14Spain Government Bond 5.50% 30/07/2017 290,000 396,125 402,472 0.08Spain Government Bond 4.80% 31/01/2024 100,000 132,117 124,113 0.02Spain Government Bond 4.70% 30/07/2041 120,000 141,860 134,817 0.03Telefonica Emisiones SAU 5.50% 01/04/2016 100,000 135,105 144,335 0.03Total Spain 0.66 (2011: 1.11%) 3,504,485 0.66SwedenNordea Bank AB 4.88% 27/01/2020 150,000 155,492 172,853 0.03Nordea Hypotek AB 4.25% 19/06/2013 1,800,000 272,027 280,451 0.0558
<strong>STANLIB</strong> <strong>Funds</strong> <strong>Limited</strong>Portfolio Statement (continued)<strong>STANLIB</strong> Multi-Manager Global Bond Fund as at 31 December <strong>2012</strong> (continued)Bonds continuedSweden (continued)Nominal holding Cost Market Value % of Net AssetsNordea Hypotek AB 4.00% 18/06/2014 1,800,000 264,691 287,377 0.05Skandinaviska Enskilda Banken AB 3.00% 20/01/2016 100,000 132,612 141,538 0.03Stadshypotek AB 3.00% 01/10/2014 75,000 99,212 103,519 0.02Stadshypotek AB 1.88% 21/03/2017 200,000 253,680 276,278 0.05Svenska Handelsbanken AB 3.63% 16/02/2016 100,000 133,987 143,018 0.03Swedbank Hypotek AB 6.75% 05/05/2014 1,400,000 210,018 230,710 0.04Sweden Government Bond 6.75% 05/05/2014 100,000 16,427 16,594 0Sweden Government Bond 4.50% 12/08/2015 10,000,000 1,699,022 1,681,730 0.32Sweden Government Bond 3.75% 12/08/2017 9,110,000 1,511,556 1,574,909 0.3Sweden Government Bond 4.25% 12/03/2019 3,300,000 554,272 598,904 0.11Sweden Government Bond 3.50% 01/06/2022 15,530,000 2,678,840 2,795,322 0.53Sweden Government Bond 3.50% 30/03/2039 350,000 59,063 66,540 0.01Vattenfall AB 5.25% 29/06/2049 50,000 63,691 69,883 0.01Volvo Treasury AB 5.00% 31/05/2017 150,000 192,808 226,214 0.04Total Sweden 1.62 (2011: 1.27%) 8,665,840 1.62SwitzerlandPfandbriefbank der schweizerischen HypothekarinstituteAG 2.38% 30/10/2019USDUSD100,000 101,897 121,893 0.02Switzerland Government Bond 4.00% 11/02/2023 700,000 965,892 1,024,911 0.2UBS AG/Jersey 4.50% 16/09/2019 50,000 64,427 67,239 0.01UBS AG/london 2.38% 21/01/2013 75,000 95,404 98,956 0.02UBS AG/Stamford CT 5.75% 25/04/2018 150,000 164,889 177,503 0.03UBS AG/Stamford CT 4.88% 04/08/2020 285,000 293,363 329,783 0.06Total Switzerland 0.34 (2011: 0.13%) 1,820,285 0.34ThailandThailand Government Bond 5.25% 12/05/2014 5,000,000 162,436 168,650 0.03Thailand Government Bond 3.25% 16/06/2017 8,000,000 252,248 263,856 0.05Thailand Government Bond 5.67% 13/03/2028 4,500,000 168,901 175,955 0.03Total Thailand 0.11 (2011: 0.00%) 608,461 0.11TurkeyExport Credit Bank of Turkey 5.88% 24/04/2019 250,000 275,258 284,780 0.05Total Turkey 0.05 (2011: 0.00%) 284,780 0.05United Arab EmiratesAbu Dhabi National Energy Co 5.88% 27/10/2016 250,000 284,718 282,564 0.05Abu Dhabi National Energy Co 6.17% 25/10/2017 400,000 448,683 469,102 0.09Total United Arab Emirates 0.14 (2011: 0.00%) 751,666 0.14United KingdomAbbey National Treasury Services Plc/London 3.63%14/10/201675,000 96,131 108,628 0.02Aviva Plc 6.88% 22/05/2038 50,000 55,573 71,807 0.01Bank of Scotland Plc 4.75% 08/06/2022 100,000 143,316 163,956 0.03Barclays Bank Plc 3.50% 18/03/2015 100,000 127,685 139,385 0.0359
<strong>STANLIB</strong> <strong>Funds</strong> <strong>Limited</strong>Portfolio Statement (continued)<strong>STANLIB</strong> Multi-Manager Global Bond Fund as at 31 December <strong>2012</strong> (continued)Bonds continuedNominal holding Cost Market Value % of Net AssetsUSDUSDUnited Kingdom (continued)Barclays Bank Plc 2.25% 22/02/2017 100,000 132,062 139,709 0.03Barclays Bank Plc 5.13% 08/01/2020 270,000 259,260 307,681 0.06Barclays Bank Plc 5.14% 14/10/2020 100,000 101,166 104,287 0.02BAT International Finance Plc 7.25% 12/03/2024 50,000 85,306 110,225 0.02BMW UK Capital Plc 5.00% 02/10/2017 100,000 160,251 184,474 0.03BP Capital Markets Plc 4.50% 01/10/2020 100,000 103,772 115,210 0.02British Sky Broadcasting Group Plc 3.13% 26/11/2022 280,000 278,892 278,695 0.05British Telecommunications Plc 6.38% 23/06/2037 50,000 90,176 100,750 0.02Canary Wharf Finance II Plc 6.46% 22/10/2033 25,000 39,604 50,784 0.01Centrica Plc 6.38% 10/03/2022 50,000 95,047 103,360 0.02HSBC Bank Plc 3.50% 28/06/2015 150,000 153,190 159,155 0.03HSBC Bank Plc 4.75% 19/01/2021 255,000 294,705 292,359 0.05HSBC Holdings Plc 4.00% 30/03/2022 40,000 43,813 43,576 0.01HSBC Holdings Plc 6.50% 20/05/2024 50,000 81,174 105,628 0.02Imperial Tobacco Finance Plc 8.38% 17/02/2016 230,000 283,579 368,010 0.07Imperial Tobacco Finance Plc 9.00% 17/02/2022 50,000 100,661 115,098 0.02Lloyds TSB Bank Plc 6.50% 24/03/2020 400,000 492,323 600,892 0.11Lloyds TSB Bank Plc 6.96% 29/05/2020 50,000 74,785 80,660 0.02Lloyds TSB Bank Plc 6.38% 21/01/2021 100,000 123,377 123,085 0.02National Grid Plc 6.30% 01/08/2016 170,000 195,622 197,957 0.04National Grid Plc 5.00% 02/07/2018 200,000 282,398 313,201 0.06Nationwide Building Society 4.38% 28/02/2022 50,000 63,494 80,567 0.02Network Rail Infrastructure Finance Plc 4.63% 21/07/2020 125,000 199,374 245,064 0.05Northern Rock Asset Management Plc 3.63% 28/03/2013 50,000 63,490 66,389 0.01PPL WEM Holdings Plc 5.38% 01/05/2021 100,000 103,817 112,589 0.02Rio Tinto Finance USA Plc 2.88% 21/08/2022 80,000 80,858 80,424 0.02Royal Bank of Scotland Plc 5.50% 23/03/2020 300,000 377,758 476,495 0.09SABMiller Plc 5.70% 15/01/2014 185,000 183,066 194,549 0.04SABMiller Plc 6.50% 15/07/2018 400,000 496,161 496,935 0.09South Eastern Power Networks Plc 5.50% 05/06/2026 50,000 90,085 96,050 0.02SSE Plc 5.00% 01/10/2018 50,000 79,289 93,030 0.02Standard Chartered Bank 5.88% 26/09/2017 100,000 146,068 153,424 0.03Standard Chartered Bank 6.40% 26/09/2017 450,000 363,538 523,967 0.1Standard Chartered Bank 9.50% 29/06/2049 100,000 112,552 110,491 0.02Tesco Plc 5.50% 13/01/2033 275,000 388,472 516,448 0.1United Kingdom Gilt 4.50% 07/03/2013 6,480,000 10,648,384 10,605,653 1.98United Kingdom Gilt 2.25% 07/03/2014 260,000 415,288 431,960 0.08United Kingdom Gilt 5.00% 07/09/2014 330,000 576,981 578,188 0.11United Kingdom Gilt 2.00% 22/01/2016 50,000 79,649 84,947 0.02United Kingdom Gilt 4.00% 07/09/2016 855,000 1,472,173 1,563,493 0.28United Kingdom Gilt 1.00% 07/09/2017 250,000 404,785 408,966 0.08United Kingdom Gilt 4.50% 07/03/2019 790,000 1,494,885 1,544,409 0.2960
<strong>STANLIB</strong> <strong>Funds</strong> <strong>Limited</strong>Portfolio Statement (continued)<strong>STANLIB</strong> Multi-Manager Global Bond Fund as at 31 December <strong>2012</strong> (continued)Bonds continuedUnited Kingdom (continued)Nominal holding Cost Market Value % of Net AssetsUnited Kingdom Gilt 3.75% 07/09/2019 770,000 1,304,896 1,454,870 0.27United Kingdom Gilt 3.75% 07/09/2021 582,000 1,030,865 1,110,156 0.21United Kingdom Gilt 5.00% 07/03/2025 592,000 1,097,432 1,269,244 0.24United Kingdom Gilt 4.25% 07/12/2027 195,000 303,054 392,658 0.07United Kingdom Gilt 4.75% 07/12/2030 250,000 400,711 532,260 0.1United Kingdom Gilt 4.50% 07/09/2034 115,000 181,564 236,932 0.04United Kingdom Gilt 4.25% 07/03/2036 506,000 849,382 1,005,654 0.19United Kingdom Gilt 4.75% 07/12/2038 665,000 1,343,819 1,423,594 0.27United Kingdom Gilt 4.25% 07/12/2040 510,000 943,303 1,010,536 0.19United Kingdom Gilt 4.25% 07/12/2049 385,000 699,794 767,737 0.14United Kingdom Gilt 4.25% 07/12/2055 300,000 456,480 605,454 0.11Vodafone Group Plc 5.45% 10/06/2019 100,000 109,273 121,660 0.02Total United Kingdom 6.14 (2011: 6.86%) 32,773,365 6.14United StatesAbbVie Inc 1.75% 06/11/2017 30,000 29,939 30,276 0.01AbbVie Inc 2.00% 06/11/2018 200,000 198,972 201,962 0.04AbbVie Inc 2.90% 06/11/2022 50,000 50,141 50,895 0.01AbbVie Inc 4.40% 06/11/2042 30,000 29,691 31,955 0.01Access Midstream Partners LP / ACMP Finance Corp 4.88%15/05/2023USDUSD21,000 21,100 21,368 0Actuant Corp 5.63% 15/06/2022 – – – –Actuant Corp 5.63% 15/06/2022 8,000 8,000 8,320 0ADS Tactical Inc 11.00% 01/04/2018 20,000 20,000 20,400 0Aetna Inc 2.75% 15/11/2022 90,000 88,501 88,771 0.02Allison Transmission Inc 7.13% 15/05/2019 20,000 20,682 21,500 0Allstate Corp/The 5.95% 01/04/2036 50,000 52,673 63,397 0.01Ally Financial Inc 5.50% 15/02/2017 8,000 8,066 8,560 0Ally Financial Inc 8.00% 15/03/2020 18,000 21,212 22,050 0Ally Financial Inc 7.50% 15/09/2020 59,000 66,514 71,390 0.01Alpha Natural Resources Inc 9.75% 15/04/2018 19,000 19,025 20,520 0Alpha Natural Resources Inc 6.00% 01/06/2019 4,000 3,962 3,710 0Alphabet Holding Co Inc 7.75% 01/11/2017 9,000 9,020 9,270 0Alternative Loan Trust 2005-54CB 5.50% 25/11/2035 39,944 21,385 37,903 0.01Alternative Loan Trust 2005-64CB 5.50% 25/12/2035 200,406 61,418 189,743 0.04Altria Group Inc 8.50% 10/11/2013 100,000 115,390 106,508 0.02Altria Group Inc 4.25% 09/08/2042 50,000 49,048 48,581 0.01AMC Entertainment Inc 8.75% 01/06/2019 12,000 12,884 13,290 0AMC Entertainment Inc 9.75% 01/12/2020 6,000 6,657 6,930 0AMC Networks Inc 7.75% 15/07/2021 25,000 28,254 28,563 0.01AMC Networks Inc 4.75% 15/12/2022 15,000 15,000 15,056 0American Axle & Manufacturing Inc 6.63% 15/10/2022 11,000 11,082 11,220 0American Electric Power Co Inc 1.65% 15/12/2017 80,000 79,909 80,178 0.0261
<strong>STANLIB</strong> <strong>Funds</strong> <strong>Limited</strong>Portfolio Statement (continued)<strong>STANLIB</strong> Multi-Manager Global Bond Fund as at 31 December <strong>2012</strong> (continued)Bonds continuedUnited States (continued)Nominal holding Cost Market Value % of Net AssetsAmerican Express Credit Corp 5.13% 25/08/2014 100,000 107,877 107,158 0.02American Honda Finance Corp 2.13% 28/02/2017 200,000 201,852 205,394 0.04American Municipal Power Inc 5.94% 15/02/2047 100,000 98,552 116,115 0.02AMERIGROUP Corp 7.50% 15/11/2019 14,000 14,693 16,800 0Amgen Inc 2.13% 15/05/2017 60,000 62,440 62,269 0.01Amgen Inc 5.15% 15/11/2041 50,000 49,155 56,158 0.01Amkor Technology Inc 6.63% 01/06/2021 35,000 34,558 35,000 0.01Amsurg Corp 5.63% 30/11/2020 6,000 6,000 6,240 0Anadarko Petroleum Corp 5.95% 15/09/2016 30,000 31,136 34,502 0.01Anadarko Petroleum Corp 6.38% 15/09/2017 50,000 60,473 59,634 0.01Anadarko Petroleum Corp 6.95% 15/06/2019 50,000 56,221 63,104 0.01Anheuser-Busch InBev Worldwide Inc 7.75% 15/01/2019 50,000 57,861 66,620 0.01Anheuser-Busch InBev Worldwide Inc 2.50% 15/07/2022 120,000 121,571 120,592 0.02Antero Resources Finance Corp 9.38% 01/12/2017 1,000 1,073 1,098 0Antero Resources Finance Corp 7.25% 01/08/2019 9,000 9,415 9,810 0Aon Corp 3.13% 27/05/2016 100,000 100,609 105,284 0.02Apache Corp 2.63% 15/01/2023 60,000 59,684 59,814 0.01Appalachian Power Co 4.60% 30/03/2021 85,000 94,200 97,464 0.02Arch Coal Inc 9.88% 15/06/2019 8,000 7,680 8,300 0Arch Coal Inc 7.25% 15/06/2021 10,000 9,406 9,150 0A-S Co-Issuer Subsidiary Inc 7.88% 15/12/2020 7,000 7,049 6,983 0Ashland Inc 4.75% 15/08/2022 11,000 11,146 11,413 0Ashtead Capital Inc 6.50% 15/07/2022 7,000 7,320 7,560 0AT&T Inc 0.88% 13/02/2015 100,000 100,693 100,293 0.02AT&T Inc 2.95% 15/05/2016 75,000 75,311 79,258 0.01AT&T Inc 1.40% 01/12/2017 50,000 50,071 50,114 0.01AT&T Inc 6.30% 15/01/2038 100,000 107,909 128,223 0.02AT&T Inc 5.35% 01/09/2040 255,000 310,295 295,655 0.06AT&T Inc 4.35% 15/06/2045 165,000 165,768 165,742 0.03Atmos Energy Corp 5.50% 15/06/2041 50,000 50,323 61,760 0.01Atwood Oceanics Inc 6.50% 01/02/2020 30,000 31,328 32,250 0.01AutoNation Inc 5.50% 01/02/2020 11,000 11,343 11,798 0AutoZone Inc 3.70% 15/04/2022 50,000 50,964 52,525 0.01AvalonBay Communities Inc 2.85% 15/03/2023 75,000 74,418 74,009 0.01Avis Budget Car Rental LLC 9.75% 15/03/2020 7,000 7,000 8,085 0B/E Aerospace Inc 5.25% 01/04/2022 26,000 26,541 27,560 0.01Banc of America Commercial Mortgage Trust 2006-6 5.36%10/10/2045USDUSD500,000 512,222 573,497 0.11Bank of America Corp 4.50% 01/04/2015 490,000 498,096 522,202 0.1Bank of America Corp 6.50% 01/08/2016 455,000 468,636 526,099 0.1Bank of America Corp 5.75% 01/12/2017 60,000 60,459 69,606 0.01Bank of America Corp 5.00% 13/05/2021 180,000 179,328 204,155 0.0462
<strong>STANLIB</strong> <strong>Funds</strong> <strong>Limited</strong>Portfolio Statement (continued)<strong>STANLIB</strong> Multi-Manager Global Bond Fund as at 31 December <strong>2012</strong> (continued)Bonds continuedNominal holding Cost Market Value % of Net AssetsUSDUSDUnited States (continued)Bank of America Corp 5.70% 24/01/2022 50,000 53,241 59,976 0.01Bank of New York Mellon Corp 4.60% 15/01/2020 100,000 113,186 114,326 0.02Bank One Capital III 8.75% 01/09/2030 50,000 57,743 68,604 0.01Bay Area Toll Authority 6.26% 01/04/2049 100,000 105,155 138,488 0.03Beazer Homes USA Inc 9.13% 15/05/2019 4,000 4,058 4,185 0Berkshire Hathaway Finance Corp 5.40% 15/05/2018 100,000 118,314 120,296 0.02Berkshire Hathaway Finance Corp 3.00% 15/05/2022 200,000 205,938 208,129 0.04Berry Plastics Corp 9.75% 15/01/2021 9,000 9,926 10,305 0Biogen Idec Inc 6.88% 01/03/2018 100,000 113,607 124,488 0.02BOE Merger Corp 9.50% 01/11/2017 5,000 5,024 5,000 0Bottling Group LLC 6.95% 15/03/2014 50,000 61,732 53,756 0.01Bristow Group Inc 6.25% 15/10/2022 9,000 9,283 9,630 0Brocade Communications Systems Inc 6.88% 15/01/2020 20,000 20,798 21,525 0Burlington Coat Factory Warehouse Corp 10.00% 15/02/2019 16,000 17,056 17,240 0Burlington Northern Santa Fe LLC 3.45% 15/09/2021 220,000 233,766 236,954 0.04Burlington Northern Santa Fe LLC 5.40% 01/06/2041 210,000 249,497 247,946 0.05Cablevision Systems Corp 8.00% 15/04/2020 20,000 22,343 22,550 0Caesars Entertainment Operating Co Inc 8.50% 15/02/2020 15,000 15,143 14,963 0Calpine Corp 7.50% 15/02/2021 20,000 21,258 22,100 0Cardinal Health Inc 4.63% 15/12/2020 160,000 184,228 181,753 0.03Cardtronics Inc 8.25% 01/09/2018 35,000 35,000 38,850 0.01Carrizo Oil & Gas Inc 8.63% 15/10/2018 8,000 8,335 8,640 0Case New Holland Inc 7.88% 01/12/2017 51,000 55,156 60,308 0.01Catalent Pharma Solutions Inc 7.88% 15/10/2018 7,000 7,068 7,018 0Caterpillar Inc 1.50% 26/06/2017 100,000 101,587 100,990 0.02CCO Holdings LLC 6.63% 31/01/2022 48,000 49,706 52,560 0.01CDW LLC 8.50% 01/04/2019 21,000 22,095 22,733 0Celanese US Holdings LLC 5.88% 15/06/2021 4,000 4,194 4,480 0Celanese US Holdings LLC 4.63% 15/11/2022 6,000 6,000 6,293 0CenterPoint Energy Resources Corp 4.50% 15/01/2021 60,000 68,553 68,167 0.01CenturyLink Inc 6.45% 15/06/2021 50,000 49,785 55,265 0.01Cequel Communications Holdings I LLC 6.38% 15/09/2020 18,000 18,398 18,630 0Chaparral Energy Inc 7.63% 15/11/2022 16,000 16,431 16,800 0Chesapeake Energy Corp 6.63% 15/08/2020 57,000 59,005 61,275 0.01Chevron Corp 1.10% 05/12/2017 60,000 60,000 60,412 0.01Choice Hotels International Inc 5.75% 01/07/2022 11,000 11,600 12,183 0Chrysler Group LLC 8.25% 15/06/2021 18,000 18,896 19,845 0CHS/Community Health Systems Inc 8.00% 15/11/2019 6,000 6,000 6,495 0CHS/Community Health Systems Inc 7.13% 15/07/2020 14,000 14,564 14,945 0Cimarex Energy Co 5.88% 01/05/2022 20,000 20,295 21,900 0Cinemark USA Inc 5.13% 15/12/2022 6,000 6,000 6,075 0Cisco Systems Inc 5.90% 15/02/2039 590,000 593,417 768,000 0.1463
<strong>STANLIB</strong> <strong>Funds</strong> <strong>Limited</strong>Portfolio Statement (continued)<strong>STANLIB</strong> Multi-Manager Global Bond Fund as at 31 December <strong>2012</strong> (continued)Bonds continuedNominal holding Cost Market Value % of Net AssetsUSDUSDUnited States (continued)CIT Group Inc 6.63% 01/04/2018 45,000 45,971 50,850 0.01CIT Group Inc 5.38% 15/05/2020 18,000 18,686 19,620 0CIT Group Inc 5.00% 15/08/2022 30,000 30,984 32,175 0.01Citigroup Inc 5.00% 15/09/2014 50,000 53,843 52,601 0.01Citigroup Inc 3.50% 05/08/2015 100,000 126,551 139,900 0.03Citigroup Inc 5.13% 12/12/2018 100,000 132,290 172,664 0.03Citigroup Inc 5.00% 02/08/2019 65,000 58,317 100,779 0.02Clean Harbors Inc 5.25% 01/08/2020 7,000 7,000 7,298 0Clean Harbors Inc 5.13% 01/06/2021 4,000 4,000 4,150 0Clear Channel Communications Inc 10.75% 01/08/2016 8,000 6,477 6,000 0Clear Channel Worldwide Holdings Inc 7.63% 15/03/2020 38,000 38,000 38,285 0.01Clear Channel Worldwide Holdings Inc 6.50% 15/11/2022 34,000 33,911 35,423 0Cleveland Electric Illuminating Co 5.65% 15/12/2013 175,000 189,426 182,617 0.03Cleveland Electric Illuminating Co 8.88% 15/11/2018 100,000 113,702 134,937 0.03Clorox Co 5.00% 01/03/2013 40,000 39,768 40,288 0.01Clorox Co 3.05% 15/09/2022 60,000 59,813 61,823 0.01Coca-Cola Co 0.75% 13/03/2015 100,000 100,688 100,556 0.02Columbus McKinnon Corp 7.88% 01/02/2019 6,000 5,871 6,435 0Comcast Corp 5.88% 15/02/2018 150,000 158,453 180,541 0.03Comstock Resources Inc 9.50% 15/06/2020 33,000 33,240 35,475 0.01ConAgra Foods Inc 3.25% 15/09/2022 310,000 316,572 312,781 0.06Concho Resources Inc 7.00% 15/01/2021 44,000 45,014 48,950 0.01ConocoPhillips 6.50% 01/02/2039 50,000 61,357 70,710 0.01Consol Energy Inc 6.38% 01/03/2021 10,000 10,031 10,225 0Consolidated Edison Co of New York Inc 4.20% 15/03/2042 40,000 43,566 42,492 0.01Consumers Energy Co 2.85% 15/05/2022 62,000 64,752 64,326 0.01Continental Resources Inc 7.38% 01/10/2020 2,000 2,206 2,260 0Continental Resources Inc 7.13% 01/04/2021 20,000 22,275 22,550 0Continental Resources Inc 5.00% 15/09/2022 50,000 51,273 53,750 0.01Cott Beverages Inc 8.13% 01/09/2018 11,000 11,548 12,169 0COX Communications Inc 3.25% 15/12/2022 15,000 15,065 15,503 0Credit Suisse USA Inc 4.88% 15/01/2015 200,000 215,000 215,806 0.04Cricket Communications Inc 7.75% 15/10/2020 11,000 11,199 11,248 0Crown Castle International Corp 5.25% 15/01/2023 20,000 20,369 21,300 0CSC Holdings LLC 6.75% 15/11/2021 22,000 22,590 24,530 0CSX Corp 6.25% 15/03/2018 360,000 423,911 439,320 0.08CSX Corp 3.70% 30/10/2020 100,000 99,050 107,811 0.02CSX Corp 4.10% 15/03/2044 105,000 105,979 102,951 0.02CyrusOne LP 6.38% 15/11/2022 11,000 11,125 11,468 0DaVita HealthCare Partners Inc 5.75% 15/08/2022 13,000 13,221 13,683 0Dell Inc 6.50% 15/04/2038 565,000 607,874 651,599 0.12Devon Energy Corp 5.60% 15/07/2041 50,000 52,011 59,392 0.0164
<strong>STANLIB</strong> <strong>Funds</strong> <strong>Limited</strong>Portfolio Statement (continued)<strong>STANLIB</strong> Multi-Manager Global Bond Fund as at 31 December <strong>2012</strong> (continued)Bonds continuedUnited States (continued)Nominal holding Cost Market Value % of Net AssetsDIRECTV Holdings LLC 3.13% 15/02/2016 50,000 49,969 52,306 0.01DIRECTV Holdings LLC 5.15% 15/03/2042 180,000 185,739 182,089 0.03DISH DBS Corp 6.75% 01/06/2021 29,000 29,672 32,988 0.01DISH DBS Corp 5.88% 15/07/2022 26,000 27,083 27,950 0.01Dominion Resources Inc 6.00% 30/11/2017 600,000 730,844 722,720 0.14Dow Chemical Co 4.25% 15/11/2020 250,000 276,861 276,880 0.05Dow Chemical Co 3.00% 15/11/2022 50,000 49,192 49,992 0.01DTE Electric Co 6.40% 01/10/2013 80,000 79,830 83,532 0.02Duke Energy Carolinas LLC 7.00% 15/11/2018 50,000 60,821 65,502 0.01Duke Energy Carolinas LLC 4.25% 15/12/2041 50,000 54,738 52,360 0.01Duke Energy Corp 6.25% 15/06/2018 85,000 97,018 104,132 0.02Duke Energy Corp 3.05% 15/08/2022 10,000 9,963 10,159 0E*TRADE Financial Corp 6.38% 15/11/2019 10,000 10,000 10,225 0EI du Pont de Nemours & Co 3.63% 15/01/2021 100,000 101,645 110,038 0.02El Paso LLC 6.50% 15/09/2020 91,000 97,196 102,830 0.02El Paso LLC 7.75% 15/01/2032 1,000 1,161 1,181 0Embarq Corp 8.00% 01/06/2036 220,000 231,528 241,686 0.05Enbridge Energy Partners LP 5.20% 15/03/2020 110,000 127,635 124,339 0.02Entergy Corp 4.70% 15/01/2017 40,000 43,374 43,816 0.01Enterprise Products Operating LLC 5.20% 01/09/2020 50,000 51,785 59,701 0.01Enterprise Products Operating LLC 4.05% 15/02/2022 40,000 44,793 44,098 0.01Enterprise Products Operating LLC 5.70% 15/02/2042 125,000 124,860 145,974 0.03EP Energy LLC / EP Energy Finance Inc 9.38% 01/05/2020 22,000 23,348 24,805 0EP Energy LLC / Everest Acquisition Finance Inc 6.88%01/05/2019EP Energy LLC / Everest Acquisition Finance Inc 7.75%01/09/2022USDUSD22,000 22,851 23,980 02,000 2,000 2,130 0EPE Holdings LLC / EP Energy Bond Co Inc 8.13% 15/12/2017 8,000 7,960 7,960 0EQT Corp 4.88% 15/11/2021 50,000 49,551 53,390 0.01Equinix Inc 7.00% 15/07/2021 20,000 21,939 22,200 0ERAC USA Finance LLC 5.63% 15/03/2042 225,000 252,025 246,718 0.05ERP Operating LP 4.75% 15/07/2020 175,000 201,298 197,372 0.04Exelon Corp 4.90% 15/06/2015 50,000 53,632 54,376 0.01Express Scripts Holding Co 3.13% 15/05/2016 60,000 63,949 63,283 0.01Express Scripts Holding Co 4.75% 15/11/2021 100,000 116,258 113,432 0.02Fannie Mae Pool 4.50% 17/01/2022 400,000 429,797 430,125 0.08Fannie Mae Pool 5.00% 17/01/2022 300,000 324,797 324,656 0.06Fannie Mae Pool 3.50% 01/12/2025 560,599 603,945 594,879 0.12Fannie Mae Pool 3.00% 01/01/2026 750,000 790,430 791,250 0.15Fannie Mae Pool 3.50% 01/01/2026 1,370,000 1,452,613 1,453,055 0.28Fannie Mae Pool 2.50% 11/01/2027 1,375,000 1,438,880 1,438,880 0.27Fannie Mae Pool 5.00% 01/06/2034 844,337 966,512 921,765 0.17Fannie Mae Pool 5.50% 12/01/2036 270,000 293,372 293,288 0.0565
<strong>STANLIB</strong> <strong>Funds</strong> <strong>Limited</strong>Portfolio Statement (continued)<strong>STANLIB</strong> Multi-Manager Global Bond Fund as at 31 December <strong>2012</strong> (continued)Bonds continuedUnited States (continued)Nominal holding Cost Market Value % of Net AssetsFannie Mae Pool 5.97% 01/07/2036 29,007 32,137 31,349 0.01Fannie Mae Pool 6.00% 11/01/2037 550,000 602,594 600,703 0.11Fannie Mae Pool 5.00% 01/01/2038 1,022,000 1,107,792 1,107,274 0.21Fannie Mae Pool 4.00% 15/01/2039 2,415,000 2,585,559 2,587,824 0.49Fannie Mae Pool 4.50% 25/01/2040 3,335,000 3,594,195 3,602,843 0.68Fannie Mae Pool 4.00% 01/01/2041 1,094,312 1,125,650 1,172,858 0.23Fannie Mae Pool 4.00% 01/02/2041 885,596 866,652 949,161 0.18Fannie Mae Pool 3.50% 15/10/2041 6,000,000 6,395,524 6,397,499 1.21Fannie Mae Pool 4.00% 01/06/2042 1,000,000 1,061,378 1,075,706 0.2Fannie Mae Pool 2.50% 31/12/2049 4,280,000 4,464,046 4,472,599 0.85Fannie Mae Pool 3.00% 31/12/2049 4,045,000 4,246,883 4,238,403 0.8Federal Farm Credit Banks 2.63% 17/04/2014 200,000 207,261 206,040 0.04Federal Home Loan Banks 4.13% 13/03/2020 250,000 294,848 296,088 0.06Federal Home Loan Mortgage Corp 4.50% 15/01/2014 250,000 273,477 261,085 0.05Federal Home Loan Mortgage Corp 5.25% 18/04/2016 500,000 576,792 577,386 0.11Federal Home Loan Mortgage Corp 2.38% 13/01/2022 250,000 253,446 260,656 0.05Federal National Mortgage Association 5.00% 11/05/2017 975,000 1,126,992 1,153,057 0.22FHLMC Multifamily Structured Pass Through Certificates1.32% 25/12/2018FHLMC Multifamily Structured Pass Through Certificates1.73% 25/07/2019FHLMC Multifamily Structured Pass Through Certificates1.58% 25/04/2022USDUSD25,000 25,490 25,464 025,000 25,490 25,389 050,000 50,995 50,730 0.01Fifth Third Bancorp 8.25% 01/03/2038 1,055,000 1,052,359 1,516,551 0.29First Data Corp 7.38% 15/06/2019 10,000 10,159 10,375 0First Data Corp 6.75% 01/11/2020 25,000 25,123 25,313 0First Data Corp 8.25% 15/01/2021 4,000 4,088 4,000 0First Data Corp 12.63% 15/01/2021 34,000 33,567 35,785 0.01Florida Power Corp 5.65% 15/06/2018 125,000 152,291 151,214 0.03Ford Motor Credit Co LLC 8.13% 15/01/2020 100,000 126,205 127,599 0.02Freddie Mac Gold Pool 4.50% 17/01/2022 100,000 106,758 106,344 0.02Freddie Mac Gold Pool 5.50% 17/01/2022 160,000 171,250 170,800 0.03Freddie Mac Gold Pool 4.00% 15/01/2025 650,000 689,000 687,375 0.13Freddie Mac Gold Pool 6.50% 14/01/2034 150,000 167,643 167,297 0.03Freddie Mac Gold Pool 5.00% 12/01/2036 1,180,000 1,267,394 1,269,606 0.25Freddie Mac Gold Pool 5.50% 12/01/2036 690,000 744,230 744,553 0.14Freddie Mac Gold Pool 6.00% 01/11/2037 350,000 380,680 380,297 0.07Freddie Mac Gold Pool 4.50% 15/02/2039 500,000 535,234 536,407 0.1Freddie Mac Gold Pool 3.50% 01/04/2042 610,000 629,331 660,994 0.12Freddie Mac Gold Pool 3.00% 31/12/2049 900,000 941,063 940,500 0.18Fresenius Medical Care US Finance II Inc 5.88% 31/01/2022 6,000 6,332 6,480 0Fresenius Medical Care US Finance Inc 6.50% 15/09/2018 4,000 3,947 4,470 0Fresenius Medical Care US Finance Inc 5.75% 15/02/2021 15,000 15,227 16,125 066
<strong>STANLIB</strong> <strong>Funds</strong> <strong>Limited</strong>Portfolio Statement (continued)<strong>STANLIB</strong> Multi-Manager Global Bond Fund as at 31 December <strong>2012</strong> (continued)Bonds continuedNominal holding Cost Market Value % of Net AssetsUSDUSDUnited States (continued)Frontier Communications Corp 8.50% 15/04/2020 7,000 7,830 8,033 0Frontier Communications Corp 8.75% 15/04/2022 8,000 8,880 9,180 0Frontier Communications Corp 7.13% 15/01/2023 7,000 7,000 7,429 0FTI Consulting Inc 6.00% 15/11/2022 8,000 8,000 8,280 0General Electric Capital Corp 0.94% 02/06/2014 2,220,000 2,220,000 2,230,422 0.43General Electric Capital Corp 5.40% 15/02/2017 200,000 213,037 229,598 0.04General Electric Capital Corp 2.00% 22/02/2017 20,000,000 231,467 242,480 0.05General Electric Capital Corp 2.30% 27/04/2017 100,000 100,279 103,572 0.02General Electric Capital Corp 4.65% 17/10/2021 720,000 818,330 817,677 0.15General Electric Co 4.13% 09/10/2042 115,000 116,772 118,032 0.02GenOn Energy Inc 9.50% 15/10/2018 10,000 11,461 11,850 0Georgia Power Co 4.30% 15/03/2042 50,000 51,163 52,454 0.01Gilead Sciences Inc 4.40% 01/12/2021 50,000 57,217 56,980 0.01Ginnie Mae I pool 5.50% 20/01/2035 500,000 549,375 548,594 0.1Ginnie Mae I pool 5.50% 21/11/2035 – – – –Ginnie Mae I pool 4.50% 01/11/2039 – – – –Ginnie Mae I pool 5.00% 01/01/2040 700,000 761,305 763,219 0.14Ginnie Mae I pool 4.50% 15/01/2040 1,090,000 1,186,738 1,193,549 0.23Ginnie Mae I pool 3.50% 01/01/2041 735,000 798,509 798,624 0.15Ginnie Mae II pool 3.00% 31/12/<strong>2012</strong> – – – –Ginnie Mae II pool 3.50% 31/12/<strong>2012</strong> – – – –Ginnie Mae II pool 3.00% 31/12/2049 100,000 105,891 106,281 0.02Ginnie Mae II pool 3.50% 31/12/2049 725,000 786,172 787,984 0.15GlaxoSmithKline Capital Inc 6.38% 15/05/2038 50,000 53,121 68,784 0.01Goldman Sachs Group Inc 3.30% 03/05/2015 100,000 104,466 104,161 0.02Goldman Sachs Group Inc 4.50% 30/01/2017 100,000 124,776 144,669 0.03Goldman Sachs Group Inc 6.38% 02/05/2018 50,000 56,257 79,378 0.01Goldman Sachs Group Inc 6.00% 15/06/2020 120,000 127,751 142,280 0.03Goldman Sachs Group Inc 5.25% 27/07/2021 375,000 381,164 427,057 0.08Goldman Sachs Group Inc 5.75% 24/01/2022 195,000 219,241 229,126 0.05Goldman Sachs Group Inc 6.13% 15/02/2033 50,000 51,302 58,178 0.01Goldman Sachs Group Inc 6.75% 01/10/2037 1,895,000 1,903,779 2,115,539 0.41Goodman Networks Inc 13.13% 01/07/2018 10,000 10,973 10,950 0Graphic Packaging International Inc 7.88% 01/10/2018 18,000 18,062 19,845 0Griffey Intermediate Inc 7.00% 15/10/2020 31,000 31,624 31,775 0.01GTP Towers Issuer LLC 4.44% 15/02/2015 100,000 100,000 104,117 0.02H&E Equipment Services Inc 7.00% 01/09/2022 8,000 8,259 8,500 0Halcon Resources Corp 8.88% 15/05/2021 9,000 9,069 9,563 0Hanger Inc 7.13% 15/11/2018 5,000 5,255 5,288 0Hartford Financial Services Group Inc 5.13% 15/04/2022 495,000 532,108 573,117 0.11HCA Holdings Inc 6.25% 15/02/2021 14,000 14,097 14,350 0HCA Inc 4.75% 01/05/2023 16,000 16,012 16,200 067
<strong>STANLIB</strong> <strong>Funds</strong> <strong>Limited</strong>Portfolio Statement (continued)<strong>STANLIB</strong> Multi-Manager Global Bond Fund as at 31 December <strong>2012</strong> (continued)Bonds continuedNominal holding Cost Market Value % of Net AssetsUSDUSDUnited States (continued)HCA Inc 5.88% 01/05/2023 34,000 34,431 35,105 0.01HD Supply Inc 11.50% 15/07/2020 10,000 11,242 11,225 0Health Management Associates Inc 7.38% 15/01/2020 16,000 16,605 17,240 0HealthSouth Corp 7.75% 15/09/2022 2,000 2,197 2,200 0Hertz Corp/The 7.38% 15/01/2021 35,000 36,252 38,500 0.01Hewlett-Packard Co 4.65% 09/12/2021 1,500,000 1,507,015 1,503,041 0.29Hiland Partners LP 7.25% 01/10/2020 30,000 31,196 32,100 0.01HJ Heinz Co 3.13% 12/09/2021 100,000 98,762 104,441 0.02Hologic Inc 6.25% 01/08/2020 4,000 4,147 4,300 0HSBC USA Inc 5.00% 27/09/2020 150,000 149,999 162,369 0.03Hub International Ltd 8.13% 15/10/2018 20,000 20,428 20,550 0Huntington Ingalls Industries Inc 7.13% 15/03/2021 33,000 34,434 35,888 0.01Huntsman International LLC 4.88% 15/11/2020 5,000 5,000 5,050 0IASIS Healthcare LLC 8.38% 15/05/2019 34,000 32,444 32,130 0.01Illinois Tool Works Inc 3.38% 15/09/2021 100,000 100,000 108,579 0.02IMS Health Inc 6.00% 01/11/2020 9,000 9,122 9,416 0Indiana Michigan Power Co 6.05% 15/03/2037 165,000 180,133 201,266 0.04Interface Inc 7.63% 01/12/2018 31,000 32,251 33,403 0.01Interline Brands Inc/NJ 7.50% 15/11/2018 45,000 47,270 48,375 0.01International Business Machines Corp 0.75% 11/05/2015 130,000 131,012 130,410 0.02International Business Machines Corp 5.70% 14/09/2017 100,000 121,256 120,622 0.02International Business Machines Corp 1.88% 01/08/2022 100,000 96,558 96,185 0.02International Lease Finance Corp 6.25% 15/05/2019 38,000 39,732 40,755 0.01International Lease Finance Corp 8.25% 15/12/2020 4,000 4,798 4,780 0International Lease Finance Corp 8.63% 15/01/2022 15,000 16,045 18,638 0Ipalco Enterprises Inc 5.00% 01/05/2018 12,000 11,991 12,570 0Iron Mountain Inc 5.75% 15/08/2024 1,000 1,000 1,015 0Jaguar Holding Co I 9.38% 15/10/2017 6,000 5,888 6,300 0Jersey Central Power & Light Co 5.63% 01/05/2016 85,000 96,764 96,321 0.02JM Huber Corp 9.88% 01/11/2019 15,000 14,901 16,650 0JMC Steel Group Inc 8.25% 15/03/2018 16,000 16,250 16,760 0Jo-Ann Stores Holdings Inc 9.75% 15/10/2019 2,000 1,976 2,035 0Jo-Ann Stores Inc 8.13% 15/03/2019 11,000 11,105 11,193 0John Deere Capital Corp 1.70% 15/01/2020 100,000 100,655 99,209 0.02Johnson Controls Inc 4.25% 01/03/2021 50,000 49,645 54,643 0.01JP Morgan Alternative Loan Trust 6.00% 27/12/2036 1,001,091 720,199 871,942 0.16JPMorgan Chase & Co 5.25% 14/01/2015 50,000 67,632 71,786 0.01JPMorgan Chase & Co 3.70% 20/01/2015 150,000 158,151 157,873 0.03JPMorgan Chase & Co 0% 17/03/2018 10,500,000 351,037 351,037 0.07JPMorgan Chase & Co 3.25% 23/09/2022 580,000 576,637 596,574 0.11JPMorgan Chase & Co 5.40% 06/01/2042 50,000 52,296 60,075 0.01JPMorgan Chase Bank NA 4.38% 30/11/2021 50,000 57,034 69,224 0.0168
<strong>STANLIB</strong> <strong>Funds</strong> <strong>Limited</strong>Portfolio Statement (continued)<strong>STANLIB</strong> Multi-Manager Global Bond Fund as at 31 December <strong>2012</strong> (continued)Bonds continuedNominal holding Cost Market Value % of Net AssetsUSDUSDUnited States (continued)KB Home 8.00% 15/03/2020 8,000 8,567 9,120 0KB Home 7.50% 15/09/2022 3,000 3,000 3,281 0Kimco Realty Corp 5.58% 23/11/2015 275,000 300,233 303,098 0.06Kinder Morgan Energy Partners LP 6.00% 01/02/2017 150,000 172,959 175,155 0.03Kinder Morgan Energy Partners LP 6.85% 15/02/2020 140,000 172,408 176,234 0.03Kinder Morgan Energy Partners LP 5.63% 01/09/2041 200,000 199,022 227,477 0.04Kraft Foods Group Inc 6.88% 26/01/2039 50,000 58,118 67,318 0.01Kraft Foods Group Inc 5.00% 04/06/2042 60,000 59,578 67,484 0.01Kratos Defense & Security Solutions Inc 10.00% 01/06/2017 40,000 42,016 43,800 0.01Kroger Co 3.40% 15/04/2022 50,000 50,182 51,772 0.01L-3 Communications Corp 3.95% 15/11/2016 215,000 233,113 233,008 0.04Lamar Media Corp 5.88% 01/02/2022 24,000 24,653 26,070 0Laredo Petroleum Inc 9.50% 15/02/2019 27,000 29,498 30,240 0.01Laredo Petroleum Inc 7.38% 01/05/2022 10,000 10,443 10,863 0Lear Corp 7.88% 15/03/2018 28,000 29,629 30,520 0.01Lender Processing Services Inc 5.75% 15/04/2023 11,000 11,320 11,385 0Level 3 Communications Inc 11.88% 01/02/2019 32,000 35,437 36,800 0.01Level 3 Financing Inc 9.38% 01/04/2019 23,000 22,811 25,760 0Level 3 Financing Inc 8.63% 15/07/2020 10,000 10,466 11,125 0Libbey Glass Inc 6.88% 15/05/2020 11,000 11,354 11,880 0Liberty Mutual Group Inc 5.00% 01/06/2021 50,000 49,407 54,058 0.01Liberty Mutual Group Inc 4.95% 01/05/2022 85,000 91,866 91,848 0.02Lockheed Martin Corp 3.35% 15/09/2021 100,000 99,735 105,869 0.02Lowe's Cos Inc 2.13% 15/04/2016 50,000 49,976 51,991 0.01Ltd Brands Inc 6.63% 01/04/2021 45,000 47,994 51,750 0.01MacDermid Inc 9.50% 15/04/2017 8,000 8,378 8,330 0Manitowoc Co Inc 8.50% 01/11/2020 12,000 12,568 13,470 0Marathon Petroleum Corp 6.50% 01/03/2041 70,000 70,827 88,229 0.02MarkWest Energy Partners LP 6.25% 15/06/2022 23,000 23,034 25,185 0MarkWest Energy Partners LP 5.50% 15/02/2023 10,000 9,947 10,850 0Mastr Resecuritization Trust 6.00% 27/06/2036 511,386 424,984 405,211 0.08Mastr Resecuritization Trust 6.00% 27/09/2037 420,730 389,456 375,812 0.07McDonald's Corp 3.50% 15/07/2020 100,000 111,751 110,721 0.02McDonald's Corp 2.63% 15/01/2022 100,000 100,734 102,705 0.02McKesson Corp 0.95% 04/12/2015 50,000 49,950 50,065 0.01McKesson Corp 2.70% 15/12/2022 95,000 94,893 94,656 0.02Merck & Co Inc 5.30% 01/12/2013 100,000 110,658 104,493 0.02Merck & Co Inc 5.38% 01/10/2014 400,000 583,434 571,551 0.11Merck & Co Inc 6.00% 15/09/2017 275,000 321,528 335,502 0.06Meritage Homes Corp 7.00% 01/04/2022 4,000 4,000 4,370 0Merrill Lynch & Co Inc 4.63% 14/09/2018 200,000 219,170 278,086 0.05Merrill Lynch Mortgage Trust 4.86% 12/08/2039 500,000 524,414 531,678 0.169
<strong>STANLIB</strong> <strong>Funds</strong> <strong>Limited</strong>Portfolio Statement (continued)<strong>STANLIB</strong> Multi-Manager Global Bond Fund as at 31 December <strong>2012</strong> (continued)Bonds continuedNominal holding Cost Market Value % of Net AssetsUSDUSDUnited States (continued)MetLife Inc 4.75% 08/02/2021 100,000 110,480 115,917 0.02MGM Resorts International 6.63% 15/07/2015 15,000 14,292 16,013 0MGM Resorts International 6.75% 01/10/2020 19,000 18,890 19,333 0MGM Resorts International 6.63% 15/12/2021 10,000 10,000 9,975 0MidAmerican Energy Holdings Co 5.75% 01/04/2018 100,000 112,233 120,767 0.02Momentive Performance Materials Inc 8.88% 15/10/2020 14,000 13,939 14,175 0Mondelez International Inc 6.50% 11/08/2017 100,000 123,050 121,996 0.02Monitronics International Inc 9.13% 01/04/2020 5,000 5,226 5,138 0Morgan Stanley 5.50% 02/10/2017 175,000 218,531 263,278 0.05Morgan Stanley 5.50% 28/07/2021 250,000 231,254 282,186 0.05MultiPlan Inc 9.88% 01/09/2018 22,000 24,253 24,475 0Municipal Electric Authority of Georgia 6.64% 01/04/2057 1,060,000 1,066,261 1,266,180 0.25Municipal Electric Authority of Georgia 6.66% 01/04/2057 970,000 969,827 1,151,817 0.22National CineMedia LLC 6.00% 15/04/2022 22,000 22,584 23,320 0NBCUniversal Media LLC 4.38% 01/04/2021 150,000 151,884 169,039 0.03NBCUniversal Media LLC 2.88% 15/01/2023 375,000 376,560 375,487 0.07Neff Rental LLC 9.63% 15/05/2016 20,000 20,526 20,700 0Nevada Power Co 6.50% 15/05/2018 145,000 158,979 179,669 0.03Nevada Power Co 6.50% 01/08/2018 15,000 14,139 18,884 0New York Life Global Funding 1.30% 12/01/2015 100,000 100,973 101,208 0.02News America Inc 6.90% 01/03/2019 100,000 119,187 125,876 0.02News America Inc 3.00% 15/09/2022 620,000 625,626 622,791 0.12Nielsen Finance LLC 4.50% 01/10/2020 37,000 36,820 36,815 0.01Nisource Finance Corp 6.15% 01/03/2013 46,000 47,297 46,392 0.01Nisource Finance Corp 5.25% 15/09/2017 365,000 374,835 420,880 0.08Nisource Finance Corp 5.45% 15/09/2020 420,000 469,013 493,074 0.09Norfolk Southern Corp 3.25% 01/12/2021 150,000 156,722 157,219 0.03Norfolk Southern Corp 4.84% 01/10/2041 55,000 55,000 61,376 0.01Nortek Inc 8.50% 15/04/2021 20,000 21,533 22,400 0Northwest Pipeline GP 7.00% 15/06/2016 65,000 61,140 76,983 0.01Northwest Pipeline GP 5.95% 15/04/2017 100,000 116,830 116,469 0.02Nuance Communications Inc 5.38% 15/08/2020 24,000 24,426 25,080 0Nuveen Investments Inc 9.50% 15/10/2020 9,000 9,073 8,933 0Oasis Petroleum Inc 6.88% 15/01/2023 35,000 36,008 37,581 0.01Oil States International Inc 5.13% 15/01/2023 8,000 8,000 8,080 0Omnicare Inc 7.75% 01/06/2020 32,000 33,083 35,520 0.01Omnicom Group Inc 3.63% 01/05/2022 50,000 50,327 52,062 0.01Oracle Corp 6.50% 15/04/2038 50,000 58,031 69,043 0.01Oshkosh Corp 8.25% 01/03/2017 7,000 7,675 7,718 0Pacific Gas & Electric Co 5.40% 15/01/2040 50,000 51,959 59,796 0.01PacifiCorp 5.45% 15/09/2013 135,000 136,005 139,625 0.03Peabody Energy Corp 6.00% 15/11/2018 14,000 14,207 14,840 070
<strong>STANLIB</strong> <strong>Funds</strong> <strong>Limited</strong>Portfolio Statement (continued)<strong>STANLIB</strong> Multi-Manager Global Bond Fund as at 31 December <strong>2012</strong> (continued)Bonds continuedNominal holding Cost Market Value % of Net AssetsUSDUSDUnited States (continued)Peabody Energy Corp 6.25% 15/11/2021 24,000 24,533 25,440 0Pemex Project Funding Master Trust 5.50% 24/02/2025 100,000 117,750 150,713 0.03Pemex Project Funding Master Trust 6.63% 15/06/2035 100,000 104,516 126,372 0.02Penn National Gaming Inc 8.75% 15/08/2019 18,000 20,021 20,520 0Pennsylvania Electric Co 6.05% 01/09/2017 25,000 29,283 29,296 0.01Penske Automotive Group Inc 5.75% 01/10/2022 13,000 13,135 13,423 0PepsiCo Inc 2.75% 05/03/2022 50,000 49,915 51,592 0.01PepsiCo Inc 2.50% 01/11/2022 100,000 160,970 161,543 0.03Pfizer Inc 5.75% 03/06/2021 100,000 149,962 172,234 0.03Philip Morris International Inc 5.75% 24/03/2016 50,000 71,439 76,143 0.01Phillips 66 2.95% 01/05/2017 20,000 19,997 21,149 0Physio-Control International Inc 9.88% 15/01/2019 30,000 31,829 32,850 0.01Physiotherapy Associates Holdings Inc 11.88% 01/05/2019 4,000 3,955 3,580 0Plains Exploration & Production Co 6.50% 15/11/2020 25,000 25,025 27,625 0.01Plains Exploration & Production Co 6.88% 15/02/2023 49,000 49,148 55,983 0.01PNC Financial Services Group Inc 2.85% 09/11/2022 360,000 366,007 362,240 0.07PNC Funding Corp 5.13% 08/02/2020 100,000 105,117 118,536 0.02Polypore International Inc 7.50% 15/11/2017 30,000 31,492 32,588 0.01PQ Corp 8.75% 01/05/2018 41,000 41,000 43,050 0.01Procter & Gamble Co 3.50% 15/02/2015 100,000 107,742 106,159 0.02Progress Energy Inc 4.88% 01/12/2019 665,000 773,310 764,167 0.14ProLogis LP 7.38% 30/10/2019 600,000 601,812 741,964 0.14Prudential Financial Inc 6.63% 21/06/2040 50,000 52,657 63,455 0.01Prudential Financial Inc 5.63% 12/05/2041 170,000 197,773 191,799 0.04PVH Corp 4.50% 15/12/2022 8,000 8,000 8,080 0QEP Resources Inc 5.38% 01/10/2022 29,000 29,813 31,175 0.01QEP Resources Inc 5.25% 01/05/2023 5,000 5,025 5,313 0Rabobank Capital Funding Trust IV 5.56% 29/10/2049 50,000 73,285 81,681 0.02Rain CII Carbon LLC 8.00% 01/12/2018 17,000 17,070 17,298 0Raytheon Co 2.50% 15/12/2022 283,000 282,132 278,816 0.05Reed Elsevier Capital Inc 3.13% 15/10/2022 290,000 286,180 285,063 0.06Regency Energy Partners LP 5.50% 15/04/2023 38,000 39,170 40,565 0.01Regions Financial Corp 4.88% 26/04/2013 60,000 60,675 60,600 0.01Reynolds Group Issuer Inc 7.88% 15/08/2019 22,000 22,290 24,475 0Reynolds Group Issuer Inc 9.88% 15/08/2019 17,000 16,337 18,275 0Rite Aid Corp 9.50% 15/06/2017 25,000 23,905 26,063 0Rite Aid Corp 7.70% 15/02/2027 5,000 4,457 4,275 0ROC Finance LLC 12.13% 01/09/2018 2,000 2,214 2,300 0Roche Holdings Inc 6.00% 01/03/2019 150,000 147,705 186,945 0.03Roche Holdings Inc 7.00% 01/03/2039 50,000 64,607 75,337 0.01SABMiller Holdings Inc 3.75% 15/01/2022 200,000 220,764 215,869 0.04Sally Holdings LLC 6.88% 15/11/2019 12,000 12,000 13,260 071
<strong>STANLIB</strong> <strong>Funds</strong> <strong>Limited</strong>Portfolio Statement (continued)<strong>STANLIB</strong> Multi-Manager Global Bond Fund as at 31 December <strong>2012</strong> (continued)Bonds continuedNominal holding Cost Market Value % of Net AssetsUSDUSDUnited States (continued)Sally Holdings LLC 5.75% 01/06/2022 13,000 13,812 14,105 0San Diego Gas & Electric Co 3.00% 15/08/2021 50,000 49,748 53,082 0.01SandRidge Energy Inc 7.50% 15/02/2023 7,000 7,106 7,490 0SBA Telecommunications Inc 5.75% 15/07/2020 10,000 10,441 10,600 0Sealed Air Corp 6.50% 01/12/2020 10,000 10,000 10,800 0Sealed Air Corp 8.38% 15/09/2021 9,000 10,007 10,283 0Seneca Gaming Corp 8.25% 01/12/2018 11,000 11,096 11,605 0Serta Simmons Holdings LLC 8.13% 01/10/2020 16,000 16,196 16,000 0Shearer's Foods LLC 9.00% 01/11/2019 10,000 10,195 10,500 0Sierra Pacific Power Co 6.00% 15/05/2016 280,000 275,596 324,248 0.06Simon Property Group LP 1.50% 01/02/2018 75,000 74,766 74,520 0.01SM Energy Co 6.50% 15/11/2021 30,000 30,915 32,025 0.01Sonic Automotive Inc 7.00% 15/07/2022 10,000 10,362 10,925 0Southern California Edison Co 5.95% 01/02/2038 50,000 55,628 66,371 0.01Southern California Gas Co 5.50% 15/03/2014 70,000 69,907 74,085 0.01Southern Copper Corp 6.75% 16/04/2040 50,000 54,832 59,005 0.01Southern Natural Gas Co LLC 5.90% 01/04/2017 926,000 984,376 1,086,855 0.2Southern Star Central Corp 6.75% 01/03/2016 25,000 25,437 25,438 0Spectrum Brands Escrow Corp 6.38% 15/11/2020 21,000 21,401 22,339 0Spectrum Brands Escrow Corp 6.63% 15/11/2022 6,000 6,000 6,488 0Spectrum Brands Inc 9.50% 15/06/2018 8,000 8,820 9,060 0Spectrum Brands Inc 6.75% 15/03/2020 4,000 4,000 4,280 0SPL Logistics Escrow LLC 8.88% 01/08/2020 33,000 33,992 35,228 0.01Springleaf Finance Corp 6.90% 15/12/2017 20,000 17,327 17,900 0Sprint Nextel Corp 9.00% 15/11/2018 65,000 72,584 80,275 0.02Sprint Nextel Corp 11.50% 15/11/2021 14,000 14,000 19,040 0Sprint Nextel Corp 6.00% 15/11/2022 20,000 19,926 20,550 0Starz LLC 5.00% 15/09/2019 6,000 6,122 6,150 0State of California 7.55% 01/04/2039 540,000 747,953 778,572 0.15State of California 7.63% 01/03/2040 225,000 312,910 325,058 0.06State of California 7.60% 01/11/2040 70,000 103,345 102,261 0.02STHI Holding Corp 8.00% 15/03/2018 15,000 15,423 16,238 0Synovus Financial Corp 7.88% 15/02/2019 33,000 35,655 36,465 0.01Tampa Electric Co 4.10% 15/06/2042 40,000 39,890 41,515 0.01Target Corp 6.50% 15/10/2037 100,000 118,533 138,228 0.03Taylor Morrison Communities Inc 7.75% 15/04/2020 22,000 22,073 23,403 0Tempur-Pedic International Inc 6.88% 15/12/2020 7,000 7,037 7,280 0Tenet Healthcare Corp 6.75% 01/02/2020 10,000 10,075 10,300 0Tenet Healthcare Corp 4.75% 01/06/2020 13,000 12,982 13,163 0Tennessee Valley Authority 5.25% 15/09/2039 125,000 137,648 164,029 0.03Tennessee Valley Authority 3.50% 15/12/2042 25,000 24,374 24,722 0Tesoro Logistics LP 5.88% 01/10/2020 13,000 13,339 13,488 072
<strong>STANLIB</strong> <strong>Funds</strong> <strong>Limited</strong>Portfolio Statement (continued)<strong>STANLIB</strong> Multi-Manager Global Bond Fund as at 31 December <strong>2012</strong> (continued)Bonds continuedUnited States (continued)Nominal holding Cost Market Value % of Net AssetsTeva Pharmaceutical Finance IV LLC 2.25% 18/03/2020 70,000 69,969 70,697 0.01Thermo Fisher Scientific Inc 3.60% 15/08/2021 50,000 49,906 53,042 0.01Time Warner Cable Inc 6.75% 01/07/2018 185,000 215,484 231,355 0.04Time Warner Cable Inc 5.00% 01/02/2020 195,000 225,055 226,979 0.04Time Warner Cable Inc 7.30% 01/07/2038 1,505,000 1,509,349 1,997,286 0.38Time Warner Inc 3.15% 15/07/2015 100,000 101,343 105,623 0.02Time Warner Inc 4.75% 29/03/2021 40,000 46,680 45,732 0.01Time Warner Inc 6.25% 29/03/2041 245,000 300,292 302,994 0.06Toledo Edison Co 6.15% 15/05/2037 290,000 283,639 360,711 0.07Tomkins LLC 9.00% 01/10/2018 21,000 23,210 23,625 0TransDigm Inc 5.50% 15/10/2020 21,000 21,201 21,840 0Travelers Cos Inc 5.35% 01/11/2040 50,000 47,908 62,311 0.01Truven Health Analytics Inc 10.63% 01/06/2020 9,000 9,366 9,585 0tw telecom holdings inc 5.38% 01/10/2022 8,000 8,172 8,380 0United Parcel Service Inc 1.13% 01/10/2017 100,000 101,105 100,066 0.02United Rentals North America Inc 5.75% 15/07/2018 16,000 16,389 17,240 0United Rentals North America Inc 7.38% 15/05/2020 14,000 14,416 15,330 0United Rentals North America Inc 7.63% 15/04/2022 38,000 39,476 42,465 0.01United Rentals North America Inc 6.13% 15/06/2023 8,000 8,099 8,460 0United States Cellular Corp 6.70% 15/12/2033 25,000 24,516 26,265 0United States Treasury Bill –% 07/03/2013 17,350,000 17,341,976 17,348,923 3.26United States Treasury Bill –% 14/11/2013 21,005,000 20,974,480 20,978,260 3.94United States Treasury Inflation Indexed Bonds 0.63%15/04/2013United States Treasury Inflation Indexed Bonds 0.13%15/04/2017USDUSD495,000 531,748 494,365 0.09175,000 191,061 187,332 0.04United States Treasury Note/Bond 4.25% 15/08/2013 1,325,000 1,417,621 1,358,539 0.26United States Treasury Note/Bond 3.13% 31/08/2013 330,000 348,165 336,445 0.06United States Treasury Note/Bond 0.25% 30/11/2013 650,000 649,959 650,406 0.12United States Treasury Note/Bond 1.25% 15/02/2014 4,345,000 4,405,071 4,395,240 0.83United States Treasury Note/Bond 4.00% 15/02/2014 550,000 584,508 573,289 0.11United States Treasury Note/Bond 4.13% 15/05/2015 4,450,000 4,906,110 4,849,111 0.92United States Treasury Note/Bond 0.25% 15/10/2015 1,500,000 1,494,562 1,496,483 0.29United States Treasury Note/Bond 1.38% 30/11/2015 2,275,000 2,272,689 2,341,827 0.45United States Treasury Note/Bond 2.75% 30/11/2016 950,000 1,032,075 1,031,789 0.19United States Treasury Note/Bond 0.88% 28/02/2017 2,100,000 2,120,971 2,126,906 0.41United States Treasury Note/Bond 1.00% 31/03/2017 695,000 694,976 707,163 0.13United States Treasury Note/Bond 4.50% 15/05/2017 2,440,000 2,784,503 2,849,080 0.54United States Treasury Note/Bond 0.63% 31/08/2017 505,000 504,924 504,369 0.09United States Treasury Note/Bond 1.38% 28/02/2019 1,500,000 1,529,200 1,536,094 0.3United States Treasury Note/Bond 3.63% 15/02/2020 1,780,000 1,956,934 2,077,594 0.4United States Treasury Note/Bond 3.50% 15/05/2020 1,550,000 1,602,939 1,798,484 0.35United States Treasury Note/Bond 2.13% 15/08/2021 350,000 355,163 367,610 0.0773
<strong>STANLIB</strong> <strong>Funds</strong> <strong>Limited</strong>Portfolio Statement (continued)<strong>STANLIB</strong> Multi-Manager Global Bond Fund as at 31 December <strong>2012</strong> (continued)Bonds continuedUnited States (continued)Nominal holding Cost Market Value % of Net AssetsUnited States Treasury Note/Bond 2.00% 15/02/2022 1,300,000 1,340,847 1,342,859 0.26United States Treasury Note/Bond 1.63% 15/11/2022 1,319,000 1,316,385 1,302,924 0.25United States Treasury Note/Bond 6.00% 15/02/2026 650,000 892,554 939,047 0.18United States Treasury Note/Bond 5.25% 15/02/2029 700,000 911,022 967,532 0.18United States Treasury Note/Bond 5.38% 15/02/2031 580,000 704,710 825,957 0.15United States Treasury Note/Bond 4.38% 15/02/2038 400,000 405,140 517,000 0.1United States Treasury Note/Bond 4.50% 15/05/2038 580,100 627,585 763,829 0.14United States Treasury Note/Bond 3.75% 15/08/2041 555,000 633,903 649,957 0.12United States Treasury Note/Bond 3.13% 15/02/2042 350,000 377,919 364,656 0.07United States Treasury Note/Bond 3.00% 15/05/2042 155,000 161,020 157,349 0.03United States Treasury Note/Bond 2.75% 15/08/2042 6,530,000 6,343,930 6,282,061 1.19United Technologies Corp 1.80% 01/06/2017 60,000 62,194 61,536 0.01United Technologies Corp 3.10% 01/06/2022 100,000 107,180 105,762 0.02UnitedHealth Group Inc 6.63% 15/11/2037 50,000 55,420 66,504 0.01Universal Hospital Services Inc 7.63% 15/08/2020 8,000 8,221 8,430 0Univision Communications Inc 6.88% 15/05/2019 7,000 6,949 7,245 0Univision Communications Inc 7.88% 01/11/2020 20,000 21,225 21,650 0Univision Communications Inc 8.50% 15/05/2021 5,000 5,025 5,175 0Univision Communications Inc 6.75% 15/09/2022 23,000 23,306 23,633 0US Bancorp 3.15% 04/03/2015 100,000 103,274 105,333 0.02Vail Resorts Inc 6.50% 01/05/2019 17,000 17,000 18,318 0Valeant Pharmaceuticals International 6.38% 15/10/2020 2,000 2,000 2,145 0Vanguard Health Holding Co II LLC 8.00% 01/02/2018 35,000 35,392 36,225 0.01Verizon Communications Inc 6.35% 01/04/2019 150,000 175,088 189,899 0.04Verizon Communications Inc 2.45% 01/11/2022 100,000 100,180 100,159 0.02Verizon Communications Inc 3.85% 01/11/2042 65,000 64,909 64,172 0.01Verizon New York Inc 7.38% 01/04/2032 25,000 26,469 33,090 0.01Viacom Inc 4.38% 15/03/2043 141,000 134,670 136,748 0.03Virginia Electric and Power Co 5.95% 15/09/2017 50,000 57,312 60,987 0.01Visteon Corp 6.75% 15/04/2019 45,000 45,353 48,038 0.01VPI Escrow Corp 6.38% 15/10/2020 16,000 16,551 17,160 0VWR Funding Inc 7.25% 15/09/2017 6,000 6,194 6,285 0Wachovia Bank Commercial Mortgage Trust 5.30%15/12/2044USDUSD272,000 303,611 303,182 0.06Wachovia Commercial Mortgage 4.75% 15/02/2041 259,483 270,573 267,941 0.05Wal-Mart Stores Inc 4.75% 29/01/2013 50,000 76,908 81,497 0.02Wal-Mart Stores Inc 5.63% 01/04/2040 100,000 109,235 128,727 0.02Wal-Mart Stores Inc 4.88% 08/07/2040 125,000 150,110 147,269 0.03Walt Disney Co/The 2.55% 15/02/2022 100,000 99,888 102,695 0.02Waste Management Inc 4.75% 30/06/2020 400,000 461,967 457,255 0.09WEA Finance LLC 3.38% 03/10/2022 80,000 81,922 82,226 0.02WellPoint Inc 7.00% 15/02/2019 100,000 125,281 124,528 0.0274
<strong>STANLIB</strong> <strong>Funds</strong> <strong>Limited</strong>Portfolio Statement (continued)<strong>STANLIB</strong> Multi-Manager Global Bond Fund as at 31 December <strong>2012</strong> (continued)Bonds continuedUnited States (continued)Nominal holding Cost Market Value % of Net AssetsWellPoint Inc 3.13% 15/05/2022 100,000 100,914 100,442 0.02Wells Fargo & Co 4.13% 03/11/2016 150,000 200,314 221,810 0.04Wells Fargo & Co 4.88% 29/11/2035 50,000 80,618 82,003 0.02Wells Fargo Capital X 5.95% 15/12/2036 100,000 92,941 102,500 0.02Wells Fargo Mortgage Backed Securities 2005-14 Trust5.50% 25/12/2035USDUSD123,482 111,281 129,668 0.02Whiting Petroleum Corp 6.50% 01/10/2018 1,000 1,041 1,074 0Williams Partners LP 5.25% 15/03/2020 300,000 340,437 346,117 0.06Williams Partners LP 3.35% 15/08/2022 100,000 103,642 101,562 0.02Windstream Corp 7.75% 15/10/2020 45,000 47,339 48,600 0.01Xerox Corp 2.95% 15/03/2017 100,000 102,650 102,340 0.02Zayo Group LLC 8.13% 01/01/2020 29,000 29,000 32,263 0.01Zayo Group LLC 10.13% 01/07/2020 10,000 10,599 11,375 0Total United States 34.89 (2011: 33.83%) 186,602,803 34.89UruguayUruguay Government International Bond 7.63% 21/03/2036 100,000 106,329 155,000 0.03Total Uruguay 0.03 (2011: 0.04%) 155,000 0.03VenezuelaPetroleos de Venezuela SA 8.50% 02/11/2017 200,000 143,967 194,997 0.04Venezuela Government International Bond 9.00%07/05/2023335,000 278,621 319,441 0.06Total Venezuela 0.10 (2011: 0.07%) 514,438 0.1Total Bonds 89.98 (2011: 96.65%) 480,758,702 89.98Total Investments 490,240,864 513,431,063 96.1Net current assets 20,712,557 3.9Total net assets 534,143,620 10075
<strong>STANLIB</strong> <strong>Funds</strong> <strong>Limited</strong>Portfolio Statement (continued)<strong>STANLIB</strong> Multi-Manager Global Bond Fund as at 31 December <strong>2012</strong> (continued)Bonds continuedNominal holding Cost Market Value % of Net AssetsUSDUSDSouth AfricaNew Europe Property Investments Plc 318,686 1,250,503 1,990,768 2.52Total South Africa 2.52% (2011: 0.00%) 1,990,768 2.52Total Investment Companies 2.52% (2011: 0.00%) 1,990,768 2.52Total Investments 65,855,237 76,693,454 96.98Net current assets 2,391,087 3.02Total net assets 79,084,541 100An analysis of the credit rating of the bonds held by <strong>STANLIB</strong> Multi-Manager Global Bond Fund is disclosed in note 11.<strong>STANLIB</strong> Multi-Manager Global Equity Fund at at 31 December <strong>2012</strong> (continued)Transferable securitities listed on an exchange or dealt in on another regulated market.Common StockNominal holding Cost Market Value % of Net AssetsUSDUSDAustraliaAbacus Property Group 8,379 16,088 18,790 0AGL Energy Ltd 11,509 151,624 181,618 0.01Alumina Ltd 48,708 106,803 45,513 0Amcor Ltd/Australia 43,866 236,994 366,154 0.02AMP Ltd 31,452 149,660 157,062 0.01Ansell Ltd 2,300 34,609 36,534 0Aquila Resources Ltd 4,634 26,854 12,172 0Ardent Leisure Group 17,597 16,585 26,033 0Aristocrat Leisure Ltd 6,592 19,581 21,079 0Asciano Ltd 23,344 110,311 111,484 0.01ASX Ltd 4,920 138,178 159,111 0.01Atlas Iron Ltd 12,348 31,341 22,819 0Australia & New Zealand Banking Group Ltd 46,447 883,694 1,205,523 0.09Australian Agricultural Co Ltd 15,263 21,871 18,302 0AWE Ltd 8,333 10,754 10,511 0Bank of Queensland Ltd 3,774 37,235 28,759 0Beach Energy Ltd 22,659 14,786 34,816 0BHP Billiton Ltd 44,161 1,578,726 1,700,949 0.12Boart Longyear Ltd 6,665 19,488 12,939 0Bradken Ltd 2,823 19,802 16,032 0Brambles Ltd 35,664 261,786 277,698 0.02BWP Trust 10,609 18,949 23,680 0Cabcharge Australia Ltd 1,946 8,773 8,607 0carsales.com Ltd 3,031 15,387 23,066 0Challenger Ltd/Australia 51,856 191,960 188,968 0.01Charter Hall Group 9,964 27,030 33,206 076
<strong>STANLIB</strong> <strong>Funds</strong> <strong>Limited</strong>Portfolio Statement (continued)<strong>STANLIB</strong> Multi-Manager Global Equity Fund as at 31 December <strong>2012</strong> (continued)Common Stock continuedNominal holding Cost Market Value % of Net AssetsUSDUSDAustralia (continued)Charter Hall Retail REIT 5,425 13,251 20,839 0Coca-Cola Amatil Ltd 14,173 149,060 197,760 0.01Commonwealth Bank of Australia 18,781 947,168 1,212,210 0.09Commonwealth Property Office Fund 38,000 36,533 40,044 0Computershare Ltd 13,547 126,529 125,876 0.01CSL Ltd 7,476 233,390 417,958 0.04David Jones Ltd 10,512 43,907 25,647 0DUET Group 16,164 30,035 34,738 0DuluxGroup Ltd 8,290 13,329 32,361 0Emeco Holdings Ltd 13,865 9,041 8,709 0FKP Property Group 3,123 14,351 3,664 0Fleetwood Corp Ltd 1,689 15,778 17,167 0Fortescue Metals Group Ltd 24,820 114,939 119,305 0.01Gindalbie Metals Ltd 77,640 29,695 19,752 0GPT Group 54,019 159,591 205,261 0.01GrainCorp Ltd 2,534 16,804 32,464 0Hills Holdings Ltd 16,669 24,717 15,489 0Iluka Resources Ltd 12,470 52,187 116,516 0.01Incitec Pivot Ltd 44,062 133,553 146,383 0.01Independence Group NL 6,706 34,859 32,165 0Intrepid Mines Ltd 74,117 41,252 16,158 0Investa Office Fund 6,924 15,796 21,278 0Invocare Ltd 2,680 17,658 24,401 0JB Hi-Fi Ltd 1,119 17,386 11,943 0Karoon Gas Australia Ltd 3,798 16,352 20,504 0Kingsgate Consolidated Ltd 22,751 150,949 103,929 0.01Linc Energy Ltd 15,464 25,785 18,704 0Lynas Corp Ltd 45,423 30,352 27,118 0Macmahon Holdings Ltd 25,759 14,082 6,017 0Macquarie Group Ltd 4,110 134,532 151,136 0.01Medusa Mining Ltd 4,584 26,862 25,699 0Mermaid Marine Australia Ltd 5,789 15,056 20,494 0Mirabela Nickel Ltd 37,142 38,326 18,508 0Monadelphous Group Ltd 1,267 19,748 32,096 0Mount Gibson Iron Ltd 14,810 25,232 12,762 0National Australia Bank Ltd 26,468 634,503 686,699 0.06Newcrest Mining Ltd 14,970 526,448 344,716 0.02NRW Holdings Ltd 6,372 14,117 12,304 0Nufarm Ltd/Australia 26,659 129,054 160,527 0.01Orica Ltd 6,758 99,398 175,824 0.01Origin Energy Ltd 15,471 222,527 186,639 0.01OZ Minerals Ltd 14,312 209,825 99,553 0.0177
<strong>STANLIB</strong> <strong>Funds</strong> <strong>Limited</strong>Portfolio Statement (continued)<strong>STANLIB</strong> Multi-Manager Global Equity Fund as at 31 December <strong>2012</strong> (continued)Common Stock continuedNominal holding Cost Market Value % of Net AssetsUSDUSDAustralia (continued)Pacific Brands Ltd 16,397 13,487 10,555 0PanAust Ltd 9,914 29,617 34,378 0Panoramic Resources Ltd 45,830 46,820 22,837 0Perpetual Ltd 1,076 32,635 37,646 0Perseus Mining Ltd 11,181 28,454 24,144 0Primary Health Care Ltd 6,190 19,534 25,191 0QBE Insurance Group Ltd 414,254 6,338,519 4,674,938 0.32Ramsay Health Care Ltd 88,556 1,857,173 2,488,769 0.18Regis Resources Ltd 6,244 13,937 32,866 0Resolute Mining Ltd 13,186 14,521 22,315 0Rio Tinto Ltd 5,119 361,592 350,120 0.02SAI Global Ltd 12,658 64,530 54,800 0Santos Ltd 28,926 300,015 330,939 0.02Seek Ltd 5,077 34,794 36,897 0Shopping Centres Australasia Property Group 1 1 2 0Silver Lake Resources Ltd 6,658 13,683 22,880 0SMS Management & Technology Ltd 3,363 20,134 16,165 0Sonic Healthcare Ltd 319,000 4,049,308 4,404,751 0.31SP AusNet 113,557 102,997 127,911 0.01Spark Infrastructure Group 240,670 364,624 417,274 0.03St Barbara Ltd 7,906 12,611 11,861 0Stockland 37,477 132,434 135,401 0.01Sundance Resources Ltd 33,378 4,778 12,647 0Sydney Airport 23,810 69,880 83,304 0.01Tassal Group Ltd 12,911 19,385 19,033 0Tatts Group Ltd 65,245 157,348 203,212 0.01Telstra Corp Ltd 56,903 181,504 257,571 0.02Transfield Services Ltd 9,540 26,446 19,115 0Transurban Group 33,429 145,665 211,011 0.01Treasury Wine Estates Ltd 65,235 285,098 316,285 0.02UGL Ltd 2,248 30,290 25,252 0Wesfarmers Ltd 11,296 344,025 430,983 0.04Western Areas Ltd 3,049 13,371 14,118 0Westfield Group 31,295 277,545 340,174 0.02Westfield Retail Trust 65,100 165,913 203,438 0.01Westpac Banking Corp 35,182 779,273 950,765 0.07Woodside Petroleum Ltd 7,650 290,940 268,922 0.02Woolworths Ltd 14,726 368,194 447,645 0.04WorleyParsons Ltd 189,338 5,027,008 4,582,035 0.32Wotif.com Holdings Ltd 2,223 10,526 11,932 0Total Australia 2.12% (2011: 2.40%) 31,422,824 2.1278
<strong>STANLIB</strong> <strong>Funds</strong> <strong>Limited</strong>Portfolio Statement (continued)<strong>STANLIB</strong> Multi-Manager Global Equity Fund as at 31 December <strong>2012</strong> (continued)Common Stock continuedNominal holding Cost Market Value % of Net AssetsUSDUSDAustriaAndritz AG 9,433 385,077 604,217 0.04BWT AG 886 17,951 18,625 0CA Immobilien Anlagen AG 1,419 16,348 19,606 0Conwert Immobilien Invest SE 1,418 17,876 18,265 0Erste Group Bank AG 7,087 239,875 224,334 0.02Kapsch TrafficCom AG 226 20,941 14,150 0Mayr Melnhof Karton AG 129 13,406 13,766 0Oesterreichische Post AG 3,432 112,808 141,057 0.01OMV AG 3,571 122,824 128,786 0.01Raiffeisen Bank International AG 606 20,628 25,151 0RHI AG 451 13,514 14,785 0Schoeller-Bleckmann Oilfield Equipment AG 269 13,611 28,091 0Zumtobel AG 7,600 108,790 99,205 0.01Total Austria 0.09% (2011: 0.11%) 1,350,038 0.09Bahamas, TheSteiner Leisure Ltd 300 11,063 14,448 0Ultrapetrol Bahamas Ltd 13,463 74,023 22,214 0Total Bahamas, The 0.00% (2011: 0.00%) 36,662 0BelgiumAckermans & van Haaren NV 394 29,284 32,226 0Ageas 6,680 176,271 195,379 0.01AGFA-Gevaert NV 2,172 11,784 3,780 0AGFA-Gevaert NV Npv 9,288 14,974 15,686 0Anheuser-Busch InBev NV 17,355 867,984 1,501,193 0.11Anheuser-Busch InBev Strip VVPR 2,880 – 4 0Barco NV 261 13,293 18,650 0Befimmo SCA Sicafi 183 13,986 11,781 0Belgacom SA 4,043 142,076 118,064 0.01Cie d'Entreprises CFE 261 13,670 14,930 0Cie Maritime Belge SA 450 13,469 8,395 0Cofinimmo 166 20,914 19,609 0D'ieteren SA/NV 280 13,661 11,218 0EVS Broadcast Equipment SA 263 13,369 15,211 0Gimv NV 1,606 80,175 80,035 0.01Groupe Bruxelles Lambert SA 1,556 128,006 123,064 0.01KBC Groep NV 6,272 247,087 215,281 0.02Nyrstar 3,000 36,671 17,719 0Solvay SA 1,056 104,676 152,238 0.01Tessenderlo Chemie NV 489 14,576 15,937 0Tessenderlo Chemie Strip VVP 25 – 0 –ThromboGenics NV 808 18,551 44,474 0Total Belgium 0.18% (2011: 0.29%) 2,614,874 0.1879
<strong>STANLIB</strong> <strong>Funds</strong> <strong>Limited</strong>Portfolio Statement (continued)<strong>STANLIB</strong> Multi-Manager Global Equity Fund as at 31 December <strong>2012</strong> (continued)Common Stock continuedNominal holding Cost Market Value % of Net AssetsUSDUSDBermudaAircastle Ltd 1,400 12,621 17,542 0Alterra Capital Holdings Ltd 700 13,213 19,719 0Aquarius Platinum Ltd 11,971 51,817 10,253 0Arch Capital Group Ltd 4,685 126,471 206,187 0.01Argo Group International Holdings Ltd 400 12,110 13,436 0Aspen Insurance Holdings Ltd 600 16,129 19,242 0Assured Guaranty Ltd 2,100 37,853 29,841 0Axis Capital Holdings Ltd 3,827 125,153 132,491 0.01Beijing Enterprises Water Group Ltd 96,000 28,958 24,768 0Biosensors International Group Ltd 22,000 13,014 21,703 0Brightoil Petroleum Holdings Ltd 51,000 13,673 10,200 0Brilliance China Automotive Holdings Ltd 34,000 25,766 41,936 0Bunge Ltd 2,441 136,701 177,265 0.01BW Offshore Ltd 10,456 26,966 9,657 0Catlin Group Ltd 15,724 101,826 128,180 0.01China Oil & Gas Group Ltd 140,000 10,887 23,114 0China Resources Gas Group Ltd 18,000 33,886 37,111 0Chow Sang Sang Holdings International Ltd 6,000 12,534 13,918 0Cosco International Holdings Ltd 24,000 13,523 10,498 0COSCO Pacific Ltd 28,000 36,065 39,738 0Credicorp Ltd 560 56,833 82,012 0.01Digital China Holdings Ltd 13,000 17,523 22,173 0Endurance Specialty Holdings Ltd 300 11,507 11,901 0Enstar Group Ltd 200 14,813 22,224 0Esprit Holdings Ltd 752,213 972,150 1,040,386 0.08Everest Re Group Ltd 1,631 134,542 179,214 0.01First Pacific Co Ltd/Hong Kong 599,200 243,013 657,143 0.04Freescale Semiconductor Ltd 22,100 272,392 243,100 0.02Genting Hong Kong Ltd 317,000 123,765 107,780 0.01Giordano International Ltd 28,000 14,335 26,914 0GOME Electrical Appliances Holding Ltd 161,000 62,177 19,111 0Great Eagle Holdings Ltd 7,000 23,880 23,120 0Gulf Keystone Petroleum Ltd 11,901 42,389 34,240 0GuocoLeisure Ltd 637,000 338,040 341,559 0.02Helen of Troy Ltd 500 12,175 16,690 0Hiscox Ltd 3,822 22,821 28,143 0Huabao International Holdings Ltd 37,000 29,774 18,282 0Invesco Ltd 9,199 192,456 239,910 0.02Jardine Matheson Holdings Ltd 59,077 983,342 3,662,773 0.26Jardine Strategic Holdings Ltd 102,500 599,620 3,639,774 0.26K Wah International Holdings Ltd 25,000 6,476 11,998 0Kunlun Energy Co Ltd 40,000 52,228 83,396 0.0180
<strong>STANLIB</strong> <strong>Funds</strong> <strong>Limited</strong>Portfolio Statement (continued)<strong>STANLIB</strong> Multi-Manager Global Equity Fund as at 31 December <strong>2012</strong> (continued)Common Stock continuedNominal holding Cost Market Value % of Net AssetsUSDUSDBermuda (continued)Lancashire Holdings Ltd 1,979 16,967 24,818 0Lazard Ltd 43,849 1,705,241 1,308,454 0.1Li & Fung Ltd 923,390 1,665,606 1,629,782 0.12Luk Fook Holdings International Ltd 6,000 22,713 18,811 0Maiden Holdings Ltd 1,900 13,927 17,461 0Mandarin Oriental International Ltd 86,000 64,779 124,700 0.01Marvell Technology Group Ltd 9,776 156,025 70,974 0Midland Holdings Ltd 740,000 411,176 351,352 0.02Montpelier Re Holdings Ltd 800 12,848 18,288 0Nabors Industries Ltd 7,957 138,265 114,979 0.01Noble Group Ltd 128,000 171,304 121,037 0.01North Mining Shares Co Ltd 230,000 9,031 14,835 0OM Holdings Ltd 17,037 11,878 4,687 0Orient-Express Hotels Ltd 1,400 14,686 16,366 0Pacific Basin Shipping Ltd 32,000 23,282 17,958 0PartnerRe Ltd 1,747 134,768 140,721 0.01Platinum Underwriters Holdings Ltd 400 15,768 18,396 0Ports Design Ltd 8,500 20,403 6,734 0REXLot Holdings Ltd 175,000 15,439 13,318 0Seadrill Ltd 26,784 897,329 978,433 0.07Shanghai Industrial Urban Development Group Ltd 96,000 22,726 22,291 0Signet Jewelers Ltd 700 26,287 37,331 0Sino Oil And Gas Holdings Ltd 265,000 11,811 6,599 0Sinopec Kantons Holdings Ltd 30,000 19,940 19,584 0SmarTone Telecommunications Holdings Ltd 320,808 200,786 581,112 0.04Texwinca Holdings Ltd 52,197 63,028 48,961 0Trinity Ltd 24,000 25,068 15,636 0Validus Holdings Ltd 632 19,531 21,855 0VODone Ltd 167,200 29,084 15,750 0VTech Holdings Ltd 2,800 30,792 31,338 0Total Bermuda 1.17% (2011: 0.96%) 17,311,203 1.17BrazilAliansce Shopping Centers SA 3,200 29,635 37,947 0All America Latina Logistica SA 10,700 99,456 43,427 0Amil Participacoes SA 2,400 23,361 36,161 0Anhanguera Educacional Participacoes SA 2,000 43,834 33,309 0Banco Bradesco SA 399,000 6,861,504 6,930,629 0.48Banco do Brasil SA 8,500 146,651 106,276 0.01Banco Santander Brasil SA/Brazil 12,000 153,709 87,502 0.01BM&FBovespa SA 28,700 200,931 196,239 0.01BR Malls Participacoes SA 6,600 75,677 86,808 0.01BRF - Brasil Foods SA 9,900 135,065 203,996 0.0181
<strong>STANLIB</strong> <strong>Funds</strong> <strong>Limited</strong>Portfolio Statement (continued)<strong>STANLIB</strong> Multi-Manager Global Equity Fund as at 31 December <strong>2012</strong> (continued)Common Stock continuedNominal holding Cost Market Value % of Net AssetsUSDUSDBrazil (continued)CCR SA 15,200 89,905 144,094 0.01Centrais Eletricas Brasileiras SA 6,900 78,578 21,332 0CETIP SA - Mercados Organizados 4,300 60,595 53,301 0Cia de Saneamento Basico do Estado de Sao Paulo 2,000 47,017 84,494 0.01Cia de Saneamento de Minas Gerais-COPASA 238,640 3,308,623 5,097,994 0.35Cia Siderurgica Nacional SA 12,100 206,745 69,971 0Cielo SA 4,848 84,650 134,916 0.01Cosan SA Industria e Comercio 3,500 48,769 71,180 0CPFL Energia SA 4,900 61,820 51,094 0Cyrela Brazil Realty SA Empreendimentos e Participacoes 5,800 71,449 50,678 0Diagnosticos da America SA 6,500 46,258 41,556 0Duratex SA 13,080 87,703 93,780 0.01EDP - Energias do Brasil SA 6,000 43,472 36,396 0Embraer SA 14,375 194,688 214,399 0.01Fibria Celulose SA 2,800 45,917 30,865 0Fleury SA 1,700 19,670 18,764 0General Shopping Brasil SA 3,700 23,874 19,209 0Hypermarcas SA 30,000 395,473 243,516 0.02Iguatemi Empresa de Shopping Centers SA 11,600 131,742 152,401 0.01JBS SA 9,800 38,091 28,718 0JHSF Participacoes SA 7,100 24,128 29,856 0Localiza Rent a Car SA 1,942 27,494 35,568 0Lojas Renner SA 1,900 56,807 73,680 0Marfrig Alimentos SA 5,500 24,945 22,725 0MRV Engenharia e Participacoes SA 17,800 123,427 102,411 0.01Multiplan Empreendimentos Imobiliarios SA 6,000 123,108 176,411 0.01Multiplus SA 5,300 110,058 123,525 0.01Natura Cosmeticos SA 3,100 75,662 88,784 0.01Odontoprev SA 11,100 50,382 58,171 0OGX Petroleo e Gas Participacoes SA 25,333 220,299 53,944 0Oi SA 73,073 544,519 294,423 0.02PDG Realty SA Empreendimentos e Participacoes 25,400 116,165 40,937 0Petroleo Brasileiro SA 305,100 7,263,013 5,480,243 0.38Sonae Sierra Brasil SA 2,000 27,360 31,277 0Souza Cruz SA 5,700 48,970 85,744 0.01Tim Participacoes SA 14,648 57,279 58,592 0Totvs SA 11,400 208,832 224,716 0.02Tractebel Energia SA 2,300 31,290 37,295 0Ultrapar Participacoes SA 4,400 60,102 98,896 0.01Vale SA 323,500 6,341,175 6,570,183 0.46WEG SA 2,400 28,458 31,637 0Total Brazil 1.90% (2011: 2.97%) 28,139,970 1.982
<strong>STANLIB</strong> <strong>Funds</strong> <strong>Limited</strong>Portfolio Statement (continued)<strong>STANLIB</strong> Multi-Manager Global Equity Fund as at 31 December <strong>2012</strong> (continued)Common Stock continuedNominal holding Cost Market Value % of Net AssetsUSDUSDBritish Virgin IslandsGem Diamonds Ltd 3,879 13,020 8,954 0UTi Worldwide Inc 1,400 23,290 18,760 0Total British Virgin Islands 0.00% (2011: 0.00%) 27,714 0CanadaAdvantage Oil & Gas Ltd 21,000 82,461 66,858 0Aecon Group Inc 1,300 14,804 13,840 0AGF Management Ltd 819 12,884 8,143 0Agnico-Eagle Mines Ltd 2,511 129,419 131,187 0.01Agrium Inc 2,301 176,318 228,784 0.02Aimia Inc 26,500 346,460 395,494 0.03Alacer Gold Corp 3,900 43,918 20,289 0Alamos Gold Inc 1,500 24,501 26,228 0Allied Properties Real Estate Investment Trust 1,100 27,386 36,402 0AltaGas Ltd 1,300 27,599 43,738 0Astral Media Inc 600 23,094 27,840 0Atco Ltd/Canada 600 29,951 48,376 0Atrium Innovations Inc 1,100 14,839 13,036 0ATS Automation Tooling Systems Inc 2,200 13,306 19,333 0AuRico Gold Inc 3,142 24,927 25,592 0Aurizon Mines Ltd 2,800 15,235 9,589 0Bank of Montreal 7,339 433,822 448,215 0.03Bank of Nova Scotia 12,857 663,656 741,958 0.06Bankers Petroleum Ltd 26,800 105,735 86,130 0.01Barrick Gold Corp 11,462 531,069 399,566 0.03BCE Inc 68,789 2,762,872 2,943,082 0.21Bell Aliant Inc 830 24,308 21,940 0Birchcliff Energy Ltd 1,700 18,069 12,669 0BlackPearl Resources Inc 5,000 17,571 15,115 0Boardwalk Real Estate Investment Trust 300 11,929 19,376 0Bombardier Inc 421,442 1,079,666 1,587,235 0.12Brookfield Asset Management Inc 8,841 249,920 321,162 0.02Brookfield Office Properties Inc 7,491 112,595 126,920 0.01Calfrac Well Services Ltd 600 13,197 14,987 0Calloway Real Estate Investment Trust 500 10,487 14,513 0Cameco Corp 16,895 434,120 332,404 0.02Canaccord Financial Inc 1,400 14,607 9,364 0Canadian Apartment Properties REIT 900 13,962 22,398 0Canadian Imperial Bank of Commerce/Canada 4,818 354,939 386,913 0.03Canadian National Railway Co 62,785 4,253,047 5,693,376 0.39Canadian Natural Resources Ltd 13,267 486,009 381,210 0.03Canadian Oil Sands Ltd 8,802 260,292 178,127 0.01Canadian Real Estate Investment Trust 300 10,604 13,028 083
<strong>STANLIB</strong> <strong>Funds</strong> <strong>Limited</strong>Portfolio Statement (continued)<strong>STANLIB</strong> Multi-Manager Global Equity Fund as at 31 December <strong>2012</strong> (continued)Common Stock continuedNominal holding Cost Market Value % of Net AssetsUSDUSDCanada (continued)Canadian Tire Corp Ltd 1,978 111,871 137,648 0.01Canadian Western Bank 900 23,589 25,671 0Canfor Corp 1,600 12,839 26,611 0Capstone Infrastructure Corp 3,400 27,684 13,727 0Capstone Mining Corp 3,900 9,172 9,401 0Cascades Inc 1,900 13,341 7,785 0Catalyst Paper Corp 130,000 126,240 1,958 0Celestica Inc 1,500 12,569 12,142 0Celtic Exploration Ltd 1,200 19,742 31,612 0Cenovus Energy Inc 56,584 1,884,939 1,891,829 0.14Centerra Gold Inc 70,900 1,231,332 660,086 0.04CGI Group Inc 5,600 79,507 128,907 0.01China Gold International Resources Corp Ltd 4,500 24,191 15,366 0Cineplex Inc 700 18,574 22,356 0CML HealthCare Inc 1,400 13,028 9,336 0Cogeco Cable Inc 400 13,436 15,250 0Cominar Real Estate Investment Trust 700 13,507 15,853 0Connacher Oil and Gas Ltd 28,100 28,271 5,080 0Constellation Software Inc/Canada 1,300 133,664 155,696 0.01Corus Entertainment Inc 1,000 20,010 24,666 0Cott Corp 2,100 11,639 16,873 0Crew Energy Inc 2,100 28,302 13,604 0Davis + Henderson Corp 1,200 21,571 25,899 0Detour Gold Corp 1,200 36,964 29,997 0Dorel Industries Inc 400 13,494 14,422 0Dundee Corp 1,100 12,553 33,828 0Dundee Precious Metals Inc 1,900 17,534 16,105 0Dundee Real Estate Investment Trust 500 12,287 18,791 0Eastern Platinum Ltd 153,400 32,285 24,651 0Eldorado Gold Corp 11,045 183,799 141,654 0.01Enbridge Inc 11,545 323,121 498,582 0.03Encana Corp 9,537 286,278 187,734 0.01Enerflex Ltd 1,300 12,743 15,550 0Enerplus Corp 9,441 202,908 121,368 0.01Ensign Energy Services Inc 1,700 20,400 26,140 0Extendicare Inc/US 1,500 13,619 11,525 0Fairborne Energy Ltd Npv 2,700 12,713 3,769 0First Capital Realty Inc 1,000 13,484 18,851 0First Majestic Silver Corp 1,500 33,872 30,100 0First Quantum Minerals Ltd 7,851 99,131 172,365 0.01FirstService Corp/Canada 600 13,133 16,873 0Fortis Inc/Canada 6,360 176,854 218,006 0.0184
<strong>STANLIB</strong> <strong>Funds</strong> <strong>Limited</strong>Portfolio Statement (continued)<strong>STANLIB</strong> Multi-Manager Global Equity Fund as at 31 December <strong>2012</strong> (continued)Common Stock continuedNominal holding Cost Market Value % of Net AssetsUSDUSDCanada (continued)Fraser Papers Inc 35,497 215,822 2,318 0Gabriel Resources Ltd 3,400 18,864 7,922 0Genworth MI Canada Inc 600 14,715 13,601 0GMP Capital Inc 1,400 13,197 8,183 0Goldcorp Inc 9,114 406,995 333,001 0.02Golden Star Resources Ltd 9,800 30,328 16,831 0Great Basin Gold Ltd Npv 7,800 14,247 626 0Great Canadian Gaming Corp 2,000 13,224 19,062 0Harry Winston Diamond Corp 9,400 126,332 129,903 0.01Home Capital Group Inc 3,200 154,709 189,617 0.01HudBay Minerals Inc 2,000 27,388 20,086 0IAMGOLD Corp 9,444 173,036 107,748 0.01IGM Financial Inc 3,532 146,607 147,531 0.01Imperial Oil Ltd 30,172 603,576 1,294,825 0.1Inmet Mining Corp 29,800 1,783,983 2,214,736 0.16Intact Financial Corp 6,920 346,701 449,383 0.03Jean Coutu Group PJC Inc/The 1,600 13,471 23,316 0Keyera Corp 1,004 46,691 49,459 0Kinross Gold Corp 14,117 223,206 136,109 0.01Kodiak Oil & Gas Corp 3,400 30,001 30,056 0Lake Shore Gold Corp 8,300 21,497 6,169 0Laurentian Bank of Canada 300 13,174 13,317 0Legacy Oil + Gas Inc 2,300 32,442 15,754 0Linamar Corp 1,000 16,254 23,280 0Lions Gate Entertainment Corp 800 5,276 13,104 0Loblaw Cos Ltd 3,127 127,453 131,462 0.01Lundin Mining Corp 4,800 24,421 24,538 0MacDonald Dettwiler & Associates Ltd 600 29,163 33,649 0Magna International Inc 3,960 166,708 196,828 0.01Major Drilling Group International 1,800 14,299 17,644 0Manitoba Telecom Services Inc 300 9,175 9,780 0Manulife Financial Corp 22,732 328,328 307,753 0.02Maple Leaf Foods Inc 1,400 12,725 16,774 0Martinrea International Inc 1,700 13,829 13,181 0Methanex Corp 1,100 28,004 34,833 0Metro Inc 3,008 128,118 191,019 0.01Mullen Group Ltd 1,200 19,498 25,176 0Nevsun Resources Ltd 3,600 24,351 15,258 0Nexen Inc 8,584 187,411 229,063 0.02Nortel Networks Corp 8,100 90,497 41 0Novagold Resources Inc 1,500 11,745 6,734 0NuVista Energy Ltd 3,000 28,611 17,626 085
<strong>STANLIB</strong> <strong>Funds</strong> <strong>Limited</strong>Portfolio Statement (continued)<strong>STANLIB</strong> Multi-Manager Global Equity Fund as at 31 December <strong>2012</strong> (continued)Common Stock continuedNominal holding Cost Market Value % of Net AssetsUSDUSDCanada (continued)Onex Corp 15,903 429,401 668,419 0.05Open Text Corp 3,100 180,319 172,172 0.01Pacific Rubiales Energy Corp 5,100 131,494 118,114 0.01Pan American Silver Corp 5,104 161,106 95,294 0.01Paramount Resources Ltd 600 12,419 19,241 0Pason Systems Inc 1,300 13,846 22,313 0Penn West Petroleum Ltd 9,857 265,115 106,619 0.01Petrobank Energy & Resources Npv 1,500 41,388 18,530 0Petrominerales Ltd 4,121 76,570 35,345 0Peyto Exploration & Development Corp 1,400 31,713 32,213 0Potash Corp of Saskatchewan Inc 137,305 6,051,875 5,557,324 0.38Primaris Retail Real Estate Investment Trust 1,400 28,318 37,767 0Progressive Waste Solutions Ltd 12,500 266,860 269,159 0.02Quebecor Inc 5,500 203,541 213,439 0.01Reitmans Canada Ltd 700 13,167 8,443 0Research In Motion Ltd 8,249 356,591 97,593 0.01Rogers Communications Inc 81,135 971,707 3,678,271 0.26RONA Inc 2,000 28,285 21,312 0Royal Bank of Canada 16,608 859,672 997,453 0.08Rubicon Minerals Corp 4,000 15,190 10,164 0Russel Metals Inc 1,000 21,652 27,669 0Saputo Inc 3,523 110,087 177,372 0.01Savanna Energy Services Corp 2,300 24,203 16,493 0Seabridge Gold Inc 800 21,267 14,004 0SEMAFO Inc 3,500 28,920 11,951 0ShawCor Ltd 800 22,188 31,263 0Sherritt International Corp 2,800 17,938 15,973 0Silver Standard Resources Inc 1,500 33,281 21,995 0Silver Wheaton Corp 6,794 241,258 244,140 0.02Silvercorp Metals Inc 2,100 14,280 10,651 0Sino-Forest Corp 3,300 58,139 15,942 0Stantec Inc 600 14,811 23,851 0Sun Life Financial Inc 7,587 209,652 200,706 0.01Suncor Energy Inc 169,811 5,517,195 5,576,832 0.39Superior Plus Corp 1,500 12,487 15,381 0Talisman Energy Inc 15,230 282,307 171,619 0.01Taseko Mines Ltd 3,300 13,486 9,943 0Teck Resources Ltd 8,312 331,233 300,943 0.02TELUS Corp - Non Voting 4,200 178,212 272,451 0.02Thompson Creek Metals Co Inc 2,500 27,954 10,320 0Thomson Reuters Corp 6,038 203,809 174,464 0.01Tim Hortons Inc 3,701 133,462 181,353 0.0186
<strong>STANLIB</strong> <strong>Funds</strong> <strong>Limited</strong>Portfolio Statement (continued)<strong>STANLIB</strong> Multi-Manager Global Equity Fund as at 31 December <strong>2012</strong> (continued)Common Stock continuedNominal holding Cost Market Value % of Net AssetsUSDUSDCanada (continued)Toromont Industries Ltd 1,300 20,038 27,457 0Toronto-Dominion Bank/The 10,670 780,840 896,406 0.07TransAlta Corp 6,256 128,247 94,812 0.01TransCanada Corp 9,607 366,270 453,192 0.03Transcontinental Inc 1,300 15,591 14,492 0TransForce Inc 1,300 12,630 25,904 0Trican Well Service Ltd 15,100 225,526 198,817 0.01Trilogy Energy Corp 800 28,368 23,268 0Trinidad Drilling Ltd 2,600 14,096 17,861 0Turquoise Hill Resources Ltd 11,088 210,978 83,408 0.01Ultra Petroleum Corp 4,692 191,010 85,019 0.01Uranium One Inc 6,600 19,434 15,511 0Valeant Pharmaceuticals International Inc 4,467 199,240 265,770 0.02Veresen Inc 2,700 38,140 31,889 0West Fraser Timber Co Ltd 500 18,312 35,156 0Yamana Gold Inc 12,831 128,805 219,586 0.01Yellow Media Ltd 44 43,374 290 0Total Canada 3.27% (2011: 3.31%) 48,482,719 3.27Cayman Islands361 Degrees International Ltd 18,000 14,026 5,132 0AAC Technologies Holdings Inc 10,000 20,929 34,835 0Agile Property Holdings Ltd 40,000 29,426 56,148 0Ajisen China Holdings Ltd 11,000 13,112 10,474 0Anta Sports Products Ltd 26,000 30,127 22,911 0BaWang International Group Holding Ltd 154,000 28,266 15,292 0Belle International Holdings Ltd 70,000 130,497 150,822 0.02China Lumena New Materials Corp 94,000 22,852 20,370 0China Mengniu Dairy Co Ltd 20,000 70,563 56,638 0China Metal Recycling Holdings Ltd 13,800 14,148 14,261 0China Mobile Games & Entertainment Group Ltd 83 – 325 0China Precious Metal Resources Holdings Co Ltd 90,000 18,423 16,956 0China Rare Earth Holdings Ltd 62,000 27,086 13,677 0China Resources Cement Holdings Ltd 50,000 46,634 32,705 0China Resources Land Ltd 40,000 79,169 108,116 0.01China SCE Property Holdings Ltd 126,000 29,757 31,046 0China Shanshui Cement Group Ltd 45,000 32,836 32,859 0China Vanadium Titano - Magnetite Mining Co Ltd 66,000 20,686 15,583 0China Wireless Technologies Ltd 84,000 17,427 24,276 0China Yongda Automobiles Services Holdings Ltd 31,000 29,565 32,795 0Country Garden Holdings Co Ltd 115,401 35,035 60,447 0ENN Energy Holdings Ltd 12,000 41,328 52,175 0Eurasia Drilling Co Ltd 1,420 35,991 50,268 087
<strong>STANLIB</strong> <strong>Funds</strong> <strong>Limited</strong>Portfolio Statement (continued)<strong>STANLIB</strong> Multi-Manager Global Equity Fund as at 31 December <strong>2012</strong> (continued)Common Stock continuedNominal holding Cost Market Value % of Net AssetsUSDUSDCayman Islands (continued)Evergrande Real Estate Group Ltd 76,000 37,991 41,572 0Fantasia Holdings Group Co Ltd 240,000 28,591 39,024 0Fresh Del Monte Produce Inc 600 13,104 15,792 0Fufeng Group Ltd 46,000 28,723 20,180 0GCL-Poly Energy Holdings Ltd 140,000 58,488 28,182 0Giant Interactive Group Inc 9,385 43,700 50,679 0Global Bio-Chem Technology Group Co Ltd 52,000 7,748 5,834 0Golden Eagle Retail Group Ltd 14,000 31,485 34,247 0Goodbaby International Holdings Ltd 181,000 51,835 65,377 0Haitian International Holdings Ltd 117,000 128,147 139,628 0.02Hengan International Group Co Ltd 11,500 99,125 103,562 0.01Intime Department Store Group Co Ltd 25,000 31,917 29,353 0Kingboard Chemical Holdings Ltd 12,500 40,304 44,189 0Longfor Properties Co Ltd 29,000 31,382 56,498 0Mindray Medical International Ltd 4,641 126,830 151,807 0.02Minth Group Ltd 16,000 19,305 18,392 0MStar Semiconductor Inc 15,706 107,585 117,636 0.01NetEase Inc 2,200 98,528 93,544 0.01New World Department Store China Ltd 27,000 18,322 17,383 0Parkson Retail Group Ltd 25,500 31,656 20,530 0Peak Sport Products Co Ltd 20,000 14,567 3,870 0Phoenix Satellite Television Holdings Ltd 50,000 13,385 16,190 0Real Gold Mining Ltd 9,000 13,365 10,229 0Shenguan Holdings Group Ltd 318,000 184,060 172,324 0.02Shenzhou International Group Holdings Ltd 124,000 198,059 279,013 0.03Shimao Property Holdings Ltd 26,000 21,732 48,976 0Sino Biopharmaceutical 64,000 23,113 30,387 0Stella International Holdings Ltd 8,000 17,028 21,520 0TCL Multimedia Technology Holdings Ltd 24,000 9,658 13,378 0Tencent Holdings Ltd 14,800 382,106 473,930 0.04Tianjin Port Development Holdings Ltd 154,000 27,959 21,652 0Tingyi Cayman Islands Holding Corp 51,929 155,746 143,038 0.02TPK Holding Co Ltd 2,591 34,995 45,772 0Vinda International Holdings Ltd 82,000 120,853 112,143 0.01Want Want China Holdings Ltd 160,422 154,662 221,046 0.02Xinyi Glass Holdings Ltd 30,000 14,045 18,462 0XTEP International Holdings 19,000 14,303 8,090 0Total Cayman Islands 0.24% (2011: 0.88%) 3,591,540 0.24ChileBanco de Chile 1,115 91,132 107,163 0.01Banco Santander Chile 4,218 124,764 120,086 0Cia Cervecerias Unidas SA 2,500 54,749 79,000 0.0188
<strong>STANLIB</strong> <strong>Funds</strong> <strong>Limited</strong>Portfolio Statement (continued)<strong>STANLIB</strong> Multi-Manager Global Equity Fund as at 31 December <strong>2012</strong> (continued)Common Stock continuedNominal holding Cost Market Value % of Net AssetsUSDUSDChile (continued)Corpbanca SA 3,666 96,971 74,053 0Empresa Nacional de Electricidad SA/Chile 2,800 142,212 136,696 0.01Enersis SA 5,200 106,405 94,692 0.01Latam Airlines Group SA 5,900 148,884 138,886 0.01Sociedad Quimica y Minera de Chile SA 1,900 80,360 109,497 0.01Vina Concha y Toro SA 1,600 61,818 60,976 0Total Chile 0.06% (2011: 0.07%) 921,049 0.06ChinaAgricultural Bank of China Ltd 300,000 140,150 148,620 0.01Air China Ltd 1,610,000 1,287,597 1,358,518 0.1Aluminum Corp of China Ltd 64,000 53,702 29,146 0Anhui Conch Cement Co Ltd 16,000 40,698 58,213 0Bank of Communications Co Ltd 109,100 109,529 82,065 0.01Byd Co Ltd 12,500 77,637 37,335 0China BlueChemical Ltd 38,000 24,985 25,445 0China CITIC Bank Corp Ltd 120,000 80,128 71,220 0China Coal Energy Co Ltd 70,000 91,623 75,593 0.01China Communications Construction Co Ltd 71,000 66,846 68,430 0China Communications Services Corp Ltd 30,000 15,046 17,340 0China Construction Bank Corp 1,011,000 819,772 811,328 0.06China COSCO Holdings Co Ltd 40,500 45,772 19,805 0China Life Insurance Co Ltd 101,000 403,950 330,331 0.02China Longyuan Power Group Corp 24,000 22,659 16,565 0China Merchants Bank Co Ltd 56,000 132,796 123,402 0.01China Minsheng Banking Corp Ltd 64,500 62,346 74,478 0.01China National Building Material Co Ltd 54,000 51,535 79,007 0.01China Oilfield Services Ltd 34,000 45,379 69,748 0China Pacific Insurance Group Co Ltd 29,600 117,692 109,413 0.01China Petroleum & Chemical Corp 238,000 211,686 269,606 0.02China Railway Construction Corp Ltd 35,000 47,016 39,648 0China Railway Group Ltd 71,000 52,260 41,500 0China Shenhua Energy Co Ltd 86,500 322,881 377,763 0.03China Shipping Development Co Ltd 20,000 29,417 11,354 0China Telecom Corp Ltd 178,000 89,302 98,754 0.01Dongfeng Motor Group Co Ltd 266,000 346,548 407,698 0.03First Tractor Co Ltd 22,000 15,661 21,516 0Great Wall Motor Co Ltd 21,250 16,356 66,347 0Guangzhou Automobile Group Co Ltd 38,870 44,198 34,353 0Huaneng Power International Inc 52,000 31,076 47,902 0Hunan Nonferrous Metal Corp Ltd 42,000 13,550 16,258 0Industrial & Commercial Bank of China Ltd 1,325,000 932,540 940,220 0.07Jiangsu Expressway Co Ltd 22,000 21,067 22,508 089
<strong>STANLIB</strong> <strong>Funds</strong> <strong>Limited</strong>Portfolio Statement (continued)<strong>STANLIB</strong> Multi-Manager Global Equity Fund as at 31 December <strong>2012</strong> (continued)Common Stock continuedNominal holding Cost Market Value % of Net AssetsUSDUSDChina (continued)Jiangxi Copper Co Ltd 30,000 62,333 78,765 0.01PetroChina Co Ltd 6,097,000 7,807,862 8,605,630 0.59PICC Property & Casualty Co Ltd 48,000 54,731 67,253 0Ping An Insurance Group Co of China Ltd 26,500 276,593 221,720 0.01Shandong Weigao Group Medical Polymer Co Ltd 32,000 36,611 31,747 0Shanghai Electric Group Co Ltd 52,000 25,148 22,204 0Shenzhen Expressway Co Ltd 182,000 77,512 70,216 0Sinopharm Group Co Ltd 12,800 41,496 40,047 0Tsingtao Brewery Co Ltd 139,500 223,370 818,907 0.07Weichai Power Co Ltd 10,800 38,716 47,724 0Weiqiao Textile Co 83,239 46,223 32,646 0Yanzhou Coal Mining Co Ltd 32,000 72,968 52,845 0Zhaojin Mining Industry Co Ltd 14,000 16,526 21,855 0Zhejiang Expressway Co Ltd 30,000 28,476 23,571 0Zijin Mining Group Co Ltd 96,000 44,882 37,526 0Zoomlion Heavy Industry Science and Technology Co Ltd 28,280 42,362 41,668 0ZTE Corp 9,120 26,037 15,367 0Total China 1.09% (2011: 1.94%) 16,231,120 1.09China, Republic of (Taiwan)Acer Inc 45,000 123,589 39,051 0Advanced Semiconductor Engineering Inc 89,051 61,320 76,976 0.01Altek Corp 11,273 10,793 6,618 0Ardentec Corp 17,340 13,366 11,436 0Asia Cement Corp 36,710 38,073 47,092 0Asustek Computer Inc 13,211 193,501 283,100 0.03AU Optronics Corp 132,000 126,988 59,096 0Catcher Technology Co Ltd 10,000 30,899 49,416 0Cathay Financial Holding Co Ltd 96,947 147,995 104,994 0.01Chang Hwa Commercial Bank 82,807 48,897 45,337 0Cheng Shin Rubber Industry Co Ltd 27,930 49,430 72,425 0China Airlines Ltd 33,000 16,123 13,636 0China Development Financial Holding Corp 211,327 59,920 55,304 0China Manmade Fibers Corp 38,000 14,150 14,786 0China Steel Corp 149,306 139,784 140,363 0.02China Synthetic Rubber Corp 14,000 14,317 15,716 0Chinatrust Financial Holding Co Ltd 189,537 102,869 111,618 0.01Chipbond Technology Corp 89,000 116,700 174,698 0.02Chung Hung Steel Corp 37,268 13,840 12,116 0Chunghwa Telecom Co Ltd 91,800 269,313 298,111 0.03Compal Electronics Inc 56,065 71,441 37,743 0Compeq Manufacturing Co 49,000 13,571 21,095 0CSBC Corp Taiwan 17,510 14,930 10,734 090
<strong>STANLIB</strong> <strong>Funds</strong> <strong>Limited</strong>Portfolio Statement (continued)<strong>STANLIB</strong> Multi-Manager Global Equity Fund as at 31 December <strong>2012</strong> (continued)Common Stock continuedNominal holding Cost Market Value % of Net AssetsUSDUSDChina, Republic of (Taiwan) (continued)Delta Electronics Inc 29,000 104,899 105,859 0.01E Ink Holdings Inc 19,000 41,728 14,459 0E.Sun Financial Holding Co Ltd 62,712 29,071 34,987 0Elan Microelectronics Corp 9,000 12,523 14,489 0Elite Material Co Ltd 13,197 10,989 13,043 0Epistar Corp 13,000 36,605 23,592 0Eva Airways Corp 13,500 8,940 7,903 0Far Eastern Department Stores Co Ltd 23,920 32,190 24,793 0Far Eastern New Century Corp 42,054 50,467 47,862 0Far EasTone Telecommunications Co Ltd 21,000 32,592 53,369 0First Financial Holding Co Ltd 76,161 46,834 46,420 0FLEXium Interconnect Inc 38,910 128,505 136,671 0.02Formosa Chemicals & Fibre Corp 45,000 109,909 116,069 0.02Formosa Petrochemical Corp 19,000 50,593 56,269 0Formosa Plastics Corp 62,000 148,160 167,605 0.02Foxconn Technology Co Ltd 14,347 46,047 44,910 0Fubon Financial Holding Co Ltd 85,308 102,156 103,112 0.01Giant Manufacturing Co Ltd 50,000 224,875 285,820 0.03Gintech Energy Corp 13,301 26,352 12,435 0Goldsun Development & Construction Co Ltd 31,310 14,689 12,076 0Great Wall Enterprise Co Ltd 15,034 13,726 13,771 0HannsTouch Solution Inc 20,000 14,211 6,990 0Hiwin Technologies Corp 4,200 29,428 30,734 0Hon Hai Precision Industry Co Ltd 202,408 580,914 618,964 0.05HTC Corp 9,650 190,684 99,860 0.01Hua Nan Financial Holdings Co Ltd 83,869 49,432 48,376 0Huaku Development Co Ltd 14,302 32,870 34,624 0Innolux Corp 55,000 67,249 29,546 0Inventec Corp 70,380 38,211 26,899 0ITEQ Corp 9,247 11,981 9,441 0Jentech Precision Industrial Co Ltd 5,460 18,160 12,616 0Jih Sun Financial Holdings Co Ltd 55,244 15,372 15,772 0Kenda Rubber Industrial Co Ltd 13,003 12,243 16,814 0King Yuan Electronics Co Ltd 28,000 12,626 17,791 0Largan Precision Co Ltd 2,000 46,353 53,583 0Lealea Enterprise Co Ltd 40,736 15,906 16,062 0Lien Hwa Industrial Corp 21,629 14,228 14,076 0Lite-On Technology Corp 42,565 55,618 56,433 0Macronix International 49,823 32,218 14,877 0Makalot Industrial Co Ltd 6,000 14,067 18,658 0Masterlink Securities Corp 48,000 17,638 15,226 0MediaTek Inc 24,322 267,753 270,534 0.0391
<strong>STANLIB</strong> <strong>Funds</strong> <strong>Limited</strong>Portfolio Statement (continued)<strong>STANLIB</strong> Multi-Manager Global Equity Fund as at 31 December <strong>2012</strong> (continued)Common Stock continuedNominal holding Cost Market Value % of Net AssetsUSDUSDChina, Republic of (Taiwan)(continued)Mega Financial Holding Co Ltd 130,447 84,644 101,292 0.01Microbio Co Ltd 10,827 9,264 13,479 0MIN AIK Technology Co Ltd 7,000 19,708 21,309 0Nan Ya Plastics Corp 74,000 150,925 142,702 0.02Neo Solar Power Corp 18,950 28,604 12,399 0Novatek Microelectronics Corp 8,000 22,278 32,233 0Pegatron Corp 34,000 43,286 43,965 0Phihong Technology Co Ltd 8,777 13,571 7,466 0Pou Chen Corp 46,000 38,748 48,314 0Powertech Technology Inc 17,000 37,949 27,486 0President Chain Store Corp 9,000 33,366 48,194 0Quanta Computer Inc 38,000 67,985 89,247 0.01Radium Life Tech Co Ltd 15,744 13,721 13,365 0Sanyang Industry Co Ltd 30,740 13,949 18,736 0Shihlin Paper Corp 10,000 18,265 16,392 0Shin Kong Financial Holding Co Ltd 172,823 56,638 48,684 0Shinkong Synthetic Fibers Corp 37,995 13,879 12,706 0Siliconware Precision Industries Co 46,000 49,176 49,027 0SinoPac Financial Holdings Co Ltd 138,798 53,362 59,503 0Solar Applied Materials Technology Co 8,249 11,075 10,056 0Solartech Energy Corp 11,150 14,226 7,449 0St Shine Optical Co Ltd 2,000 17,949 30,442 0Synnex Technology International Corp 13,686 31,768 25,167 0TA Chen Stainless Pipe 57,990 30,222 30,456 0Ta Chong Bank Ltd 51,088 17,872 17,574 0Taichung Commercial Bank 45,973 14,977 15,833 0Taishin Financial Holding Co Ltd 86,700 34,051 34,333 0Taiwan Cement Corp 57,000 59,220 76,260 0.01Taiwan Cooperative Financial Holding 77,832 45,648 43,687 0Taiwan Fertilizer Co Ltd 13,000 34,583 33,888 0Taiwan Glass Industry Corp 26,438 23,430 27,313 0Taiwan Hon Chuan Enterprise Co Ltd 7,140 14,138 15,638 0Taiwan Mobile Co Ltd 29,200 79,263 106,589 0.01Taiwan Semiconductor Manufacturing Co Ltd 1,189,899 9,317,528 13,150,757 0.91Taiwan Sogo Shin Kong SEC 15,000 12,148 17,976 0Taiwan Styrene Monomer 113,000 28,216 29,809 0Taiwan Surface Mounting Technology Co Ltd 8,239 13,641 12,512 0Teco Electric and Machinery Co Ltd 39,000 23,722 29,749 0Test Research Inc 9,630 12,077 18,040 0Test-Rite International Co Ltd 23,707 15,619 17,920 0Tong Yang Industry Co Ltd 8,902 10,131 7,970 0Tripod Technology Corp 11,000 28,997 23,599 092
<strong>STANLIB</strong> <strong>Funds</strong> <strong>Limited</strong>Portfolio Statement (continued)<strong>STANLIB</strong> Multi-Manager Global Equity Fund as at 31 December <strong>2012</strong> (continued)Common Stock continuedNominal holding Cost Market Value % of Net AssetsUSDUSDChina, Republic of (Taiwan) (continued)Tsann Kuen Enterprise Co Ltd 5,000 10,055 10,004 0TTY Biopharm Co Ltd 4,590 13,862 17,624 0TXC Corp 8,322 13,864 13,699 0Unimicron Technology Corp 30,000 52,653 31,818 0Uni-President Enterprises Corp 215,001 263,697 394,634 0.04United Microelectronics Corp 154,000 69,930 62,047 0USI Corp 29,624 15,302 23,717 0Wah Lee Industrial Corp 12,000 16,409 16,302 0Walsin Lihwa Corp 54,000 25,720 18,430 0Walsin Technology Corp 38,890 13,271 9,520 0Wei Chuan Foods Corp 11,000 13,379 13,675 0Wintek Corp 39,000 30,855 20,682 0Wistron Corp 31,116 46,433 34,431 0Wowprime Corp 1,000 14,397 14,067 0Yieh Phui Enterprise Co Ltd 40,483 14,208 13,218 0Young Optics Inc 2,000 14,879 5,723 0Yuanta Financial Holding Co Ltd 118,460 67,562 60,983 0Yulon Motor Co Ltd 17,000 24,264 32,198 0Yungtay Engineering Co Ltd 12,000 13,802 22,067 0Total China, Republic of (Taiwan) 1.34% (2011: 1.16%) 19,869,206 1.34ColombiaAlmacenes Exito SA 11,282 159,295 225,640 0.02Bancolombia SA 3,686 52,295 62,581 0Cementos Argos SA 11,051 34,117 62,666 0Corp Financiera Colombiana SA 27 433 552 0Ecopetrol SA 76,784 145,296 234,651 0.01Grupo Argos SA/Colombia 7,431 73,736 87,894 0.01Grupo de Inversiones Suramericana SA 4,181 76,586 89,914 0.01Interconexion Electrica SA ESP 6,368 40,009 34,561 0Total Colombia 0.05% (2011: 0.04%) 798,459 0.05CuraçaoOrthofix International NV 400 12,346 15,720 0Schlumberger Ltd 80,560 5,675,587 5,582,002 0.38Total Curaçao 0.38% (2011: 0.00%) 5,597,722 0.38CyprusGlobaltrans Investment Plc 5,708 86,103 93,325 0.01ProSafe SE 4,129 25,161 34,923 0Songa Offshore SE 4,069 14,228 5,411 0Total Cyprus 0.01% (2011: 0.07%) 133,659 0.01DenmarkAP Moeller - Maersk A/S 37 319,458 270,835 0.02Bang & Olufsen A/S 3,300 75,288 39,361 093
<strong>STANLIB</strong> <strong>Funds</strong> <strong>Limited</strong>Portfolio Statement (continued)Global Property Fund as at 31 December <strong>2012</strong> (continued)Common Stock continuedNominal holding Cost Market Value % of Net AssetsUSDUSDDnemark (continued)Carlsberg A/S 4,457 346,795 435,927 0.03Chr Hansen Holding A/S 857 20,105 27,819 0Coloplast A/S 12,940 129,711 632,241 0.04D/S Norden A/S 715 23,448 20,531 0Danske Bank A/S 18,045 391,460 304,838 0.02FLSmidth & Co A/S 760 41,633 43,942 0GN Store Nord A/S 62,679 818,875 906,000 0.07Jyske Bank A/S 6,924 212,310 192,214 0.01NKT Holding A/S 540 22,581 19,361 0Novo Nordisk A/S 31,653 4,044,498 5,120,668 0.35Novozymes A/S 4,692 123,851 131,994 0.01SimCorp A/S 68 11,511 15,164 0Sydbank A/S 1,054 22,356 18,541 0Topdanmark A/S 552 67,337 117,831 0.01Vestas Wind Systems A/S 4,207 57,847 23,685 0William Demant Holding A/S 2,873 118,321 245,666 0.02Total Denmark 0.58% (2011: 0.27%) 8,566,618 0.58EgyptCommercial International Bank Egypt SAE 7,913 35,342 42,460 0Egyptian Financial Group-Hermes Holding 7,202 28,348 12,391 0Orascom Construction Industries 1,501 68,667 58,966 0Orascom Telecom Holding SAE 37,962 25,479 23,741 0Palm Hills Developments SAE 62,809 24,594 24,081 0Telecom Egypt Co 1,060,696 3,200,126 2,333,319 0.17Total Egypt 0.17% (2011: 0.18%) 2,494,958 0.17FinlandAmer Sports Oyj 18,398 235,304 272,149 0.02Cargotec Oyj 2,070 66,431 54,335 0Citycon OYJ 3,775 11,778 12,790 0Fortum OYJ 5,099 139,353 95,055 0.01HKScan OYJ 2,201 17,015 10,475 0Huhtamaki OYJ 45 557 728 0Kemira OYJ 1,300 16,657 20,155 0Kone OYJ 2,710 129,871 199,363 0.01Konecranes OYJ 692 22,931 23,301 0Metsa Board OYJ 3,467 13,453 10,056 0Metso OYJ 11,682 241,484 493,305 0.03Nokia OYJ 54,831 578,745 211,516 0.01Nokian Renkaat OYJ 2,972 98,657 117,743 0.01Outokumpu OYJ 23,160 67,425 24,214 0Outotec OYJ 617 23,655 34,466 0Ramirent OYJ 13,629 120,967 111,762 0.0194
<strong>STANLIB</strong> <strong>Funds</strong> <strong>Limited</strong>Portfolio Statement (continued)<strong>STANLIB</strong> Multi-Manager Global Equity Fund as at 31 December <strong>2012</strong> (continued)Common Stock continuedNominal holding Cost Market Value % of Net AssetsUSDUSDFinland (continued)Sampo 65,557 1,526,071 2,102,827 0.15Sponda OYJ 3,502 13,406 16,621 0Stockmann OYJ Abp 373 13,178 6,683 0Stora Enso OYJ 16,790 143,764 115,990 0.01Tieto OYJ 4,909 110,275 96,367 0.01Tikkurila Oyj 626 13,379 12,074 0Uponor OYJ 1,442 16,758 18,251 0Wartsila OYJ Abp 2,126 70,737 91,458 0.01YIT OYJ 1,430 31,497 27,808 0Total Finland 0.28% (2011: 0.24%) 4,179,492 0.28FranceAir France-KLM 1,116 10,629 10,292 0Air Liquide SA 4,132 451,056 517,518 0.03Alcatel-Lucent/France 14,059 186,668 19,542 0Alstom SA 4,039 202,523 160,334 0.01Alten SA 2,168 67,223 74,458 0.01Altran Technologies SA 3,185 12,580 24,102 0April 519 13,323 10,257 0AXA SA 32,202 624,677 566,343 0.04Beneteau SA 854 12,926 9,120 0BNP Paribas SA 29,432 1,715,564 1,649,113 0.11Bourbon SA 489 19,577 13,410 0Bouygues SA 10,816 464,957 318,275 0.02Bull 3,328 10,845 13,514 0Carrefour SA 12,513 437,963 318,968 0.02Casino Guichard Perrachon SA 2,855 262,500 271,308 0.02CFAO SA 600 21,614 28,952 0Christian Dior SA 1,073 123,376 181,355 0.01Cie de St-Gobain 22,636 926,788 959,001 0.06Cie Generale de Geophysique - Veritas 6,126 108,220 182,446 0.01Cie Generale des Etablissements Michelin 2,621 194,344 247,378 0.02Cie Generale d'Optique Essilor International SA 27,579 2,400,600 2,763,336 0.19Club Mediterranee SA 8,000 129,480 140,382 0.01Credit Agricole SA 18,176 200,900 145,742 0.01Danone SA 15,743 991,385 1,033,407 0.07Derichebourg SA 3,069 13,743 12,705 0Edenred 104,045 2,797,141 3,189,228 0.22Electricite de France SA 5,167 182,284 95,062 0.01Etablissements Maurel et Prom 1,030 12,677 17,144 0Euler Hermes SA 2,300 169,908 196,492 0.01Faiveley Transport SA 176 13,968 11,265 0Faurecia 608 13,235 9,346 095
<strong>STANLIB</strong> <strong>Funds</strong> <strong>Limited</strong>Portfolio Statement (continued)<strong>STANLIB</strong> Multi-Manager Global Equity Fund as at 31 December <strong>2012</strong> (continued)Common Stock continuedFrance (continued)Nominal holding Cost Market Value % of Net AssetsFFP 246 13,240 9,405 0Fimalac 326 12,700 14,828 0France Telecom SA 10,182 190,878 111,685 0.01GDF Suez 11,227 341,666 230,311 0.02Groupe Eurotunnel SA 17,289 185,397 133,046 0.01Groupe Steria SCA 471 12,998 8,818 0Havas SA 4,524 22,194 24,776 0Imerys SA 828 46,903 52,409 0Ingenico 541 14,000 30,634 0IPSOS 6,503 218,772 240,056 0.02Lafarge SA 2,684 134,982 170,398 0.01Legrand SA 9,735 290,317 408,521 0.03L'Oreal SA 2,691 289,347 371,806 0.03LVMH Moet Hennessy Louis Vuitton SA 3,068 436,162 561,216 0.04Maurel & Prom Nigeria SA 1,030 3,470 3,028 0Mercialys SA 488 16,345 11,034 0Neopost SA 2,424 244,668 127,511 0.01Nexans SA 298 20,298 13,161 0Nexity SA 399 13,457 13,388 0Orpea 326 12,386 14,387 0Pernod-Ricard SA 21,883 2,107,808 2,514,580 0.17Plastic Omnium SA 777 13,321 23,254 0PPR 4,969 756,819 919,766 0.06Publicis Groupe SA 2,524 117,227 150,374 0.01Rallye SA 434 14,906 14,473 0Renault SA 3,114 172,958 167,009 0.01Rubis SCA 322 14,521 21,969 0Sa des Ciments Vicat 986 100,872 60,791 0Safran SA 54,779 2,300,497 2,347,138 0.16Saft Groupe SA 384 13,236 8,920 0Sanofi 45,403 3,321,553 4,263,722 0.3Schneider Electric SA 73,563 4,496,249 5,312,792 0.37SEB SA 400 26,224 29,221 0Sechilienne-Sidec 484 13,791 9,169 0Sequana SA 151 8,263 1,640 0Societe BIC SA 1,330 83,655 157,898 0.01Societe Generale SA 10,682 553,972 399,112 0.03Societe Immobiliere de Location pour l'Industrie et leCommerceUSDUSD148 16,566 16,113 0Sodexo 2,528 163,434 212,204 0.01SOITEC 4,013 27,702 13,703 0Suez Environnement Co 9,352 165,719 111,890 0.0196
<strong>STANLIB</strong> <strong>Funds</strong> <strong>Limited</strong>Portfolio Statement (continued)<strong>STANLIB</strong> Multi-Manager Global Equity Fund as at 31 December <strong>2012</strong> (continued)Common Stock continuedNominal holding Cost Market Value % of Net AssetsUSDUSDFrance (continued)Technicolor SA 2,509 13,729 6,285 0Technip SA 2,577 183,495 294,697 0.02Teleperformance 287 7,016 10,311 0Thales SA 3,930 168,593 135,179 0.01Total SA 23,806 1,290,501 1,224,031 0.08UBISOFT Entertainment 1,340 13,221 13,850 0Unibail-Rodamco SE 1,444 260,340 346,386 0.02Valeo SA 1,000 45,165 49,591 0Vallourec SA 2,314 228,637 120,474 0.01Vilmorin & Cie 142 13,788 17,452 0Vinci SA 5,764 286,615 272,696 0.02Virbac SA 108 13,116 21,166 0Vivendi SA 21,040 480,589 470,034 0.03Total France 2.39% (2011: 3.08%) 35,478,103 2.39GermanyAareal Bank AG 878 15,422 18,104 0Adidas AG 4,840 292,484 429,248 0.03Aixtron SE NA 1,164 31,603 13,532 0Allianz SE 4,782 563,358 659,451 0.04Aurubis AG 620 29,145 44,009 0Axel Springer AG 1,218 44,008 52,407 0BASF SE 18,176 936,188 1,708,077 0.13Bauer AG 316 13,954 8,024 0Bayer AG 21,925 1,498,742 2,078,307 0.15Bayerische Motoren Werke AG 8,094 445,765 779,836 0.05BayWa AG 358 13,722 15,389 0Beiersdorf AG 1,923 109,514 156,501 0.01Bilfinger SE 2,772 241,699 266,235 0.02Celesio AG 1,632 38,198 28,014 0Commerzbank AG 55,379 222,565 104,772 0.01CTS Eventim AG 602 16,767 21,040 0Daimler AG 22,508 1,171,073 1,227,769 0.08Deutsche Bank AG 26,034 1,302,274 1,131,622 0.08Deutsche Boerse AG 2,878 207,250 174,785 0.01Deutsche Euroshop AG 464 14,357 19,370 0Deutsche Post AG 100,076 1,855,714 2,185,559 0.16Deutsche Telekom AG 97,956 1,190,122 1,111,536 0.07Deutsche Wohnen AG 1,626 18,274 29,990 0Deutz AG 2,203 14,275 10,194 0Drillisch AG 19,900 194,169 290,037 0.02E.ON SE 29,292 773,090 543,742 0.04ElringKlinger AG 10,897 306,375 365,194 0.0297
<strong>STANLIB</strong> <strong>Funds</strong> <strong>Limited</strong>Portfolio Statement (continued)<strong>STANLIB</strong> Multi-Manager Global Equity Fund as at 31 December <strong>2012</strong> (continued)Common Stock continuedNominal holding Cost Market Value % of Net AssetsUSDUSDGermany (continued)Freenet AG 1,368 14,313 25,268 0Fresenius Medical Care AG & Co KGaA 80,450 4,594,833 5,542,899 0.38Fresenius SE & Co KGaA 1,947 161,070 223,961 0.02Fuchs Petrolub AG 282 10,749 19,043 0GEA Group AG 8,602 222,080 277,507 0.02GFK SE 347 13,147 17,467 0Gildemeister AG 966 13,246 19,396 0Hannover Rueckversicherung AG 2,865 136,300 222,211 0.01HeidelbergCement AG 18,899 958,820 1,138,168 0.08Infineon Technologies AG 16,598 162,856 134,512 0.01IVG Immobilien AG 1,899 12,701 4,784 0K+S AG 2,782 194,025 127,711 0.01Kloeckner & Co SE 6,084 94,417 72,021 0Kontron AG 1,678 12,693 9,114 0Krones AG 236 13,599 14,580 0KWS Saat AG 82 13,409 26,162 0Leoni AG 419 13,644 15,763 0Linde AG 5,108 744,390 888,254 0.06MAN SE 1,060 123,713 112,707 0.01Merck KGaA 1,066 98,948 140,034 0.01MLP AG 1,840 14,190 12,275 0Morphosys AG 650 13,936 25,126 0MTU Aero Engines Holding AG 459 30,048 41,712 0Muenchener Rueckversicherungs AG 2,335 324,388 418,820 0.03Pfeiffer Vacuum Technology AG 174 14,126 20,887 0Rational AG 80 13,742 22,855 0Rheinmetall AG 501 26,732 23,980 0RWE AG 6,055 298,657 249,183 0.02SAP AG 16,851 933,796 1,350,070 0.1SGL Carbon SE 268 10,816 10,610 0Siemens AG 9,823 1,056,628 1,063,623 0.07Sky Deutschland AG 7,166 9,844 38,943 0Software AG 981 42,730 41,484 0Solarworld AG 1,100 13,169 1,527 0Stada Arzneimittel AG 900 30,365 28,999 0Symrise AG 1,114 28,551 39,750 0ThyssenKrupp AG 6,767 203,288 158,937 0.01TUI AG 5,786 53,369 59,805 0Vossloh AG 134 13,538 13,202 0Wincor Nixdorf AG 405 22,470 18,947 0Wirecard AG 1,421 18,609 34,752 0Total Germany 1.76% (2011: 1.54%) 26,179,793 1.7698
<strong>STANLIB</strong> <strong>Funds</strong> <strong>Limited</strong>Portfolio Statement (continued)<strong>STANLIB</strong> Multi-Manager Global Equity Fund as at 31 December <strong>2012</strong> (continued)Common Stock continuedGibraltarNominal holding Cost Market Value % of Net AssetsBwin.Party Digital Entertainment Plc 46,169 154,983 83,455 0.01Total Gibraltar 0.01% (2011: 0.00%) 83,455 0.01GreeceFolli Follie Group 1,509 21,560 25,564 0Frigoglass SA 2,991 12,632 20,426 0Hellenic Exchanges SA Holding Clearing Settlement andRegistryUSDUSD1,791 11,429 10,271 0JUMBO SA 3,597 24,383 27,838 0Motor Oil Hellas Corinth Refineries SA 13,947 101,490 151,146 0.02OPAP SA 3,088 27,755 21,984 0Piraeus Bank SA 30,000 43,410 13,329 0Titan Cement Co SA 800 14,451 14,365 0Viohalco Hellenic Copper and Aluminum Industry SA 2,321 12,469 12,117 0Total Greece 0.02% (2011: 0.02%) 297,040 0.02GuernseyAmdocs Ltd 130,760 4,103,276 4,441,917 0.3Resolution Ltd 16,769 67,568 67,410 0Total Guernsey 0.30% (2011: 0.00%) 4,509,327 0.3Hong KongAIA Group Ltd 1,199,000 4,185,540 4,679,457 0.32Bank Of China Ltd-H Cny1 1,396,000 641,852 624,989 0.04Bank of East Asia Ltd 30,000 123,860 114,954 0.01Beijing Enterprises Holdings Ltd 9,500 66,378 61,835 0BYD Electronic International Co Ltd 24,500 13,900 6,353 0Champion REIT 60,000 30,133 28,488 0Cheung Kong Holdings Ltd 55,000 804,736 840,873 0.06China Agri-Industries Holdings Ltd 24,000 30,555 13,438 0China Everbright International Ltd 44,000 16,799 22,251 0China Everbright Ltd 14,000 34,890 26,841 0China Merchants China Direct Investments Ltd 14,000 20,438 21,638 0China Merchants Holdings International Co Ltd 22,000 83,207 70,391 0China Mobile Ltd 708,500 7,403,477 8,249,631 0.57China Overseas Land & Investment Ltd 924,000 1,986,170 2,753,797 0.19China Pharmaceutical Group Ltd 44,000 13,807 12,659 0China Power International Development Ltd 83,000 17,209 26,128 0China Resources Enterprise Ltd 50,009 173,520 180,332 0.01China Resources Power Holdings Co Ltd 1,300,000 2,490,961 3,304,080 0.22China Taiping Insurance Holdings Co Ltd 14,200 47,962 28,764 0China Unicom Hong Kong Ltd 70,000 100,719 111,986 0.01CITIC Pacific Ltd 28,000 54,473 41,689 0CLP Holdings Ltd 27,500 210,296 229,908 0.02CNOOC Ltd 256,000 464,158 554,214 0.0499
<strong>STANLIB</strong> <strong>Funds</strong> <strong>Limited</strong>Portfolio Statement (continued)<strong>STANLIB</strong> Multi-Manager Global Equity Fund as at 31 December <strong>2012</strong> (continued)Common Stock continuedNominal holding Cost Market Value % of Net AssetsUSDUSDHong KongDah Chong Hong Holdings Ltd 97,000 103,259 101,743 0.01Guangdong Investment Ltd 44,000 24,064 34,514 0Hang Seng Bank Ltd 13,300 224,988 203,510 0.01Henderson Land Development Co Ltd 43,804 202,838 308,853 0.02Hong Kong & China Gas Co Ltd 107,250 217,551 291,270 0.02Hong Kong Aircraft Engineering Co Ltd 15,600 74,608 214,149 0.01Hong Kong Exchanges and Clearing Ltd 15,600 272,201 265,270 0.02Hongkong & Shanghai Hotels/The 270,648 214,766 377,825 0.03Hopewell Holdings Ltd 39,500 123,544 168,685 0.01Hutchison Whampoa Ltd 28,000 228,174 292,071 0.02I-CABLE Communications Ltd 592,000 155,912 32,856 0Interchina Holdings Co 255,000 17,752 14,816 0Lenovo Group Ltd 84,000 56,446 75,970 0.01Link REIT/The 361,951 1,280,788 1,809,538 0.12MTR Corp Ltd 38,000 140,083 149,287 0.01New World Development Co Ltd 2,668,418 3,647,751 4,124,307 0.28Next Media Ltd 570,000 171,719 102,201 0.01PCCW Ltd 280,000 108,572 122,836 0.01RREEF China Commercial Trust 5,300,000 – – –Shanghai Industrial Holdings Ltd 9,000 41,324 31,409 0Shougang Concord International Enterprises Co Ltd 288,000 28,673 16,531 0Shougang Fushan Resources Group Ltd 16,000 5,534 5,862 0Silver Grant International 184,000 72,579 37,978 0Singamas Container Holdings Ltd 50,000 12,515 11,870 0Sino-Ocean Land Holdings Ltd 99,000 57,889 73,696 0Sun Hung Kai Properties Ltd 21,000 313,738 314,830 0.02Swire Pacific Ltd 218,000 2,060,079 2,694,458 0.18Techtronic Industries Co 167,500 222,864 310,327 0.02Television Broadcasts Ltd 104,000 474,011 770,858 0.05Wharf Holdings Ltd 30,000 207,795 233,007 0.02Wheelock & Co Ltd 171,000 291,698 860,421 0.06Total Hong Kong 2.43% (2011: 1.57%) 36,055,644 2.43HungaryMagyar Telekom Telecommunications Plc 13,090 39,467 22,105 0MOL Hungarian Oil and Gas Plc 932 92,143 74,915 0.01OTP Bank Plc 5,582 102,018 104,623 0Total Hungary 0.01% (2011: 0.02%) 201,643 0.01IndiaAdani Enterprises Ltd 2,071 20,682 10,230 0Adani Ports and Special Economic Zone 6,515 20,199 16,005 0Alstom India Ltd 950 11,608 7,078 0Alstom T&D India Ltd 1,920 12,613 6,529 0100
<strong>STANLIB</strong> <strong>Funds</strong> <strong>Limited</strong>Portfolio Statement (continued)<strong>STANLIB</strong> Multi-Manager Global Equity Fund as at 31 December <strong>2012</strong> (continued)Common Stock continuedNominal holding Cost Market Value % of Net AssetsUSDUSDIndia (continued)Ambuja Cements Ltd 10,284 31,745 37,699 0Andhra Bank 7,000 21,716 15,050 0Apollo Hospitals Enterprise Ltd 2,169 23,602 31,165 0Aurobindo Pharma Ltd 4,240 14,195 14,649 0Axis Bank Ltd 3,348 91,622 82,664 0.01Bajaj Auto Ltd 1,256 34,473 48,920 0Balrampur Chini Mills Ltd 18,288 23,802 16,439 0Bharat Heavy Electricals Ltd 11,470 111,254 47,773 0Bharat Petroleum Corp Ltd 3,594 23,757 23,352 0Bharti Airtel Ltd 8,988 67,616 52,010 0Biocon Ltd 2,472 17,648 12,940 0Century Textiles & Industries Ltd 1,900 13,032 14,393 0CESC Ltd 3,000 20,206 17,412 0Cipla Ltd/India 5,687 41,224 42,972 0Coal India Ltd 7,643 51,301 49,521 0Dish TV India Ltd 47,712 61,723 66,224 0DLF Ltd 6,745 33,241 28,296 0Dr Reddy's Laboratories Ltd 1,636 56,705 54,574 0Emami Ltd 1,334 11,261 14,522 0Federal Bank Ltd 2,755 22,249 26,967 0GAIL India Ltd 7,105 72,398 46,087 0Gujarat Gas Co Ltd 1,888 16,505 10,510 0Gujarat NRE Coke Ltd 34,096 25,914 12,445 0Havells India Ltd 6,035 48,685 70,021 0HCL Technologies Ltd 3,122 33,547 35,200 0HDFC Bank Ltd 23,535 225,091 291,276 0.03Hero Motocorp Ltd 438 15,704 15,153 0Hindalco Industries Ltd 23,000 116,563 54,531 0Hindustan Oil Exploration Co Ltd 3,365 12,662 6,274 0Hindustan Unilever Ltd 13,037 77,272 124,790 0.02Housing Development Finance Corp 17,270 229,731 260,957 0.03ICICI Bank Ltd 14,370 440,105 462,935 0.05Idea Cellular Ltd 12,515 23,723 23,652 0IDFC Ltd 19,725 62,617 61,688 0India Cements Ltd 6,445 10,234 10,705 0Indraprastha Gas Ltd 2,500 17,204 11,359 0Infosys Ltd 7,299 482,884 308,164 0.03ITC Ltd 37,229 131,479 194,332 0.02Jain Irrigation Systems Ltd 5,966 22,227 7,971 0Jaiprakash Associates Ltd 26,204 47,705 46,321 0Jindal Saw Ltd 4,200 19,129 9,862 0Jindal Steel & Power Ltd 6,257 90,218 51,007 0101
<strong>STANLIB</strong> <strong>Funds</strong> <strong>Limited</strong>Portfolio Statement (continued)<strong>STANLIB</strong> Multi-Manager Global Equity Fund as at 31 December <strong>2012</strong> (continued)Common Stock continuedNominal holding Cost Market Value % of Net AssetsUSDUSDIndia (continued)JSW Steel Ltd 1,983 39,545 29,329 0Karnataka Bank Ltd 12,141 26,473 37,083 0Kotak Mahindra Bank Ltd 4,306 36,596 50,982 0Larsen & Toubro Ltd 3,358 120,399 98,337 0.01Lupin Ltd 2,071 19,256 23,146 0Mahindra & Mahindra Ltd 4,849 71,234 82,510 0.01Manappuram Finance Ltd 18,559 22,648 11,449 0Maruti Suzuki India Ltd 1,365 37,233 37,128 0McLeod Russel India Ltd 2,152 9,693 13,696 0Monnet Ispat & Energy Ltd 1,009 10,914 5,178 0NTPC Ltd 10,023 41,221 28,620 0Oil & Natural Gas Corp Ltd 14,156 91,869 69,139 0Parsvnath Developers Ltd 10,933 8,515 7,712 0Pipavav Defence & Offshore Engineering Co Ltd 6,823 12,040 11,251 0Power Grid Corp of India Ltd 23,746 50,197 49,755 0Ranbaxy Laboratories Ltd 1,766 21,091 16,229 0Reliance Industries Ltd 19,416 392,618 296,626 0.03Reliance Infrastructure Ltd 1,417 22,113 13,439 0Rolta India Ltd 10,493 24,712 11,740 0Rural Electrification Corp Ltd 4,469 24,026 20,077 0Sesa Goa Ltd 7,225 51,683 25,714 0Siemens Ltd 1,548 29,027 18,870 0State Bank of India 1,926 111,270 83,863 0.01Sterlite Industries India Ltd 17,528 50,950 37,142 0Sun Pharma Advanced Research Co Ltd 7,081 11,430 17,448 0Sun Pharmaceutical Industries Ltd 4,429 42,895 59,528 0Sun TV Network Ltd 6,543 34,694 51,058 0Tata Consultancy Services Ltd 8,880 212,565 203,086 0.02Tata Global Beverages Ltd 8,000 18,661 23,340 0Tata Motors Ltd 22,988 100,890 131,241 0.02Tata Power Co Ltd 10,810 29,340 21,802 0Tata Steel Ltd 5,813 80,755 45,483 0Thermax Ltd 1,079 16,993 12,119 0Torrent Pharmaceuticals Ltd 1,400 17,887 18,525 0Triveni Turbine Ltd 9,542 5,781 10,371 0Ultratech Cement Ltd 1,293 28,583 46,850 0United Breweries Ltd 6,062 48,328 102,475 0.02United Spirits Ltd 802 22,011 27,771 0Wipro Ltd 8,313 79,505 59,719 0Zee Entertainment Enterprises Ltd 51,855 126,693 208,405 0.02Total India 0.33% (2011: 0.49%) 4,970,860 0.33102
<strong>STANLIB</strong> <strong>Funds</strong> <strong>Limited</strong>Portfolio Statement (continued)<strong>STANLIB</strong> Multi-Manager Global Equity Fund as at 31 December <strong>2012</strong> (continued)Common Stock continuedNominal holding Cost Market Value % of Net AssetsUSDUSDIndonesiaAce Hardware Indonesia Tbk PT 285,000 12,225 24,254 0Adaro Energy Tbk PT 236,500 51,944 38,762 0AKR Corporindo Tbk PT 47,000 7,822 20,238 0Alam Sutera Realty Tbk PT 378,500 14,497 23,581 0Astra International Tbk PT 300,000 159,937 233,459 0.02Bakrie and Brothers Tbk PT 5,386,500 30,768 27,946 0Bakrie Telecom Tbk PT 2,000,000 28,811 10,400 0Bakrieland Development Tbk PT 1,196,500 15,433 6,581 0Bank Bukopin Tbk PT 1,958,000 131,866 123,941 0.01Bank Central Asia Tbk PT 165,500 109,447 155,405 0.01Bank Danamon Indonesia Tbk PT 42,500 22,185 24,697 0Bank Mandiri Persero Tbk PT 149,000 101,860 124,460 0.01Bank Negara Indonesia Persero Tbk PT 117,500 42,518 45,108 0Bank Pan Indonesia Tbk PT 7,135,027 311,833 451,646 0.04Bank Rakyat Indonesia Persero 246,086 142,740 176,198 0.01Bumi Resources Tbk PT 199,500 40,530 12,209 0Ciputra Development Tbk PT 1,704,500 130,648 139,769 0.01Citra Marga Nusaphala Persada Tbk PT 228,500 40,571 39,828 0Delta Dunia Makmur Tbk PT 1,606,000 48,010 25,375 0Gudang Garam Tbk PT 13,500 41,947 78,724 0.01Holcim Indonesia Tbk PT 75,000 16,183 22,373 0Indo Tambangraya Megah Tbk PT 5,000 21,525 21,271 0Indocement Tunggal Prakarsa Tbk PT 17,500 31,807 40,675 0Indofood Sukses Makmur Tbk PT 536,500 86,296 325,655 0.03Intiland Development Tbk PT 410,000 10,655 14,268 0Kalbe Farma Tbk PT 462,500 33,751 49,904 0Lippo Karawaci Tbk PT 441,000 37,099 45,291 0Matahari Putra Prima Tbk PT 2,084,650 101,674 248,698 0.03Mayora Indah Tbk PT 7,500 11,372 15,564 0Medco Energi Internasional Tbk PT 93,000 28,337 15,726 0Mitra Adiperkasa Tbk PT 152,000 112,333 104,090 0.01Perusahaan Gas Negara Persero Tbk PT 151,000 68,726 70,109 0Semen Indonesia Persero Tbk PT 78,500 50,060 128,693 0.01Sumber Alfaria Trijaya Tbk PT 1,841 838 955 0Tambang Batubara Bukit Asam Persero Tbk PT 20,000 40,047 31,128 0Telekomunikasi Indonesia Persero Tbk PT 136,500 124,336 126,058 0.01Timah Persero Tbk PT 119,500 27,230 19,096 0Unilever Indonesia Tbk PT 20,000 36,965 43,164 0United Tractors Tbk PT 34,000 73,244 69,323 0Total Indonesia 0.21% (2011: 0.27%) 3,174,622 0.21IrelandAccenture Plc 20,950 1,120,784 1,393,174 0.09103
<strong>STANLIB</strong> <strong>Funds</strong> <strong>Limited</strong>Portfolio Statement (continued)<strong>STANLIB</strong> Multi-Manager Global Equity Fund as at 31 December <strong>2012</strong> (continued)Common Stock continuedNominal holding Cost Market Value % of Net AssetsUSDUSDIreland (continued)Alkermes Plc 2,000 31,727 37,020 0Bank of Ireland 1,232,341 171,676 182,017 0.01C&C Group Plc 31,965 154,337 190,567 0.01Covidien Plc 6,689 286,120 386,156 0.03CRH Plc 13,987 316,327 283,278 0.02DCC Plc 5,711 172,015 186,275 0.01Eaton Corp Plc 35,689 1,761,322 1,934,343 0.14Elan Corp Plc 48,186 519,685 491,632 0.03Glanbia Plc 3,156 13,981 34,489 0Grafton Group Plc 3,553 13,234 17,800 0Greencore Group Plc 8,172 11,582 13,483 0Independent News & Media Plc 47,504 284,739 2,256 0Ingersoll-Rand Plc 4,779 180,673 229,201 0.02Irish Bank Resolution Corp Ltd 13,300 123,908 – –Irish Continental Group Plc 3,478 77,265 87,397 0.01Kerry Group Plc 3,394 111,846 177,552 0.01Kingspan Group Plc 1,969 15,191 21,157 0Paddy Power Plc 4,526 140,864 356,723 0.02Prothena Corp Plc 1,174 12,168 7,913 0Seagate Technology Plc 7,701 138,741 234,726 0.02Smurfit Kappa Group Plc 2,121 15,129 24,848 0Willis Group Holdings Plc 3,286 108,616 110,081 0.01XL Group Plc 6,158 126,453 154,258 0.01Total Ireland 0.44% (2011: 0.26%) 6,556,346 0.44Isle of ManGenting Singapore Plc 225,880 178,052 255,199 0.02Playtech Ltd 22,903 131,584 158,223 0.01Total Isle of Man 0.03% (2011: 0.02%) 413,422 0.03IsraelAL-ROV Israel Ltd 1,156 29,297 28,219 0B Communications Ltd 2,415 35,759 10,149 0Bank Leumi Le-Israel BM 38,756 167,268 131,088 0.01Check Point Software Technologies Ltd 22,800 1,175,349 1,086,192 0.08Clicksoftware Technologies Ltd 17,800 202,556 149,342 0.01Harel Insurance Investments & Financial Services Ltd 530 23,151 23,680 0Israel Chemicals Ltd 11,917 145,668 142,514 0.01Mizrahi Tefahot Bank Ltd 16,100 144,073 166,001 0.01NICE Systems Ltd 3,400 132,258 113,696 0.01Phoenix Holdings Ltd/The 3,167 7,367 8,743 0Property & Building Corp 670 28,088 32,574 0Teva Pharmaceutical Industries Ltd 13,272 650,861 493,708 0.03Total Israel 0.16% (2011: 0.07%) 2,385,906 0.16104
<strong>STANLIB</strong> <strong>Funds</strong> <strong>Limited</strong>Portfolio Statement (continued)<strong>STANLIB</strong> Multi-Manager Global Equity Fund as at 31 December <strong>2012</strong> (continued)Common Stock continuedNominal holding Cost Market Value % of Net AssetsUSDUSDItalyACEA SpA 1,157 13,787 6,940 0Ansaldo STS SpA 1,301 12,630 12,092 0Arnoldo Mondadori Editore SpA 4,655 11,865 6,837 0Assicurazioni Generali SpA 14,676 248,643 265,656 0.02Astaldi SpA 2,203 14,120 14,682 0ASTM SpA 967 12,757 9,957 0Atlantia SpA 8,036 149,870 144,827 0.01Azimut Holding SpA 1,593 13,665 22,766 0Banca Generali SpA 1,526 16,209 25,973 0Banca Piccolo Credito Valtellinese Scarl 12,000 26,051 18,446 0Banca Popolare dell'Emilia Romagna Scrl 3,854 38,894 26,548 0Banca Popolare di Sondrio SCARL 2,518 21,090 14,540 0Beni Stabili SpA 16,171 13,090 9,510 0CIR-Compagnie Industriali Riunite SpA 6,973 13,319 7,258 0Credito Emiliano SpA 1,967 12,682 10,648 0Danieli & C Officine Meccaniche SpA 1,186 13,178 19,780 0Davide Campari-Milano SpA 13,307 72,402 101,753 0.01De'Longhi SpA 11,100 140,549 159,803 0.01DiaSorin SpA 351 14,636 14,012 0Enel SpA 67,084 325,676 277,533 0.02Eni SpA 344,187 7,601,405 8,322,133 0.57ERG SpA 1,007 13,304 10,116 0Fiat Industrial SpA 37,598 230,068 408,942 0.03Fiat SpA 47,711 231,696 238,398 0.02Finmeccanica SpA 29,366 322,681 168,414 0.01Hera SpA 7,192 13,996 11,606 0Impregilo SpA 5,070 13,843 23,622 0Indesit Co SpA 1,129 11,994 8,603 0Interpump Group SpA 25,632 210,122 195,828 0.01Intesa Sanpaolo SpA 141,228 346,989 242,051 0.02Iren SpA 30,000 26,022 18,177 0Italmobiliare SpA 604 13,035 6,319 0Luxottica Group SpA 16,792 356,583 691,883 0.05Maire Tecnimont SpA 3,679 13,241 1,962 0MARR SpA 1,533 14,370 15,967 0Piaggio & C SpA 4,853 13,314 12,988 0Recordati SpA 1,776 13,417 16,121 0Safilo Group SpA 1,201 14,056 10,450 0Saipem SpA 16,309 343,180 629,994 0.04Societa Cattolica di Assicurazioni SCRL 647 14,850 9,937 0Sorin SpA 6,829 13,719 15,117 0Stmicroelectronics NV Eur1.04 18,232 142,440 128,621 0.01105
<strong>STANLIB</strong> <strong>Funds</strong> <strong>Limited</strong>Portfolio Statement (continued)<strong>STANLIB</strong> Multi-Manager Global Equity Fund as at 31 December <strong>2012</strong> (continued)Common Stock continuedNominal holding Cost Market Value % of Net AssetsUSDUSDItaly (continued)Telecom Italia SpA 247,696 296,600 209,218 0.02Terna Rete Elettrica Nazionale SpA 39,199 163,529 156,177 0.01Tod's SpA 174 13,405 21,931 0Trevi Finanziaria Industriale SpA 837 13,463 4,458 0UniCredit SpA 66,370 543,501 324,105 0.02Unione di Banche Italiane SCPA 30,255 266,969 139,766 0.01Total Italy 0.89% (2011: 0.70%) 13,212,465 0.89Japan77 Bank Ltd/The 6,000 23,148 23,871 0ABC-Mart Inc 1,200 43,415 52,183 0Accordia Golf Co Ltd 30 23,918 27,861 0ADEKA Corp 1,600 16,458 13,693 0Advance Residence Investment Corp 14 29,375 28,675 0Aica Kogyo Co Ltd 1,200 13,603 19,319 0Aichi Steel Corp 3,000 13,526 13,982 0Aisin Seiki Co Ltd 4,400 128,269 135,514 0.01Ajinomoto Co Inc 30,000 327,173 396,576 0.03Akebono Brake Industry Co Ltd 3,000 16,357 13,878 0Alfresa Holdings Corp 6,100 248,179 237,749 0.02Alpen Co Ltd 800 13,179 14,045 0Alpine Electronics Inc 1,100 14,327 10,063 0Alps Electric Co Ltd 2,500 24,969 14,919 0Amano Corp 2,400 20,542 20,818 0Anritsu Corp 2,000 12,675 23,524 0AOKI Holdings Inc 900 12,981 20,516 0Aozora Bank Ltd 362,000 1,020,468 1,105,295 0.07Asahi Co Ltd 700 9,590 9,990 0Asahi Diamond Industrial Co Ltd 1,000 15,507 9,819 0Asahi Glass Co Ltd 14,000 142,993 101,035 0.01Asahi Holdings Inc 700 14,155 11,763 0ASKUL Corp 700 14,051 9,318 0Astellas Pharma Inc 66,000 2,797,109 2,954,027 0.21Autobacs Seven Co Ltd 300 13,719 12,560 0Avex Group Holdings Inc 1,000 13,165 20,193 0Awa Bank Ltd/The 4,000 24,925 22,714 0Azbil Corp 6,100 94,042 122,755 0.01Bank of Yokohama Ltd/The 22,000 116,360 101,521 0.01Bic Camera Inc 33 14,148 16,354 0Bridgestone Corp 9,800 194,699 251,730 0.02Canon Electronics Inc 500 12,760 10,918 0Canon Inc 136,600 5,529,911 5,276,625 0.37Capcom Co Ltd 12,400 248,511 188,585 0.01106
<strong>STANLIB</strong> <strong>Funds</strong> <strong>Limited</strong>Portfolio Statement (continued)<strong>STANLIB</strong> Multi-Manager Global Equity Fund as at 31 December <strong>2012</strong> (continued)Common Stock continuedNominal holding Cost Market Value % of Net AssetsUSDUSDJapan (continued)Central Glass Co Ltd 3,000 13,221 10,027 0Central Japan Railway Co 2,100 179,617 169,525 0.01Century Tokyo Leasing Corp 1,100 13,994 22,670 0Chiba Bank Ltd/The 46,000 279,500 268,129 0.02Chiyoda Co Ltd 10,600 251,920 265,046 0.02Chubu Electric Power Co Inc 9,400 215,417 124,370 0.01Chugai Pharmaceutical Co Ltd 8,400 149,613 160,393 0.01Chugoku Electric Power Co Inc/The 7,800 163,810 121,873 0.01Chugoku Marine Paints Ltd 2,000 14,516 11,959 0CKD Corp 2,100 13,848 13,115 0Cosel Co Ltd 1,200 16,348 14,711 0Credit Saison Co Ltd 130,700 2,739,838 3,240,862 0.23CyberAgent Inc 4 13,109 8,188 0Daibiru Corp 2,100 15,522 19,236 0Daiei Inc/The 4,050 16,672 9,274 0Daifuku Co Ltd 2,500 13,922 15,989 0Daihen Corp 3,000 12,481 8,778 0Dai-ichi Life Insurance Co Ltd/The 453 566,154 628,170 0.04Daiichi Sankyo Co Ltd 11,900 232,538 181,807 0.01Dainippon Screen Manufacturing Co Ltd 3,000 27,972 18,111 0Daio Paper Corp 2,000 17,370 14,572 0Daiseki Co Ltd 800 15,919 11,029 0Daishi Bank Ltd/The 6,000 19,593 18,736 0Daito Trust Construction Co Ltd 41,200 3,030,894 3,873,891 0.27Daiwa House Industry Co Ltd 15,000 157,819 256,058 0.02Daiwa Securities Group Inc 35,000 152,402 191,464 0.01Daiwahouse Residential Investment Corp 4 26,598 31,180 0DCM Holdings Co Ltd 2,600 13,691 17,020 0Denso Corp 7,100 213,103 244,043 0.02Dentsu Inc 15,000 393,843 399,873 0.03DIC Corp 9,000 21,687 16,550 0Disco Corp 100 6,616 5,176 0Don Quijote Co Ltd 3,600 136,262 131,776 0.01Doshisha Co Ltd 500 10,771 13,057 0Doutor Nichires Holdings Co Ltd 1,000 13,083 13,011 0Dr Ci:Labo Co Ltd 4 12,345 12,472 0Duskin Co Ltd 100 1,812 1,804 0Dydo Drinco Inc 400 14,633 16,192 0East Japan Railway Co 13,800 864,921 888,984 0.06Ebara Corp 7,000 38,921 29,145 0EDION Corp 1,800 14,679 7,911 0Exedy Corp 500 14,242 10,906 0107
<strong>STANLIB</strong> <strong>Funds</strong> <strong>Limited</strong>Portfolio Statement (continued)<strong>STANLIB</strong> Multi-Manager Global Equity Fund as at 31 December <strong>2012</strong> (continued)Common Stock continuedNominal holding Cost Market Value % of Net AssetsUSDUSDJapan (continued)FANUC Corp 28,200 3,966,324 5,188,943 0.36FCC Co Ltd 700 14,084 14,459 0Frontier Real Estate Investment Corp 4 32,685 34,881 0Fuji Heavy Industries Ltd 196,000 1,787,249 2,434,555 0.17Fuji Oil Co Ltd/Osaka 1,100 15,887 15,877 0Fuji Seal International Inc 600 12,387 12,060 0FUJIFILM Holdings Corp 17,700 368,834 352,506 0.02Fujikura Ltd 7,000 32,286 21,616 0Fujitsu Frontech Ltd 2,700 32,203 14,302 0Fujitsu Ltd 73,000 381,435 303,096 0.02Fukuoka Financial Group Inc 39,000 193,497 154,709 0.01Fuyo General Lease Co Ltd 600 15,784 19,388 0Geo Holdings Corp 11 12,521 11,450 0Glory Ltd 4,200 88,911 96,663 0.01GMO internet Inc 12,100 57,260 77,947 0.01Godo Steel Ltd 5,000 10,776 9,831 0Heiwa Real Estate Co Ltd 1,700 20,198 23,004 0HIS Co Ltd 600 14,085 20,353 0Hitachi Chemical Co Ltd 2,200 32,455 32,848 0Hitachi Kokusai Electric Inc 2,000 15,868 14,572 0Hitachi Ltd 274,000 1,411,255 1,597,119 0.12Hitachi Metals Ltd 14,000 115,542 118,198 0.01Hitachi Zosen Corp 13,500 19,657 18,892 0Hogy Medical Co Ltd 300 14,941 14,208 0Hokuetsu Kishu Paper Co Ltd 2,500 13,077 14,399 0Hokuto Corp 700 14,508 13,714 0Honda Motor Co Ltd 19,200 662,307 698,364 0.05Horiba Ltd 600 16,407 17,272 0Hoshizaki Electric Co Ltd 800 14,260 21,197 0Hosiden Corp 1,700 13,821 10,420 0House Foods Corp 1,500 24,331 22,553 0Hoya Corp 6,700 157,335 130,877 0.01Ibiden Co Ltd 5,500 150,185 86,827 0.01Iino Kaiun Kaisha Ltd 4,400 21,824 15,979 0Inpex Corp 28 167,123 147,991 0.01Iseki & Co Ltd 6,000 15,252 15,475 0Isetan Mitsukoshi Holdings Ltd 30,000 306,245 291,795 0.02ITOCHU Corp 55,900 557,048 585,731 0.04Itoham Foods Inc 4,000 14,446 17,487 0Jaccs Co Ltd 3,000 8,032 16,134 0Japan Airport Terminal Co Ltd 900 15,287 9,222 0Japan Exchange Group Inc 100 5,219 4,973 0108
<strong>STANLIB</strong> <strong>Funds</strong> <strong>Limited</strong>Portfolio Statement (continued)<strong>STANLIB</strong> Multi-Manager Global Equity Fund as at 31 December <strong>2012</strong> (continued)Common Stock continuedNominal holding Cost Market Value % of Net AssetsUSDUSDJapan (continued)Japan Logistics Fund Inc 2 17,372 17,371 0Japan Real Estate Investment Corp 22 202,836 215,509 0.01Japan Securities Finance Co Ltd 4,300 23,903 27,253 0Japan Tobacco Inc 13,800 270,192 389,429 0.03JFE Holdings Inc 6,200 160,850 114,872 0.01JX Holdings Inc 70,270 389,663 391,720 0.03Kagome Co Ltd 1,400 26,957 26,684 0Kaken Pharmaceutical Co Ltd 2,000 25,758 29,353 0Kansai Electric Power Co Inc/The 10,400 225,340 108,733 0.01Kao Corp 25,300 643,142 658,066 0.04Kawasaki Heavy Industries Ltd 39,000 104,048 104,645 0.01KDDI Corp 3,300 182,479 232,048 0.02Keihin Corp 800 15,239 11,316 0Keiyo Bank Ltd/The 38,000 183,239 167,002 0.01Kenedix Realty Investment Corp 5 17,142 17,406 0Kewpie Corp 2,000 27,416 27,549 0Keyence Corp 11,580 2,754,811 3,191,481 0.22Kinden Corp 15,000 86,697 96,975 0.01Kintetsu Corp 37,000 121,502 151,056 0.01Kirin Holdings Co Ltd 38,000 498,380 444,760 0.03Kitz Corp 2,800 12,689 13,115 0Kiyo Holdings Inc 16,000 21,482 23,315 0Koa Corp 1,400 14,541 11,237 0Kobayashi Pharmaceutical Co Ltd 200 9,771 9,472 0Kobe Steel Ltd 88,000 192,902 110,933 0.01Kohnan Shoji Co Ltd 1,100 12,367 13,422 0Komatsu Ltd 11,600 272,192 292,733 0.02Komori Corp 2,900 23,027 23,947 0Konica Minolta Holdings Inc 14,000 135,860 99,740 0.01Kubota Corp 22,000 195,015 250,622 0.02Kurabo Industries Ltd 8,000 13,048 13,601 0Kuraray Co Ltd 11,700 153,825 152,094 0.01Kureha Corp 3,000 15,308 10,825 0Kuroda Electric Co Ltd 1,800 21,765 21,151 0KYB Co Ltd 3,000 14,050 12,005 0Kyocera Corp 2,100 190,343 188,712 0.01Kyodo Printing Co Ltd 7,000 16,907 17,973 0Kyoei Steel Ltd 800 12,741 15,128 0KYORIN Holdings Inc 1,000 13,596 19,384 0Kyowa Hakko Kirin Co Ltd 6,000 59,297 58,914 0Leopalace21 Corp 5,000 9,990 20,471 0LIXIL Group Corp 25,200 488,515 558,704 0.04109
<strong>STANLIB</strong> <strong>Funds</strong> <strong>Limited</strong>Portfolio Statement (continued)<strong>STANLIB</strong> Multi-Manager Global Equity Fund as at 31 December <strong>2012</strong> (continued)Common Stock continuedNominal holding Cost Market Value % of Net AssetsUSDUSDJapan (continued)Maeda Corp 5,000 13,107 26,196 0Makino Milling Machine Co Ltd 3,000 18,288 18,285 0Mandom Corp 500 13,450 13,734 0Marubeni Corp 24,000 179,739 169,872 0.01Marui Group Co Ltd 23,300 227,226 184,858 0.01Mazda Motor Corp 64,000 150,568 128,051 0.01Meidensha Corp 4,000 12,769 13,462 0Meitec Corp 800 13,990 17,552 0Melco Holdings Inc 400 13,692 7,027 0Mirait Holdings Corp 1,800 13,568 16,279 0MISUMI Group Inc 1,200 28,206 32,476 0Mitsubishi Chemical Holdings Corp 24,000 135,169 117,967 0.01Mitsubishi Corp 26,000 610,941 494,650 0.03Mitsubishi Electric Corp 26,000 230,569 219,211 0.01Mitsubishi Estate Co Ltd 33,000 563,896 781,635 0.05Mitsubishi Heavy Industries Ltd 88,000 370,182 421,353 0.03Mitsubishi Motors Corp 136,000 168,246 139,985 0.01Mitsubishi Steel Manufacturing Co Ltd 6,000 12,233 11,866 0Mitsubishi UFJ Financial Group Inc 251,000 1,390,054 1,335,345 0.1Mitsui & Co Ltd 19,500 289,311 289,123 0.02Mitsui Chemicals Inc 100,000 272,363 257,910 0.02Mitsui Fudosan Co Ltd 13,000 210,452 313,931 0.02Mitsui Mining & Smelting Co Ltd 11,000 34,197 26,843 0Mitsui OSK Lines Ltd 30,000 197,218 87,780 0.01Mizuho Financial Group Inc 251,900 414,401 454,478 0.03Mori Trust Sogo Reit Inc 2 20,101 16,793 0Moshi Moshi Hotline Inc 1,200 12,275 15,211 0MS&AD Insurance Group Holdings 27,700 581,315 544,934 0.04Murata Manufacturing Co Ltd 20,100 1,175,158 1,166,970 0.09Musashi Seimitsu Industry Co Ltd 800 18,182 16,719 0Nachi-Fujikoshi Corp 4,000 11,184 16,053 0Namco Bandai Holdings Inc 13,900 205,308 179,567 0.01Nanto Bank Ltd/The 5,000 27,686 22,611 0NEC Corp 58,000 158,662 120,744 0.01NEC Networks & System Integration Corp 1,100 14,084 19,477 0NET One Systems Co Ltd 2,200 13,033 21,576 0NGK Insulators Ltd 9,000 150,022 105,650 0.01Nichias Corp 3,000 13,141 16,273 0Nichicon Corp 1,300 15,834 11,021 0Nichiha Corp 1,500 11,604 17,296 0Nichi-iko Pharmaceutical Co Ltd 600 18,545 11,575 0Nichirei Corp 6,000 29,296 31,157 0110
<strong>STANLIB</strong> <strong>Funds</strong> <strong>Limited</strong>Portfolio Statement (continued)<strong>STANLIB</strong> Multi-Manager Global Equity Fund as at 31 December <strong>2012</strong> (continued)Common Stock continuedNominal holding Cost Market Value % of Net AssetsUSDUSDJapan (continued)Nidec Corp 1,800 162,192 104,088 0.01Nifco Inc/Japan 1,000 25,701 22,021 0Nihon Kohden Corp 700 14,060 21,187 0Nihon Parkerizing Co Ltd 11,000 161,074 156,861 0.01Nikkiso Co Ltd 2,000 14,353 21,211 0Nintendo Co Ltd 1,300 289,754 137,119 0.01Nippo Corp 2,000 13,608 27,456 0Nippon Accommodations Fund Inc 3 22,496 20,818 0Nippon Building Fund Inc 19 168,258 195,790 0.01Nippon Carbon Co Ltd 5,000 14,912 10,236 0Nippon Chemi-Con Corp 3,000 12,687 6,280 0Nippon Denko Co Ltd 5,000 25,450 14,746 0Nippon Densetsu Kogyo Co Ltd 1,000 9,635 9,345 0Nippon Electric Glass Co Ltd 14,000 159,289 78,852 0.01Nippon Express Co Ltd 33,000 129,856 135,105 0.01Nippon Flour Mills Co Ltd 3,000 15,798 12,144 0Nippon Konpo Unyu Soko Co Ltd 200 2,275 2,322 0Nippon Light Metal Holdings Co Ltd 10,000 15,029 11,797 0Nippon Meat Packers Inc 18,000 235,523 248,564 0.02Nippon Paint Co Ltd 3,000 22,473 25,640 0Nippon Shinyaku Co Ltd 2,000 24,702 22,483 0Nippon Shokubai Co Ltd 25,000 286,935 254,728 0.02Nippon Signal Co Ltd 3,000 22,556 21,165 0Nippon Soda Co Ltd 4,000 14,912 18,227 0Nippon Steel & Sumitomo Metal Corp 110,835 344,594 269,185 0.02Nippon Steel Trading Co Ltd 5,000 13,745 13,185 0Nippon Suisan Kaisha Ltd 31,700 68,572 64,893 0Nippon Telegraph & Telephone Corp 20,500 962,916 859,452 0.06Nippon Thompson Co Ltd 21,000 127,250 92,778 0.01Nippon Yusen KK 46,000 188,523 106,403 0.01Nishi-Nippon City Bank Ltd/The 45,000 127,814 110,336 0.01Nissan Motor Co Ltd 110,400 985,268 1,035,497 0.07Nisshin Oillio Group Ltd/The 3,000 14,050 11,103 0Nisshinbo Holdings Inc 3,000 27,193 25,120 0Nissin Kogyo Co Ltd 1,400 20,442 21,421 0Nittetsu Mining Co Ltd 4,000 14,260 17,487 0Nitto Boseki Co Ltd 6,000 12,932 23,524 0Nitto Denko Corp 2,900 108,088 141,202 0.01NKSJ Holdings Inc 14,650 372,848 310,061 0.02NOF Corp 3,000 12,268 13,427 0Nomura Holdings Inc 46,500 208,677 270,509 0.02Noritz Corp 800 14,847 13,314 0111
<strong>STANLIB</strong> <strong>Funds</strong> <strong>Limited</strong>Portfolio Statement (continued)<strong>STANLIB</strong> Multi-Manager Global Equity Fund as at 31 December <strong>2012</strong> (continued)Common Stock continuedNominal holding Cost Market Value % of Net AssetsUSDUSDJapan (continued)North Pacific Bank Ltd 4,700 18,074 13,154 0NSD Co Ltd 2,300 21,870 20,030 0NSK Ltd 21,000 121,616 147,666 0.01NTT Data Corp 176 585,716 546,737 0.04NTT DOCOMO Inc 191 334,013 273,914 0.02Obayashi Corp 62,000 297,363 347,051 0.02Obic Co Ltd 1,400 277,306 279,142 0.02Odakyu Electric Railway Co Ltd 19,000 179,174 197,328 0.01Ohsho Food Service Corp 700 16,686 16,523 0Oiles Corp 800 12,815 16,016 0Oji Holdings Corp 30,000 145,082 102,702 0.01Oki Electric Industry Co Ltd 17,000 13,270 20,645 0Okinawa Cellular Telephone Co 8,600 178,347 182,812 0.01Okinawa Electric Power Co Inc/The 2,000 81,573 62,337 0Olympus Corp 7,200 182,701 138,645 0.01Omron Corp 6,000 144,504 142,393 0.01Onward Holdings Co Ltd 15,000 147,193 113,109 0.01Orient Corp 18,000 13,841 67,657 0ORIX Corp 1,660 143,732 185,842 0.01Orix JREIT Inc 5 26,500 24,605 0Otsuka Holdings Co Ltd 7,900 220,744 222,021 0.01Panasonic Corp 27,400 310,036 165,101 0.01Parco Co Ltd 300 2,212 3,234 0Penta-Ocean Construction Co Ltd 5,000 6,932 13,416 0Pigeon Corp 400 14,819 19,060 0Pioneer Corp 3,700 12,458 9,158 0Rakuten Inc 13,400 112,129 103,989 0.01Resona Holdings Inc 31,900 157,006 144,255 0.01Resorttrust Inc 900 13,358 17,643 0Ricoh Co Ltd 12,000 149,040 125,738 0.01Ricoh Leasing Co Ltd 900 20,906 22,650 0Ryobi Ltd 4,000 14,819 10,733 0Ryohin Keikaku Co Ltd 400 24,252 22,321 0Ryosan Co Ltd 2,000 44,112 35,205 0Sanden Corp 4,000 14,446 16,747 0Sangetsu Co Ltd 600 12,848 14,593 0San-In Godo Bank Ltd/The 3,000 23,969 20,957 0Sanken Electric Co Ltd 3,000 10,380 11,415 0Sanki Engineering Co Ltd 2,000 15,472 9,738 0Sankyu Inc 7,000 32,028 26,230 0Sanyo Shokai Ltd 6,000 18,393 15,960 0Sanyo Special Steel Co Ltd 3,000 15,204 10,617 0112
<strong>STANLIB</strong> <strong>Funds</strong> <strong>Limited</strong>Portfolio Statement (continued)<strong>STANLIB</strong> Multi-Manager Global Equity Fund as at 31 December <strong>2012</strong> (continued)Common Stock continuedNominal holding Cost Market Value % of Net AssetsUSDUSDJapan (continued)Sapporo Holdings Ltd 5,000 19,727 16,134 0Sawai Pharmaceutical Co Ltd 100 10,637 10,050 0Secom Co Ltd 12,300 584,676 615,961 0.04Sega Sammy Holdings Inc 7,100 134,531 119,476 0.01Seiko Holdings Corp 4,000 12,209 9,576 0Sekisui House Ltd 42,000 412,062 457,086 0.03Senko Co Ltd 4,000 12,489 17,440 0Senshu Ikeda Holdings Inc 3,380 22,999 19,272 0Seven & I Holdings Co Ltd 27,800 757,269 783,537 0.05Sharp Corp/Japan 38,000 259,067 133,163 0.01Shiga Bank Ltd/The 4,000 21,049 24,657 0Shikoku Electric Power Co Inc 7,200 179,628 114,081 0.01Shimachu Co Ltd 900 20,513 18,809 0Shimamura Co Ltd 11,600 1,289,174 1,122,906 0.09Shimizu Corp 39,000 155,589 145,688 0.01Shin-Etsu Chemical Co Ltd 79,200 4,096,069 4,790,561 0.33Shinko Plantech Co Ltd 2,200 19,854 17,327 0Shinmaywa Industries Ltd 4,000 14,400 26,878 0Shinsei Bank Ltd 674,000 910,191 1,332,970 0.1Shionogi & Co Ltd 7,600 141,796 126,307 0.01Shiseido Co Ltd 8,400 114,713 118,133 0.01Shizuoka Bank Ltd/The 21,000 179,017 204,257 0.01SHO-BOND Holdings Co Ltd 600 13,484 22,344 0Shochiku Co Ltd 2,000 14,004 20,563 0Showa Corp 2,400 13,421 23,593 0Sintokogio Ltd 1,900 16,440 14,986 0SMC Corp/Japan 9,100 1,530,302 1,634,454 0.12Softbank Corp 41,647 1,349,304 1,510,012 0.11Sony Corp 12,300 302,663 136,138 0.01Start Today Co Ltd 1,100 29,465 10,190 0Sumitomo Corp 17,600 220,054 223,701 0.02Sumitomo Electric Industries Ltd 80,500 903,669 918,908 0.06Sumitomo Forestry Co Ltd 24,100 182,684 226,882 0.02Sumitomo Metal Mining Co Ltd 14,000 242,109 195,269 0.01Sumitomo Mitsui Financial Group Inc 123,100 4,173,397 4,420,582 0.31Sumitomo Mitsui Trust Holdings Inc 46,000 160,314 159,602 0.01Sumitomo Warehouse Co Ltd/The 4,000 18,949 20,448 0Suruga Bank Ltd 23,000 233,981 281,166 0.02Suzuki Motor Corp 29,300 649,071 759,737 0.05Sysmex Corp 7,500 257,894 343,492 0.02Tachi-S Co Ltd 400 4,949 6,800 0Taikisha Ltd 800 13,253 15,072 0113
<strong>STANLIB</strong> <strong>Funds</strong> <strong>Limited</strong>Portfolio Statement (continued)<strong>STANLIB</strong> Multi-Manager Global Equity Fund as at 31 December <strong>2012</strong> (continued)Common Stock continuedNominal holding Cost Market Value % of Net AssetsUSDUSDJapan (continued)Taiyo Nippon Sanso Corp 14,000 63,795 79,986 0.01Taiyo Yuden Co Ltd 2,000 27,810 17,441 0Takasago Thermal Engineering Co Ltd 1,500 13,141 11,762 0Takeda Pharmaceutical Co Ltd 9,500 442,887 423,553 0.03Tamron Co Ltd 400 7,330 11,223 0Terumo Corp 112,500 5,738,985 4,430,260 0.31Toagosei Co Ltd 5,000 22,985 19,430 0Tobu Railway Co Ltd 27,000 156,139 142,079 0.01TOC Co Ltd 3,700 13,708 22,552 0Toho Holdings Co Ltd 900 13,547 15,707 0Toho Zinc Co Ltd 4,000 15,425 17,302 0Tokio Marine Holdings Inc 9,400 258,132 258,524 0.02Tokuyama Corp 5,000 23,535 10,872 0Tokyo Dome Corp 6,000 15,102 21,581 0Tokyo Electric Power Co Inc 60,200 396,915 142,728 0.01Tokyo Electron Ltd 6,300 340,058 286,347 0.02Tokyo Gas Co Ltd 71,000 287,318 323,533 0.02Tokyo Ohka Kogyo Co Ltd 9,400 189,589 184,597 0.01Tokyo Seimitsu Co Ltd 1,000 13,072 16,249 0Tokyo Tatemono Co Ltd 6,000 20,376 30,394 0Tokyo Tomin Bank Ltd/The 1,200 13,211 10,839 0Tokyu Corp 37,000 163,169 207,111 0.01TOMONY Holdings Inc 3,700 13,708 16,218 0Tomy Co Ltd 1,600 12,452 8,808 0Toppan Printing Co Ltd 16,000 137,574 98,259 0.01Topy Industries Ltd 6,000 13,910 14,156 0Toray Industries Inc 30,000 224,220 182,502 0.01Toshiba Corp 51,000 242,771 198,186 0.01Toshiba Plant Systems & Services Corp 1,000 11,965 14,399 0Toyo Corp/Chuo-ku 1,600 17,615 17,876 0Toyo Engineering Corp 5,000 16,367 23,420 0Toyo Ink SC Holdings Co Ltd 4,000 15,855 17,024 0Toyo Seikan Kaisha Ltd 16,700 224,236 222,305 0.01Toyo Suisan Kaisha Ltd 7,000 167,139 186,040 0.01Toyo Tanso Co Ltd 300 15,693 6,110 0Toyo Tire & Rubber Co Ltd 6,000 13,281 17,764 0Toyobo Co Ltd 18,000 29,287 25,605 0Toyota Industries Corp 5,300 150,703 167,156 0.01Toyota Motor Corp 67,300 2,617,836 3,113,398 0.22Transcosmos Inc 1,500 13,648 16,047 0Trend Micro Inc/Japan 3,300 107,133 98,849 0.01TS Tech Co Ltd 900 13,788 16,061 0114
<strong>STANLIB</strong> <strong>Funds</strong> <strong>Limited</strong>Portfolio Statement (continued)<strong>STANLIB</strong> Multi-Manager Global Equity Fund as at 31 December <strong>2012</strong> (continued)Common Stock continuedNominal holding Cost Market Value % of Net AssetsUSDUSDJapan (continued)Tsubakimoto Chain Co 3,000 12,617 16,758 0Tsutsumi Jewelry Co Ltd 3,500 94,607 89,256 0.01Ulvac Inc 1,300 27,866 11,983 0Unicharm Corp 3,000 119,430 155,786 0.01Unipres Corp 800 13,635 17,459 0United Urban Investment Corp 33 37,946 37,822 0Unitika Ltd 21,000 13,626 11,416 0UNY Co Ltd 2,700 23,159 19,922 0Wacoal Holdings Corp 2,000 24,013 20,702 0Wacom Co Ltd/Japan 7 8,503 18,296 0West Japan Railway Co 5,500 210,274 216,273 0.01Xebio Co Ltd 700 13,693 14,200 0Yahoo Japan Corp 387 138,049 124,562 0.01Yamada Denki Co Ltd 4,610 255,165 177,010 0.01Yamato Holdings Co Ltd 30,800 445,220 465,570 0.03Yamazen Corp 32,700 272,168 243,932 0.02Yodogawa Steel Works Ltd 6,000 25,192 20,332 0Yokohama Rubber Co Ltd/The 4,000 21,724 28,636 0Yoshinoya Holdings Co Ltd 12 13,966 14,670 0Zensho Holdings Co Ltd 1,700 21,197 19,602 0Zeon Corp 1,000 8,687 8,593 0Total Japan 6.38% (2011: 5.08%) 94,766,992 6.38JerseyAtrium European Real Estate Ltd 4,009 20,188 23,340 0Beazley Plc 7,035 12,950 20,081 0Centamin Plc 15,161 32,960 9,601 0Experian Plc 11,302 116,913 179,948 0.01Glencore International Plc 65,250 491,750 372,284 0.03Henderson Group Plc 18,500 39,175 39,605 0Heritage Oil Plc 2,743 13,231 8,423 0Informa Plc 78,108 500,676 570,071 0.04Petrofac Ltd 9,593 214,291 253,082 0.02Regus Plc 118,908 161,783 210,871 0.01Shire Plc 9,030 235,386 276,538 0.02UBM Plc 1,528 16,303 17,809 0West China Cement Ltd 84,000 25,891 16,582 0Wolseley Plc 9,303 339,253 438,085 0.03Total Jersey 0.16% (2011: 0.00%) 2,436,320 0.16Korea, Republic ofNeo Holdings Krw Npv 263 – – –Total Korea, Republic of –% (2011: 0.00%) – –115
<strong>STANLIB</strong> <strong>Funds</strong> <strong>Limited</strong>Portfolio Statement (continued)<strong>STANLIB</strong> Multi-Manager Global Equity Fund as at 31 December <strong>2012</strong> (continued)Common Stock continuedNominal holding Cost Market Value % of Net AssetsUSDUSDKorea, Republic of (South Korea)Amorepacific Corp 47 47,829 53,297 0BS Financial Group Inc 3,520 40,753 43,237 0Celltrion Inc 1,422 29,643 34,668 0Cheil Industries Inc 566 47,449 49,802 0CJ CGV Co Ltd 690 13,180 20,689 0CJ CheilJedang Corp 144 35,620 47,817 0CJ E&M Corp 650 29,883 16,059 0CJ O Shopping Co Ltd 75 11,825 19,398 0Coway Co Ltd 950 30,196 38,645 0Daelim Industrial Co Ltd 481 39,221 39,043 0Daewoo International Corp 300 7,639 11,111 0Daewoo Securities Co Ltd 1,840 17,765 20,538 0Daewoo Shipbuilding & Marine Engineering Co Ltd 1,380 30,068 34,997 0Daum Communications Corp 1,601 160,279 135,488 0.02DGB Financial Group Inc 2,620 31,547 35,363 0Dong-A Pharmaceutical Co Ltd 192 16,329 19,548 0Dongbu Insurance Co Ltd 780 31,990 32,895 0Dongbu Steel Co Ltd 2,690 19,254 9,925 0DONGKUK STRUCTURES & CONSTRUCTION Co Ltd 10,494 26,568 26,809 0Doosan Corp 263 30,674 31,690 0Doosan Heavy Industries & Construction Co Ltd 838 41,744 35,341 0Doosan Infracore Co Ltd 2,430 37,788 38,587 0E-Mart Co Ltd 236 65,895 52,465 0GS Engineering & Construction Corp 661 64,402 35,378 0GS Holdings 686 34,817 46,136 0Hana Financial Group Inc 5,896 198,686 190,829 0.02Hana Tour Service Inc 481 17,486 27,137 0Handsome Co Ltd 380 5,454 10,436 0Hanjin Shipping Co Ltd 2,150 33,008 23,999 0Hanjin Transportation Co Ltd 1,130 27,160 20,793 0Hankook Tire Co Ltd 4,175 125,477 183,289 0.02Hankook Tire Worldwide Co Ltd 709 46,730 13,113 0Hansol Paper Co 2,790 26,504 23,767 0Hanwha Chemical Corp 1,180 27,726 20,226 0Hanwha Corp 1,090 33,342 34,770 0Hanwha Investment & Securities Co Ltd 3,810 22,185 15,000 0Hotel Shilla Co Ltd 940 28,104 38,546 0Hyosung Corp 612 31,689 42,074 0Hyundai Department Store Co Ltd 252 36,389 37,309 0Hyundai Development Co 820 13,242 16,583 0Hyundai Engineering & Construction Co Ltd 1,131 72,575 73,845 0Hyundai Glovis Co Ltd 209 31,608 43,242 0116
<strong>STANLIB</strong> <strong>Funds</strong> <strong>Limited</strong>Portfolio Statement (continued)<strong>STANLIB</strong> Multi-Manager Global Equity Fund as at 31 December <strong>2012</strong> (continued)Common Stock continuedNominal holding Cost Market Value % of Net AssetsUSDUSDKorea, Republic of (South Korea)Hyundai Greenfood Co Ltd 1,480 12,688 23,501 0Hyundai Heavy Industries Co Ltd 577 220,171 130,429 0.01Hyundai Hysco Co Ltd 390 13,983 16,557 0Hyundai Merchant Marine Co Ltd 230 5,365 5,070 0Hyundai Mipo Dockyard 99 8,882 11,744 0Hyundai Mobis 1,643 492,062 441,223 0.04Hyundai Motor Co 2,873 596,997 586,368 0.05Hyundai Securities Co Ltd 3,550 30,771 29,877 0Hyundai Steel Co 966 90,439 78,953 0.01Hyundai Wia Corp 105 12,381 16,918 0Industrial Bank of Korea 3,130 38,244 34,499 0Jusung Engineering Co Ltd 2,155 28,344 9,149 0Kangwon Land Inc 1,640 37,975 44,808 0KB Financial Group Inc 16,228 748,671 574,496 0.05KCC Corp 154 30,790 42,723 0Kia Motors Corp 3,646 230,418 192,419 0.02KIWOOM Securities Co Ltd 360 13,907 19,806 0Kolon Industries Inc 318 17,546 18,862 0Korea Electric Power Corp 3,190 67,541 90,583 0.01Korea Exchange Bank 4,540 30,257 32,229 0Korea Gas Corp 220 8,363 15,433 0Korea Investment Holdings Co Ltd 1,030 30,142 40,745 0Korea Zinc Co Ltd 105 43,310 39,673 0Korean Air Lines Co Ltd 780 30,557 33,005 0Korean Reinsurance Co 2,611 29,790 27,925 0KT&G Corp 1,607 104,701 121,136 0.01Kumho Petro chemical Co Ltd 97 15,830 11,779 0LG Chem Ltd 655 272,347 201,901 0.02LG Corp 1,177 67,302 71,682 0LG Display Co Ltd 2,940 55,657 85,269 0.01LG Electronics Inc 1,693 101,961 116,391 0.01LG Fashion Corp 570 14,619 16,665 0LG Household & Health Care Ltd 2,307 1,158,208 1,415,780 0.11LG International Corp 820 28,849 37,033 0LG Life Sciences Ltd 640 25,008 26,931 0LG Uplus Corp 5,520 31,317 40,166 0LIG Insurance Co Ltd 1,520 33,630 36,631 0Lotte Chemical Corp 251 87,983 57,558 0Lotte Chilsung Beverage Co Ltd 11 13,355 15,566 0Lotte Shopping Co Ltd 178 59,350 62,433 0LS Corp 483 31,323 42,499 0Mando Corp 235 37,950 28,097 0117
<strong>STANLIB</strong> <strong>Funds</strong> <strong>Limited</strong>Portfolio Statement (continued)<strong>STANLIB</strong> Multi-Manager Global Equity Fund as at 31 December <strong>2012</strong> (continued)Common Stock continuedNominal holding Cost Market Value % of Net AssetsUSDUSDKorea, Republic of (South Korea)MegaStudy Co Ltd 103 11,356 7,562 0Meritz Finance Group Inc 6,764 15,571 24,925 0NCSoft Corp 241 74,497 33,767 0Neowiz Games Corp 419 13,578 9,784 0Nexen Tire Corp 2,000 35,788 29,890 0NHN Corp 569 112,271 120,648 0.01OCI Co Ltd 290 83,524 44,831 0OCI Materials Co Ltd 144 14,606 5,145 0Poongsan Corp 770 21,074 24,166 0POSCO 916 384,763 298,182 0.03POSCO Chemtech Co Ltd 77 9,336 9,530 0S&T Dynamics Co Ltd 1,170 16,052 12,951 0Samsung C&T Corp 1,644 110,820 96,130 0.01Samsung Card Co Ltd 820 31,143 27,957 0Samsung Electro-Mechanics Co Ltd 770 48,286 71,349 0Samsung Electronics Co Ltd 22,190 6,771,636 11,242,035 0.78Samsung Engineering Co Ltd 467 102,059 71,975 0Samsung Fire & Marine Insurance Co Ltd 439 94,518 89,188 0.01Samsung Heavy Industries Co Ltd 2,090 66,783 75,161 0.01Samsung Life Insurance Co Ltd 811 63,372 71,436 0Samsung SDI Co Ltd 567 73,471 79,973 0.01Samsung Securities Co Ltd 1,122 52,380 55,965 0Samsung Techwin Co Ltd 433 22,457 24,146 0Samyang Corp 111 5,272 5,096 0Samyang Holdings Corp 149 7,077 9,882 0Seah Besteel Corp 446 8,405 11,936 0SFA Engineering Corp 168 4,316 7,399 0Shinhan Financial Group Co Ltd 6,410 289,325 232,013 0.03Shinsegae Co Ltd 135 31,375 27,553 0SK Broadband Co Ltd 6,296 23,835 27,405 0SK C&C Co Ltd 309 40,395 29,585 0SK Chemicals Co Ltd 325 18,364 18,093 0SK Holdings Co Ltd 502 76,129 83,700 0.01SK Hynix Inc 7,020 158,193 168,849 0.02SK Innovation Co Ltd 809 141,192 131,486 0.02SK Networks Co Ltd 3,170 30,607 24,991 0SK Securities Co Ltd 15,730 23,359 17,338 0SK Telecom Co Ltd 113,418 1,785,072 1,823,009 0.13S-Oil Corp 651 67,904 63,241 0STX Engine Co Ltd 1,490 27,609 12,916 0Taekwang Industrial Co Ltd 19 19,802 16,754 0Taihan Electric Wire Co Ltd 697 16,919 2,435 0118
<strong>STANLIB</strong> <strong>Funds</strong> <strong>Limited</strong>Portfolio Statement (continued)<strong>STANLIB</strong> Multi-Manager Global Equity Fund as at 31 December <strong>2012</strong> (continued)Common Stock continuedNominal holding Cost Market Value % of Net AssetsUSDUSDKorea, Republic of (South Korea)TONGYANG Securities Inc 4,650 28,180 17,743 0Woongjin Chemical Co Ltd 18,230 16,115 12,329 0Woongjin Thinkbig Co Ltd 2,020 32,896 12,340 0Woori Finance Holdings Co Ltd 4,010 42,182 44,011 0Total Korea, Republic of (South Korea) 1.48% (2011: 1.19%) 22,015,196 1.48LuxembourgAltisource Portfolio Solutions SA 300 7,917 25,983 0ArcelorMittal 20,639 428,026 351,010 0.02Colt Group SA 6,405 12,576 10,177 0Eurofins Scientific 1,176 59,793 188,763 0.01GAGFAH SA 1,622 12,303 19,092 0Kernel Holding SA 1,539 31,223 33,193 0Millicom International Cellular SA 55,588 4,950,424 4,806,472 0.32Oriflame Cosmetics SA 3,469 129,861 110,169 0.01Samsonite International SA 126,900 231,734 261,630 0.02SES SA 262,210 6,329,314 7,482,529 0.5Tenaris SA 190,700 6,510,424 7,992,236 0.55Total Luxembourg 1.43% (2011: 2.50%) 21,281,254 1.43MalaysiaAMMB Holdings Bhd 438,612 575,124 958,104 0.06Axiata Group Bhd 1,168,900 2,006,156 2,518,979 0.18Berjaya Sports Toto Bhd 20,800 27,945 30,064 0British American Tobacco Malaysia Bhd 2,400 33,589 47,875 0Carlsberg Brewery Malaysia Bhd 52,600 99,564 215,355 0.01CIMB Group Holdings Bhd 651,092 557,274 1,624,540 0.12Dialog Group BHD 38,500 12,029 30,215 0DiGi.Com Bhd 59,600 47,349 102,321 0.01Gamuda Bhd 33,600 35,455 39,554 0Genting Bhd 49,300 148,558 148,156 0.01Genting Malaysia Bhd 983,800 637,912 1,135,699 0.09Hartalega Holdings Bhd 16,000 18,646 24,800 0IHH Healthcare Bhd 37,000 42,448 40,774 0IJM Corp BHD 90,700 160,265 146,816 0.01IOI Corp Bhd 52,100 84,987 85,017 0.01KNM Group Bhd 56,225 21,554 8,366 0Kuala Lumpur Kepong Bhd 8,200 43,876 63,391 0Malayan Banking Bhd 57,100 149,185 169,547 0.01Malaysian Airline System Bhd 226,334 168,591 52,170 0Malaysian Resources Corp Bhd 32,000 18,375 16,221 0Maxis Bhd 41,600 82,621 90,330 0.01MISC Bhd 15,000 41,622 20,454 0Multi-Purpose Holdings BHD 164,240 49,116 187,447 0.01119
<strong>STANLIB</strong> <strong>Funds</strong> <strong>Limited</strong>Portfolio Statement (continued)<strong>STANLIB</strong> Multi-Manager Global Equity Fund as at 31 December <strong>2012</strong> (continued)Common Stock continuedNominal holding Cost Market Value % of Net AssetsUSDUSDMalaysia (continued)Petronas Chemicals Group Bhd 40,800 82,367 84,056 0.01Petronas Gas Bhd 10,600 35,541 67,663 0PPB Group Bhd 8,200 45,489 31,106 0Public Bank Bhd 16,400 67,561 87,202 0.01Sime Darby Bhd 149,005 306,590 462,899 0.03Supermax Corp Bhd 12,500 7,145 7,889 0TAN Chong Motor Holdings BHD 8,900 13,981 13,475 0Telekom Malaysia Bhd 19,100 34,623 37,476 0Tenaga Nasional Bhd 43,400 85,802 98,071 0.01Top Glove Corp Bhd 5,900 8,768 10,862 0UMW Holdings Bhd 15,300 30,493 59,739 0WCT Bhd 27,025 18,214 20,680 0YTL Corp Bhd 67,200 27,980 40,656 0YTL Power International Bhd 37,800 27,171 19,282 0Total Malaysia 0.59% (2011: 0.51%) 8,797,251 0.59MexicoAlfa SAB de CV 52,000 50,425 109,840 0.01America Movil SAB de CV 570,382 998,848 1,009,897 0.07Axtel SAB de CV 33,700 16,992 7,552 0Bolsa Mexicana de Valores SAB de CV 135,500 241,985 339,644 0.02Cemex SAB de CV 189,377 447,832 690,387 0.05Coca-Cola Femsa SAB de CV 5,900 79,363 87,124 0.01Corp GEO SAB de CV 21,300 28,748 24,800 0Desarrolladora Homex SAB de CV 10,600 26,980 21,737 0Empresas ICA SAB de CV 52,200 96,029 129,675 0.01Fomento Economico Mexicano SAB de CV 479,200 8,082,921 10,351,767 0.71Genomma Lab Internacional SAB de CV 54,585 111,973 111,599 0.01Gruma SAB de CV 8,600 12,525 25,901 0Grupo Aeroportuario del Centro Norte Sab de CV 16,500 32,788 44,522 0Grupo Aeroportuario del Pacifico SAB de CV 4,000 13,239 22,597 0Grupo Bimbo SAB de CV 24,200 48,466 62,262 0Grupo Carso SAB de CV 27,200 60,087 130,848 0.01Grupo Financiero Banorte SAB de CV 39,600 155,844 254,109 0.02Grupo Financiero Inbursa SAB de CV 26,200 51,790 79,048 0.01Grupo Financiero Santander Mexico SAB de CV 21,000 58,031 67,402 0Grupo Mexico SAB de CV 58,593 168,093 210,396 0.01Grupo Modelo SAB de CV 9,300 52,736 83,031 0.01Grupo Simec SAB de CV 5,500 13,095 25,590 0Grupo Televisa SAB 37,800 150,918 198,722 0.01Industrias Penoles SAB de CV 2,330 64,479 115,908 0.01Kimberly-Clark de Mexico SAB de CV 21,600 42,755 55,056 0Mexichem SAB de CV 12,267 37,960 67,834 0120
<strong>STANLIB</strong> <strong>Funds</strong> <strong>Limited</strong>Portfolio Statement (continued)<strong>STANLIB</strong> Multi-Manager Global Equity Fund as at 31 December <strong>2012</strong> (continued)Common Stock continuedNominal holding Cost Market Value % of Net AssetsUSDUSDMexico (continued)Minera Frisco SAB de CV 12,000 28,620 50,011 0TV Azteca SAB de CV 50,300 29,547 32,655 0Wal-Mart de Mexico SAB de CV 73,900 181,202 239,975 0.02Total Mexico 0.99% (2011: 0.57%) 14,649,889 0.99NetherlandsAalberts Industries NV 1,095 17,370 22,398 0Accell Group 640 14,428 11,231 0Aegon NV 24,458 154,229 154,614 0.01AerCap Holdings NV 12,700 145,568 174,371 0.01Akzo Nobel NV 4,422 274,915 289,133 0.02Arcadis NV 772 15,466 18,040 0ASM International NV 2,712 94,765 97,092 0.01ASML Holding NV 27,985 1,264,737 1,770,458 0.13Beter Bed Holding NV 587 13,064 10,188 0BinckBank NV 1,016 14,520 8,306 0Brunel International NV 420 13,231 20,183 0CSM 749 20,551 16,027 0Eurocommercial Properties NV 609 23,829 24,143 0European Aeronautic Defence and Space Co NV 6,849 202,705 265,471 0.02Fugro NV 5,753 367,348 336,380 0.02Gemalto NV 5,821 403,800 520,625 0.04Heineken Holding NV 2,431 105,806 132,494 0.01Heineken NV 10,171 384,297 674,620 0.05ING Groep NV 44,499 431,281 413,716 0.03Koninklijke Ahold NV 14,069 189,393 187,987 0.01Koninklijke BAM Groep NV 2,893 14,408 12,262 0Koninklijke Boskalis Westminster NV 7,033 99,900 315,254 0.02Koninklijke DSM NV 4,500 234,535 271,036 0.02Koninklijke KPN NV 43,331 455,333 212,170 0.01Koninklijke Philips Electronics NV 70,565 1,518,960 1,847,611 0.13Koninklijke Ten Cate NV 507 13,504 13,205 0LyondellBasell Industries NV 7,300 261,518 416,903 0.03Mediq NV 847 14,025 14,321 0Nielsen Holdings NV 21,600 621,961 660,312 0.04Nieuwe Steen Investments NV 791 13,891 6,331 0Nutreco NV 392 24,992 33,127 0PostNL NV 1,624 17,085 6,243 0Qiagen N.V. 6,637 123,110 119,876 0.01Randstad Holding NV 6,240 263,498 227,510 0.02Royal Dutch Shell Plc 'A' 12,638 365,001 432,788 0.03Royal Imtech NV 47 1,386 1,078 0SNS REAAL NV 2,429 13,779 3,286 0121
<strong>STANLIB</strong> <strong>Funds</strong> <strong>Limited</strong>Portfolio Statement (continued)<strong>STANLIB</strong> Multi-Manager Global Equity Fund as at 31 December <strong>2012</strong> (continued)Common Stock continuedNominal holding Cost Market Value % of Net AssetsUSDUSDNetherlands (continued)TNT Express NV 1,377 18,847 15,304 0Unilever NV 24,733 780,809 937,957 0.06Unit4 NV 597 13,863 17,859 0USG People NV 978 15,522 7,761 0Vastned Retail NV 271 15,045 11,701 0VistaPrint NV 700 21,334 22,995 0Wereldhave NV 284 23,778 17,972 0Wolters Kluwer NV 9,302 193,602 189,718 0.01Total Netherlands 0.74% (2011: 1.21%) 10,962,057 0.74New ZealandChorus Ltd 11,554 36,517 27,834 0Telecom Corp of New Zealand Ltd 655,868 1,447,827 1,222,865 0.08Total New Zealand 0.08% (2011: 0.00%) 1,250,699 0.08NorwayAker ASA 705 13,989 26,856 0Aker Solutions ASA 9,400 155,680 190,527 0.01Atea ASA 2,370 18,923 25,232 0Austevoll Seafood ASA 2,298 13,594 11,686 0Cermaq ASA 1,482 13,056 22,103 0DNB ASA 28,063 251,937 354,492 0.03DNO International ASA 10,470 15,039 17,496 0Fred Olsen Energy ASA 443 13,008 19,216 0Frontline Ltd 3,519 43,128 11,698 0Leroey Seafood Group ASA 567 8,823 13,143 0Marine Harvest ASA 31,468 25,872 28,922 0Norsk Hydro ASA 24,366 139,380 121,408 0.01Orkla ASA 14,506 124,443 126,209 0.01Petroleum Geo-Services ASA 2,781 29,452 47,573 0Schibsted ASA 2,559 80,944 108,242 0.01Statoil ASA 244,034 5,722,763 6,095,140 0.42Storebrand ASA 11,817 84,050 56,906 0Telenor ASA 11,226 185,056 225,923 0.02TGS Nopec Geophysical Co ASA 1,453 26,289 47,387 0Tomra Systems ASA 3,487 20,274 31,078 0Yara International ASA 2,752 115,146 135,394 0.01Total Norway 0.52% (2011: 0.61%) 7,716,631 0.52PanamaCarnival Corp 17,267 567,447 634,735 0.04McDermott International Inc 2,800 49,213 30,828 0Total Panama 0.04% (2011: 0.00%) 665,563 0.04Papua New GuineaOil Search Ltd 118,881 826,185 859,010 0.06122
<strong>STANLIB</strong> <strong>Funds</strong> <strong>Limited</strong>Portfolio Statement (continued)<strong>STANLIB</strong> Multi-Manager Global Equity Fund as at 31 December <strong>2012</strong> (continued)Common Stock continuedNominal holding Cost Market Value % of Net AssetsUSDUSDPapua New Guinea (continued)Total Papua New Guinea 0.06% (2011: 0.00%) 859,010 0.06PeruCia de Minas Buenaventura SA 2,800 131,841 100,660 0.01Total Peru 0.01% (2011: 0.01%) 100,660 0.01PhilippinesAboitiz Equity Ventures Inc 41,260 39,026 53,155 0ABS-CBN Holdings Corp 1,147,650 602,553 948,877 0.07Ayala Corp 226,085 772,901 2,843,787 0.2Ayala Land Inc 70,700 24,270 45,368 0Bank of the Philippine Islands 46,560 54,047 106,585 0.01BDO Unibank Inc 131,476 86,257 232,936 0.02Cebu Air Inc 72,000 114,574 108,360 0.01DMCI Holdings Inc 497,890 130,947 654,178 0.04Filinvest Land Inc 686,000 19,622 24,902 0First Philippine Holdings Corp 4,600 5,714 10,021 0Globe Telecom Inc 33,780 538,658 898,332 0.06Jollibee Foods Corp 244,850 200,021 608,207 0.04Lopez Holdings Corp 2,959,787 318,434 452,551 0.03Philippine Long Distance Telephone Co 725 43,479 44,670 0Robinsons Land Corp 63,500 18,516 32,087 0SM Investments Corp 15,630 192,113 335,153 0.02SM Prime Holdings Inc 185,750 40,471 74,634 0.01Universal Robina Corp 30,000 35,767 60,639 0Total Philippines 0.51% (2011: 0.45%) 7,534,442 0.51PolandAsseco Poland SA 2,272 32,336 33,043 0Bank Pekao SA 3,505 165,078 189,584 0.01BRE Bank SA 229 19,052 24,107 0Eurocash SA 20,200 239,839 285,229 0.02KGHM Polska Miedz SA 1,776 69,891 108,917 0.01Lubelski Wegiel Bogdanka SA 780 25,343 34,251 0PGE SA 13,588 96,450 79,950 0.01Polski Koncern Naftowy Orlen S.A. 6,422 84,462 102,715 0.01Polskie Gornictwo Naftowe i Gazownictwo SA 26,633 31,782 44,749 0Powszechna Kasa Oszczednosci Bank Polski SA 10,203 129,405 121,386 0.01Powszechny Zaklad Ubezpieczen SA 939 109,767 132,588 0.01Tauron Polska Energia SA 26,452 49,513 40,342 0Telekomunikacja Polska SA 10,605 58,547 41,908 0Warsaw Stock Exchange 8,700 109,785 108,649 0.01Total Poland 0.09% (2011: 0.06%) 1,347,418 0.09PortugalAltri SGPS SA 5,100 12,952 10,677 0123
<strong>STANLIB</strong> <strong>Funds</strong> <strong>Limited</strong>Portfolio Statement (continued)<strong>STANLIB</strong> Multi-Manager Global Equity Fund as at 31 December <strong>2012</strong> (continued)Common Stock continuedPortugal (continued)Nominal holding Cost Market Value % of Net AssetsEDP - Energias de Portugal SA 53,756 181,321 161,655 0.01Mota-Engil SGPS SA 8,406 23,063 17,289 0Portucel SA 4,726 13,675 14,206 0Portugal Telecom SGPS SA 81,094 464,755 398,999 0.03Semapa-Sociedade de Investimento e Gestao 1,350 13,763 10,104 0Sonae 12,630 13,703 11,390 0Zon Multimedia Servicos de Telecomunicacoes e MultimediaSGPS SAUSDUSD6,000 26,441 23,351 0Total Portugal 0.04% (2011: 0.02%) 647,671 0.04Puerto RicoOriental Financial Group Inc 1,200 13,806 16,008 0Total Puerto Rico 0.00% (2011: 0.00%) 16,008 0RussiaAk Transneft OAO 26 42,481 57,880 0Bank St. Petersburg 28,400 73,331 46,306 0Dixy Group 9,100 112,013 121,629 0.01Federal Grid Co Unified 4,441,842 56,034 29,316 0Federal Hydrogenerating Co 1,831,688 88,531 43,961 0Gazprom OAO 38,745 514,501 366,528 0.03Inter Rao Ues 14,631,609 21,216 11,896 0LSR Group 6,204 25,153 25,560 0LUKOIL OAO 7,031 404,589 460,717 0.04Magnit OJSC 3,678 85,000 147,488 0.01Mechel 3,500 65,291 24,255 0MMC Norilsk Nickel Ojsc 756 136,887 138,767 0.01Mobile Telesystems OJSC 6,800 113,063 126,752 0.01NovaTek OAO 1,390 208,347 165,132 0.01Novolipetsk Steel OJSC 1,262 31,608 25,480 0Rosneft Oil Company 21,561 153,328 190,718 0.01Rostelecom 15,397 70,389 60,630 0Sberbank of Russia 52,618 478,245 498,205 0.04Sberbank Of Russian Federation 125,970 349,223 383,793 0.04Severstal Rub 0.0100 3,322 41,359 40,169 0Sistema JSFC 5,093 102,895 102,726 0.01Surgutneftegas 84,551 78,839 74,236 0Tatneft 24,293 112,239 173,493 0.01Uralkali 21,591 129,719 166,043 0.01Vtb Bank Ojsc 30,270,206 77,083 53,154 0Total Russia 0.24% (2011: 0.24%) 3,534,834 0.24SingaporeAscendas Real Estate Investment Trust 1,791,000 2,950,592 3,474,898 0.24Cache Logistics Trust 27,000 21,274 27,300 0124
<strong>STANLIB</strong> <strong>Funds</strong> <strong>Limited</strong>Portfolio Statement (continued)<strong>STANLIB</strong> Multi-Manager Global Equity Fund as at 31 December <strong>2012</strong> (continued)Common Stock continuedNominal holding Cost Market Value % of Net AssetsUSDUSDSingapore (continued)CDL Hospitality Trusts 23,000 32,416 35,399 0City Developments Ltd 296,000 2,055,777 3,113,861 0.22CSE Global Ltd 24,000 16,622 15,326 0DBS Group Holdings Ltd 25,000 266,821 303,315 0.02Ezion Holdings Ltd 22,000 11,117 30,349 0Ezra Holdings Ltd 132,000 120,250 123,196 0.01First Resources Ltd 13,000 12,240 21,232 0Flextronics International Ltd 16,765 99,240 104,111 0.01Global Yellow Pages Ltd 241,500 73,562 16,615 0Great Eastern Holdings Ltd 70,000 541,637 897,421 0.06Indofood Agri Resources Ltd 13,000 16,974 14,154 0Keppel Corp Ltd 24,000 206,129 215,930 0.01Keppel REIT 33,000 28,761 34,851 0Lippo Malls Indonesia Retail Trust 82,000 27,591 32,890 0Mapletree Logistics Trust 42,000 35,610 39,026 0Midas Holdings Ltd 57,000 25,202 19,597 0Oversea-Chinese Banking Corp Ltd 37,000 251,473 294,727 0.02Raffles Education Corp Ltd 25,000 9,520 6,858 0Rotary Engineering Ltd 33,000 17,813 12,022 0SATS Ltd 12,000 25,623 28,294 0Singapore Airlines Ltd 289,000 2,520,566 2,541,033 0.17Singapore Exchange Ltd 23,000 134,850 131,806 0.01Singapore Press Holdings Ltd 66,000 197,273 217,206 0.01Singapore Telecommunications Ltd 1,297,000 3,377,791 3,503,974 0.25Sound Global Ltd 37,000 16,086 17,416 0STATS ChipPAC Ltd 781,000 464,545 217,352 0.01Suntec Real Estate Investment Trust 41,000 43,734 56,223 0United Industrial Corp Ltd 34,000 18,121 79,329 0.01United Overseas Bank Ltd 17,000 242,734 275,703 0.02Venture Corp Ltd 4,000 26,910 26,230 0Wilmar International Ltd 38,000 167,012 103,596 0.01Ying Li International Real Estate Ltd 83,000 20,656 25,141 0Yoma Strategic Holdings Ltd 41,000 13,387 23,833 0Total Singapore 1.08% (2011: 0.40%) 16,080,214 1.08South AfricaABSA Group Ltd 3,885 69,017 74,894 0.01Adcock Ingram Holdings Ltd 3,348 28,894 21,309 0Aeci Ltd 2,100 27,539 19,677 0African Bank Investments Ltd 13,445 60,016 50,852 0African Rainbow Minerals Ltd 2,591 59,325 57,675 0Anglo American Platinum Ltd 3,434 222,347 180,649 0.01Anglo American Plc 11,206 275,454 342,412 0.02125
<strong>STANLIB</strong> <strong>Funds</strong> <strong>Limited</strong>Portfolio Statement (continued)<strong>STANLIB</strong> Multi-Manager Global Equity Fund as at 31 December <strong>2012</strong> (continued)Common Stock continuedNominal holding Cost Market Value % of Net AssetsUSDUSDSouth Africa (continued)AngloGold Ashanti Ltd 7,496 314,983 231,045 0.02ArcelorMittal South Africa Ltd 3,165 37,590 13,429 0Aspen Pharmacare Holdings Ltd 5,211 55,693 103,797 0.01Astral Foods Ltd 1,379 23,118 16,817 0Aveng Ltd 5,576 28,514 19,933 0Barloworld Ltd 3,766 22,428 38,710 0Bidvest Group Ltd 5,269 96,796 133,824 0.01Blue Label Telecoms Ltd 74,600 65,682 70,960 0Capital Property Fund 28,495 31,856 35,499 0City Lodge Hotels Ltd 7,919 51,135 96,510 0.01Clicks Group Ltd 75,792 414,400 579,847 0.05DataTec Ltd 5,249 28,010 30,346 0Discovery Ltd 6,024 10,078 44,155 0Emira Property Fund 19,766 34,637 33,966 0Exxaro Resources Ltd 2,877 61,716 57,307 0FirstRand Ltd 174,258 284,466 636,704 0.05Foschini Group Ltd/The 15,035 198,135 249,420 0.02Gold Fields Ltd 17,339 243,512 212,026 0.01Growthpoint Properties Ltd 32,464 75,988 93,746 0.01Harmony Gold Mining Co Ltd 4,281 45,598 36,985 0Hosken Consolidated Investments Ltd 126,727 1,044,700 1,438,237 0.11Hyprop Investments Ltd 3,407 25,501 29,153 0Impala Platinum Holdings Ltd 8,044 207,242 158,995 0.01Imperial Holdings Ltd 3,487 46,679 81,536 0.01JD Group Ltd/South Africa 27,374 194,152 145,186 0.01JSE Ltd 26,883 268,865 247,557 0.02Kumba Iron Ore Ltd 961 51,268 63,543 0Life Healthcare Group Holdings Ltd 12,000 30,971 47,664 0Massmart Holdings Ltd 1,914 34,646 43,038 0MMI Holdings Ltd/South Africa 23,139 27,838 60,462 0Mondi Ltd 4,048 28,698 43,971 0Mondi Plc 3,776 6,160 40,589 0Mpact Ltd 12,016 21,685 28,013 0MTN Group Ltd 355,595 5,731,698 7,443,491 0.51Murray & Roberts Holdings Ltd 19,555 56,272 56,307 0Nampak Ltd 8,071 25,243 30,156 0Naspers Ltd 5,685 249,029 363,972 0.02Nedbank Group Ltd 25,425 277,862 563,375 0.05Netcare Ltd 22,938 42,711 52,909 0Niveus Investments Ltd 50,012 34,602 76,038 0.01Old Mutual Plc 61,397 119,923 176,713 0.01Omnia Holdings Ltd 1,566 13,066 25,250 0126
<strong>STANLIB</strong> <strong>Funds</strong> <strong>Limited</strong>Portfolio Statement (continued)<strong>STANLIB</strong> Multi-Manager Global Equity Fund as at 31 December <strong>2012</strong> (continued)Common Stock continuedNominal holding Cost Market Value % of Net AssetsUSDUSDSouth Africa (continued)PPC Ltd 7,269 30,939 29,301 0Remgro Ltd 16,704 223,893 313,352 0.02Reunert Ltd 2,841 22,949 25,114 0RMB Holdings Ltd 153,993 273,247 738,704 0.06RMI Holdings 159,246 159,124 386,267 0.03Sanlam Ltd 26,412 89,958 139,368 0.01Santam Ltd 1,173 22,131 26,303 0Sappi Ltd 8,175 39,292 29,600 0Sasol Ltd 7,837 330,267 335,116 0.02Shoprite Holdings Ltd 7,007 85,237 168,890 0.01Spar Group Ltd/The 2,721 31,929 41,531 0Standard Bank Group Ltd 15,589 229,314 218,427 0.01Steinhoff International Holdings Ltd 36,353 97,787 117,529 0.01Sun International Ltd/South Africa 35,559 257,964 395,221 0.03Tiger Brands Ltd 2,817 81,888 107,990 0.01Tongaat Hulett Ltd 1,781 23,468 28,070 0Truworths International Ltd 6,039 49,785 76,915 0.01Vodacom Group Ltd 4,621 39,557 67,536 0Woolworths Holdings Ltd/South Africa 13,908 46,877 116,386 0.01Total South Africa 1.22% (2011: 1.18%) 18,060,269 1.22SpainAbengoa SA 3,115 16,398 9,456 0Abertis Infraestructuras SA 8,923 146,138 145,872 0.01Acciona SA 1,968 135,936 145,815 0.01Acerinox SA 12,024 161,481 131,733 0.01ACS Actividades de Construccion y Servicios SA 4,771 192,950 116,365 0.01Almirall SA 1,386 13,123 13,540 0Antena 3 de Television SA 1,711 12,876 8,752 0Banco Bilbao Vizcaya Argentaria SA 55,071 630,097 501,190 0.03Banco de Sabadell SA 53,832 231,771 139,457 0.01Banco Popular Espanol SA 147,808 284,162 113,605 0.01Banco Santander SA 148,108 1,497,911 1,172,151 0.09Bolsas y Mercados Espanoles SA 673 17,889 16,326 0Construcciones y Auxiliar de Ferrocarriles SA 16 7,046 7,277 0Distribuidora Internacional de Alimentacion SA 33,152 172,560 209,839 0.01Duro Felguera SA 1,280 9,519 8,033 0Ebro Foods SA 737 11,482 14,283 0Ence Energia y Celulosa S.A 4,048 12,755 11,207 0Grupo Catalana Occidente S.A. 848 15,721 13,502 0Iberdrola SA 29,667 180,089 161,142 0.01Inditex SA 7,142 502,940 988,669 0.07Mediaset Espana Comunicacion SA 16,183 178,391 107,957 0.01127
<strong>STANLIB</strong> <strong>Funds</strong> <strong>Limited</strong>Portfolio Statement (continued)<strong>STANLIB</strong> Multi-Manager Global Equity Fund as at 31 December <strong>2012</strong> (continued)Common Stock continuedNominal holding Cost Market Value % of Net AssetsUSDUSDSpain (continued)Melia Hotels International SA 1,531 12,944 11,414 0NH Hoteles SA 3,272 13,061 11,086 0Obrascon Huarte Lain SA 449 11,874 12,845 0Prosegur Cia de Seguridad SA 3,290 16,569 18,261 0Red Electrica Corp SA 2,835 127,348 138,479 0.01Repsol SA 10,462 267,265 211,032 0.01Tecnicas Reunidas SA 353 19,101 16,312 0Telefonica SA 52,936 1,139,442 704,880 0.05Tubacex SA 5,374 15,464 13,886 0Viscofan SA 4,244 51,127 230,635 0.02Zeltia SA 12,357 37,846 19,793 0Total Spain 0.37% (2011: 0.43%) 5,424,794 0.37SwedenAarhusKarlshamn AB 625 13,528 26,420 0Active Biotech AB 1,649 13,540 13,878 0Alfa Laval AB 8,030 126,825 167,008 0.01Assa Abloy AB 32,616 678,381 1,217,816 0.08Atlas Copco AB 135,813 2,915,556 3,701,090 0.26Avanza Bank Holding AB 534 15,265 10,692 0Axfood AB 455 13,237 17,136 0Axis Communications AB 1,079 13,477 29,440 0Betsson AB 430 8,536 13,253 0Castellum AB 15,590 192,755 221,192 0.01CDON Group AB 1,730 5,999 10,611 0Clas Ohlson AB 837 13,202 11,065 0Electrolux AB 7,302 166,476 191,264 0.01Fabege AB 2,416 18,969 24,418 0Getinge AB 5,199 116,670 175,819 0.01Hakon Invest AB 836 13,180 15,164 0Hennes & Mauritz AB 48,568 1,676,962 1,675,314 0.11Hexagon AB 6,800 129,020 170,485 0.01Hoganas AB 3,304 72,278 125,955 0.01Hufvudstaden AB 1,539 13,303 19,387 0Intrum Justitia AB 10,631 166,433 158,515 0.01Investment AB Oresund 815 12,544 12,716 0Investor AB 7,501 131,477 195,901 0.01JM AB 994 16,426 17,648 0Kungsleden AB 2,405 16,926 13,087 0Loomis AB 1,200 12,924 19,138 0Lundbergforetagen AB 1,000 33,224 35,340 0Meda AB 2,221 20,045 22,857 0Modern Times Group AB 4,037 162,963 139,811 0.01128
<strong>STANLIB</strong> <strong>Funds</strong> <strong>Limited</strong>Portfolio Statement (continued)<strong>STANLIB</strong> Multi-Manager Global Equity Fund as at 31 December <strong>2012</strong> (continued)Common Stock continuedNominal holding Cost Market Value % of Net AssetsUSDUSDSweden (continued)NCC AB 1,559 29,927 32,592 0Nobia AB 2,214 13,215 9,019 0Nordea Bank AB 614,445 5,130,649 5,865,430 0.41Peab AB 2,207 13,510 10,524 0Rezidor Hotel Group AB 2,545 13,281 8,998 0Sandvik AB 13,430 179,893 213,669 0.01SAS AB 3,789 14,823 4,543 0Scania AB 6,534 125,501 134,889 0.01Skandinaviska Enskilda Banken AB 16,469 129,846 139,870 0.01Skanska AB 9,204 161,600 150,112 0.01SKF AB 7,907 216,545 198,239 0.01Svenska Handelsbanken AB 21,531 503,834 769,171 0.05Swedbank AB 208,000 3,592,920 4,057,393 0.28Swedish Match AB 73,161 2,732,037 2,453,900 0.18Swedish Orphan Biovitrum AB 28,200 139,712 157,353 0.01Tele2 AB 7,322 139,913 131,798 0.01Telefonaktiebolaget LM Ericsson 493,100 4,899,302 4,930,654 0.34TeliaSonera AB 16,620 124,482 112,564 0.01Trelleborg AB 2,458 17,857 30,435 0Volvo AB 18,647 245,680 254,533 0.02Wallenstam AB 2,061 13,593 25,107 0Wihlborgs Fastigheter AB 1,172 13,213 18,196 0Total Sweden 1.90% (2011: 1.26%) 28,161,409 1.9SwitzerlandABB Ltd 26,105 498,199 534,735 0.04ACE Ltd 16,599 1,100,829 1,324,434 0.09Adecco SA 7,600 365,487 398,869 0.03Allied World Assurance Co Holdings AG 300 15,233 23,625 0Allreal Holding AG 112 12,273 17,252 0Aryzta AG 1,590 77,517 81,380 0.01Autoneum Holding AG 274 16,943 13,276 0Bucher Industries AG 117 14,552 22,956 0Cie Financiere Richemont SA 20,933 940,052 1,631,694 0.11Clariant AG 120,708 1,262,146 1,627,289 0.11Credit Suisse Group AG 13,263 460,411 322,538 0.02Dufry AG 266 23,560 34,756 0Flughafen Zuerich AG 49 17,761 22,617 0Forbo Holding AG 28 13,089 17,849 0Foster Wheeler AG 1,100 19,843 26,752 0Galenica AG 64 33,562 36,987 0GAM Holding AG 9,566 128,827 128,543 0.01Garmin Ltd 3,540 106,405 144,467 0.01129
<strong>STANLIB</strong> <strong>Funds</strong> <strong>Limited</strong>Portfolio Statement (continued)<strong>STANLIB</strong> Multi-Manager Global Equity Fund as at 31 December <strong>2012</strong> (continued)Common Stock continuedNominal holding Cost Market Value % of Net AssetsUSDUSDSwitzerland (continued)Geberit AG 1,463 96,946 321,737 0.02Georg Fischer AG 57 21,671 22,900 0Helvetia Holding AG 235 69,890 88,958 0.01Holcim Ltd 3,319 200,480 242,213 0.02Julius Baer Group Ltd 5,141 178,997 181,523 0.01Kaba Holding AG 47 12,379 19,858 0Kudelski SA 1,600 18,358 16,571 0Kuehne + Nagel International AG 983 117,102 118,130 0.01Kuoni Reisen Holding AG 54 16,325 16,105 0Logitech International SA 6,646 104,175 50,244 0Lonza Group AG 1,773 84,766 95,570 0.01Meyer Burger Technology AG 17 377 125 0Mobimo Holding AG 142 27,450 33,695 0Nestle SA 257,519 14,935,404 16,767,526 1.13Novartis AG 177,070 9,702,625 11,113,427 0.75OC Oerlikon Corp AG 3,201 12,715 36,194 0Orascom Development Holding AG 237 12,195 3,224 0Panalpina Welttransport Holding AG 320 31,518 32,355 0Partners Group Holding AG 848 164,263 195,105 0.01Pentair Ltd 1,621 76,642 79,672 0.01PSP Swiss Property AG 419 24,529 39,618 0Rieter Holding AG 78 16,489 13,557 0Roche Holding AG 116,003 18,627,408 23,318,481 1.57Schindler Holding AG 1,801 160,150 259,521 0.02Sika AG 650 1,361,236 1,497,625 0.1Sonova Holding AG 6,606 723,562 731,796 0.05St Galler Kantonalbank AG 37 16,154 15,158 0Swatch Group AG 972 392,276 489,637 0.03Swatch Group AG/The 8,677 599,948 745,558 0.05Swiss Re AG 5,680 252,196 408,928 0.03Swisscom AG 1,881 758,672 809,241 0.05Syngenta AG 8,751 2,954,221 3,504,801 0.24TE Connectivity Ltd 6,135 192,523 227,731 0.02Tecan Group AG 251 16,645 20,977 0Temenos Group AG 1,442 33,098 25,048 0Transocean Ltd 3,970 222,276 177,042 0.01Tyco International Ltd 94,958 1,966,734 2,775,622 0.19UBS AG 196,322 3,069,735 3,060,601 0.21Valiant Holding 133 24,962 12,627 0Valora Holding AG 51 13,033 10,269 0Vontobel Holding AG 339 8,877 10,370 0Weatherford International Ltd/Switzerland 316,500 5,389,655 3,541,635 0.24130
<strong>STANLIB</strong> <strong>Funds</strong> <strong>Limited</strong>Portfolio Statement (continued)<strong>STANLIB</strong> Multi-Manager Global Equity Fund as at 31 December <strong>2012</strong> (continued)Common Stock continuedNominal holding Cost Market Value % of Net AssetsUSDUSDSwitzerland (continued)Zurich Insurance Group AG 34,492 7,585,097 9,167,981 0.62Total Switzerland 5.84% (2011: 5.15%) 86,708,975 5.84ThailandAdvanced Info Service PCL 92,700 212,950 633,354 0.04Airports of Thailand PCL 12,100 37,096 38,369 0Asian Property Development PCL 737,400 153,328 203,670 0.01Bangkok Bank PCL 710,300 4,391,296 4,852,982 0.34Bangkok Expressway PCL 23,500 13,638 26,696 0Bank of Ayudhya PCL 43,200 27,503 45,546 0Banpu PCL 2,150 42,502 28,817 0BEC World PCL 155,892 232,962 361,825 0.02Big C Supercenter PCL 26,100 76,221 176,616 0.01Charoen Pokphand Foods PCL 65,500 54,978 72,266 0CP ALL PCL 1,763,000 1,991,963 2,636,743 0.19Dynasty Ceramic PCL 16,200 27,887 23,832 0GMM Grammy PCL 447,300 199,040 255,900 0.02Hemaraj Land and Development PCL 379,500 22,746 37,457 0Indorama Ventures PCL 20,600 18,538 17,003 0IRPC PCL 174,800 24,032 23,546 0Kasikornbank PCL 188,700 340,288 1,193,641 0.09Kiatnakin Bank PCL 13,800 12,682 21,767 0Krung Thai Bank PCL 43,300 17,407 28,310 0Land and Houses PCL 882,400 213,071 281,221 0.02Major Cineplex Group PCL 57,300 25,036 35,589 0MBK PCL 135,500 309,234 482,827 0.03PTT Exploration & Production PCL 15,800 76,088 84,449 0.01PTT Global Chemical PCL 26,655 45,044 60,995 0PTT PCL 11,500 99,774 124,812 0.01Siam Cement PCL 50,300 325,711 769,545 0.06Siam Commercial Bank PCL 58,600 190,012 346,736 0.02Thai Oil PCL 13,300 21,321 29,348 0Thai Vegetable Oil PCL 33,900 23,056 26,706 0Thanachart Capital PCL 447,300 261,931 552,013 0.04Thitikorn PCL 50,000 28,375 26,970 0Thoresen Thai Agencies PCL 12,700 7,591 6,892 0Total Thailand 0.91% (2011: 0.65%) 13,506,443 0.91TurkeyAkbank TAS 25,955 123,098 127,688 0.01Anadolu Efes Biracilik Ve Malt Sanayii AS 3,421 44,556 49,071 0BIM Birlesik Magazalar AS 2,838 83,249 138,742 0.01Bizim Toptan Satis Magazalari AS 1,231 16,150 19,175 0Coca-Cola Icecek AS 9,000 116,765 184,064 0.01131
<strong>STANLIB</strong> <strong>Funds</strong> <strong>Limited</strong>Portfolio Statement (continued)<strong>STANLIB</strong> Multi-Manager Global Equity Fund as at 31 December <strong>2012</strong> (continued)Common Stock continuedNominal holding Cost Market Value % of Net AssetsUSDUSDTurkey (continued)Eregli Demir ve Celik Fabrikalari TAS 27,995 41,236 38,275 0Haci Omer Sabanci Holding AS 28,019 108,412 152,600 0.01KOC Holding AS 70,012 231,919 362,472 0.03Park Elektrik Uretim Madencilik Sanayi ve Ticaret AS 7,961 26,945 27,388 0Polyester Sanayi AS 39,754 27,178 26,508 0Tupras Turkiye Petrol Rafinerileri AS 3,641 81,349 104,555 0.01Turk Telekomunikasyon AS 8,044 31,765 31,100 0Turkcell Iletisim Hizmetleri AS 13,678 70,048 88,136 0.01Turkiye Garanti Bankasi AS 82,451 327,284 427,931 0.03Turkiye Halk Bankasi AS 18,249 114,853 178,430 0.01Turkiye Is Bankasi 29,605 95,517 102,182 0.01Turkiye Vakiflar Bankasi Tao 10,036 25,607 25,923 0Ulker Biskuvi Sanayi AS 15,756 69,100 85,281 0.01Yapi ve Kredi Bankasi AS 12,153 35,381 35,273 0Total Turkey 0.15% (2011: 0.09%) 2,204,794 0.15U.S. Virgin IslandsAltisource Asset Management Corp 30 121 2,460 0Total U.S. Virgin Islands 0.00% (2011: 0.00%) 2,460 0United Kingdom3i Group Plc 79,561 298,643 280,636 0.02Abcam Plc 3,285 22,299 20,398 0Aberdeen Asset Management Plc 16,800 69,324 100,113 0.01Admiral Group Plc 14,227 296,564 268,261 0.02Aegis Group Plc 13,636 33,537 52,045 0Afren Plc 20,079 33,297 42,788 0Aggreko Plc 7,213 184,369 204,010 0.01Air Berlin Plc 2,813 12,999 5,656 0Alent Plc 3,564 13,676 17,890 0AMEC Plc 14,613 203,727 238,009 0.02Amlin Plc 3,310 21,238 20,370 0Anglo American Plc 15,464 650,486 475,963 0.03Antofagasta Plc 6,786 123,523 145,825 0.01APR Energy Plc 23,045 366,245 300,802 0.02ARM Holdings Plc 22,168 134,775 276,202 0.02Ashmore Group Plc 55,055 309,055 321,543 0.02Ashtead Group Plc 4,000 6,131 27,562 0ASOS Plc 594 17,293 25,558 0Associated British Foods Plc 8,820 148,889 223,942 0.02AstraZeneca Plc 13,086 658,736 618,676 0.04Aveva Group Plc 1,191 28,501 42,204 0Aviva Plc 50,645 333,297 306,985 0.02BAE Systems Plc 92,073 390,373 504,219 0.03132
<strong>STANLIB</strong> <strong>Funds</strong> <strong>Limited</strong>Portfolio Statement (continued)<strong>STANLIB</strong> Multi-Manager Global Equity Fund as at 31 December <strong>2012</strong> (continued)Common Stock continuedNominal holding Cost Market Value % of Net AssetsUSDUSDUnited Kingdom (continued)Barclays Plc 284,502 1,414,435 1,211,865 0.08Barratt Developments Plc 31,272 48,382 105,071 0.01BBA Aviation Plc 5,904 17,442 21,296 0Bellway Plc 1,492 14,353 24,980 0Berendsen Plc 2,855 18,481 27,682 0Berkeley Group Holdings Plc 5,157 101,127 146,949 0.01BG Group Plc 302,808 5,774,240 4,978,739 0.35BHP Billiton Plc 130,958 4,598,971 4,533,111 0.32Big Yellow Group Plc 2,775 13,252 15,616 0Bodycote Plc 3,514 13,403 25,767 0Booker Group Plc 16,480 15,134 26,052 0Bovis Homes Group Plc 2,436 13,999 22,630 0BP Plc 473,335 9,522,038 9,070,579 0.62Brewin Dolphin Holdings Plc 8,785 17,052 29,359 0British American Tobacco Plc 199,245 8,266,540 10,103,215 0.69British Land Co Plc 17,286 127,034 157,913 0.01British Sky Broadcasting Group Plc 21,266 238,202 264,789 0.02Britvic Plc 2,474 18,549 16,311 0BT Group Plc 104,925 272,334 394,151 0.03BTG Plc 4,839 18,891 26,075 0Bunzl Plc 13,436 149,094 220,149 0.01Burberry Group Plc 25,423 459,875 506,645 0.03Cable & Wireless Communications Plc 149,219 123,932 85,741 0.01Cairn Energy Plc 5,000 27,417 21,522 0Capita Plc 657,038 6,842,354 8,063,499 0.55Capital & Counties Properties Plc 4,560 9,281 17,938 0Carillion Plc 5,437 27,514 27,874 0Carnival Plc 8,031 342,962 307,823 0.02Carpetright Plc 1,174 13,997 12,843 0Carphone Warehouse Group Plc 11,378 37,689 38,193 0Centrica Plc 1,755,811 8,516,955 9,521,235 0.65Chemring Group Plc 2,610 23,477 9,741 0Chesnara Plc 5,822 19,024 18,076 0Close Brothers Group Plc 5,721 62,642 80,162 0.01Cobham Plc 39,109 141,007 140,174 0.01Compass Group Plc 69,197 452,280 815,480 0.05Computacenter Plc 2,722 11,898 18,070 0Daily Mail & General Trust Plc 9,126 96,365 81,663 0.01Dairy Crest Group Plc 2,134 13,241 13,320 0Darty Plc 6,593 13,911 5,868 0De La Rue Plc 1,128 14,141 16,731 0Debenhams Plc 13,545 12,979 25,012 0133
<strong>STANLIB</strong> <strong>Funds</strong> <strong>Limited</strong>Portfolio Statement (continued)<strong>STANLIB</strong> Multi-Manager Global Equity Fund as at 31 December <strong>2012</strong> (continued)Common Stock continuedNominal holding Cost Market Value % of Net AssetsUSDUSDUnited Kingdom (continued)Derwent London Plc 1,058 23,407 36,219 0Devro Plc 17,048 29,739 85,018 0.01Diageo Plc 53,470 880,760 1,552,309 0.1Dialog Semiconductor Plc 7,685 179,021 134,854 0.01Dignity Plc 1,047 13,680 18,398 0Dixons Retail Plc 37,820 15,757 17,344 0Domino Printing Sciences Plc 15,800 141,956 148,961 0.01Domino's Pizza Group Plc 2,058 13,627 16,579 0Drax Group Plc 2,994 25,329 26,475 0DS Smith Plc 7,274 12,866 24,097 0Dunelm Group Plc 1,210 7,547 13,552 0easyJet Plc 1,500 9,782 18,665 0Electrocomponents Plc 5,394 17,736 20,815 0Elementis Plc 5,711 7,775 21,463 0EnQuest Plc 10,354 18,764 20,129 0Ensco Plc 8,900 491,588 527,325 0.04Enterprise Inns Plc 7,975 12,245 13,301 0Ferrexpo Plc 3,166 15,183 12,902 0Fidessa Group Plc 567 13,333 13,825 0Filtrona Plc 3,436 12,831 30,719 0Firstgroup Plc 22,779 110,157 77,499 0.01G4S Plc 78,318 318,900 326,539 0.02Gazprom OAO-Spon 3,100 78,140 30,163 0Genus Plc 1,390 19,221 31,542 0GlaxoSmithKline Plc 499,446 10,674,520 10,830,086 0.74Go-Ahead Group Plc 734 13,349 15,165 0Grainger Plc 7,426 13,431 14,147 0Great Portland Estates Plc 26,210 155,313 208,207 0.01Greene King Plc 2,089 14,601 21,138 0Greggs Plc 2,007 13,490 14,785 0Halfords Group Plc 914 4,829 4,928 0Halma Plc 3,483 17,864 25,862 0Hays Plc 56,678 117,163 75,824 0.01Helical Bar Plc 5,573 22,669 20,835 0Hikma Pharmaceuticals Plc 31,224 343,836 386,244 0.03Hochschild Mining Plc 2,843 13,917 22,330 0Homeserve Plc 39,063 233,589 149,217 0.01Howden Joinery Group Plc 174,296 127,362 489,005 0.03HSBC Holdings Plc 1,427,577 13,184,980 14,984,708 1.03Hunting Plc 2,167 19,445 27,757 0ICAP Plc 31,390 152,034 156,646 0.01IG Group Holdings Plc 28,828 209,938 210,542 0.01134
<strong>STANLIB</strong> <strong>Funds</strong> <strong>Limited</strong>Portfolio Statement (continued)<strong>STANLIB</strong> Multi-Manager Global Equity Fund as at 31 December <strong>2012</strong> (continued)Common Stock continuedNominal holding Cost Market Value % of Net AssetsUSDUSDUnited Kingdom (continued)Imagination Technologies Group Plc 3,200 17,474 20,494 0IMI Plc 3,952 51,546 70,214 0Imperial Tobacco Group Plc 83,932 3,007,722 3,234,790 0.22Inchcape Plc 5,362 25,845 37,557 0Inmarsat Plc 17,111 172,423 161,600 0.01InterContinental Hotels Group Plc 5,794 108,165 160,673 0.01Intermediate Capital Group Plc 4,833 20,471 24,825 0International Personal Finance Plc 44,097 160,118 266,289 0.02Interserve Plc 2,022 6,975 12,654 0Intertek Group Plc 16,302 175,749 820,141 0.06Invensys Plc 124,302 474,984 656,675 0.04ITV Plc 132,323 188,301 226,272 0.02J Sainsbury Plc 21,876 124,471 122,643 0.01Jardine Lloyd Thompson Group Plc 1,276 11,943 16,292 0Jazztel Plc 2,679 14,904 18,560 0JD Wetherspoon Plc 1,964 13,200 16,920 0JKX Oil & Gas Plc 6,352 19,422 7,796 0John Wood Group Plc 3,742 35,204 44,190 0Johnson Matthey Plc 4,603 133,703 177,552 0.01Jupiter Fund Management Plc 15,085 46,567 68,290 0Keller Group Plc 1,539 14,958 17,261 0Kier Group Plc 883 14,686 18,989 0Kingfisher Plc 42,379 193,809 195,431 0.01Ladbrokes Plc 31,598 76,686 101,853 0.01Laird Plc 6,776 14,590 22,635 0Lloyds Banking Group Plc 2,040,438 2,752,564 1,589,212 0.11Marshalls Plc 16,632 25,453 26,360 0Marston's Plc 8,728 13,330 17,309 0McBride Plc 5,452 739 11,809 0Michael Page International Plc 69,723 349,779 447,670 0.03Micro Focus International Plc 2,259 16,534 21,224 0Millennium & Copthorne Hotels Plc 11,107 71,779 91,175 0.01Mitchells & Butlers Plc 2,170 11,225 11,400 0Mitie Group Plc 4,360 14,350 18,561 0Mondi Plc 3,950 29,573 42,890 0Morgan Crucible Co Plc 5,002 19,267 21,742 0Mothercare Plc 1,704 13,418 9,341 0N Brown Group Plc 11,785 45,043 70,841 0National Express Group Plc 20,452 72,470 67,852 0National Grid Plc 81,612 765,919 931,936 0.06Next Plc 6,024 182,595 362,794 0.02Northgate Plc 5,412 102,640 26,656 0135
<strong>STANLIB</strong> <strong>Funds</strong> <strong>Limited</strong>Portfolio Statement (continued)<strong>STANLIB</strong> Multi-Manager Global Equity Fund as at 31 December <strong>2012</strong> (continued)Common Stock continuedNominal holding Cost Market Value % of Net AssetsUSDUSDUnited Kingdom (continued)Old Mutual Plc 79,994 182,771 231,327 0.02Ophir Energy Plc 21,106 174,000 172,225 0.01Pace Plc 4,030 13,485 12,256 0Paragon Group of Cos Plc 55,947 156,742 232,174 0.02Pearson Plc 12,845 219,242 248,049 0.02Pennon Group Plc 8,739 92,597 88,783 0.01Perform Group Plc 1,027 6,113 6,427 0Persimmon Plc 3,159 18,796 41,080 0Petropavlovsk Plc 2,534 33,901 14,837 0Premier Farnell Plc 53,000 211,234 166,616 0.01Premier Foods Plc 4,094 12,148 7,487 0Premier Oil Plc 35,928 213,521 196,109 0.01Provident Financial Plc 13,480 199,219 297,562 0.02Prudential Plc 159,046 1,809,325 2,233,690 0.15PZ Cussons Plc 23,394 115,311 144,388 0.01QinetiQ Group Plc 6,747 12,818 20,125 0Rathbone Brothers Plc 1,023 13,252 21,501 0Reckitt Benckiser Group Plc 16,493 624,369 1,039,132 0.07Redrow Plc 7,889 14,646 20,903 0Reed Elsevier Plc 19,887 198,758 207,213 0.01Rentokil Initial Plc 13,684 16,752 21,287 0Restaurant Group Plc 3,822 14,110 23,956 0Rexam Plc 45,647 301,034 323,509 0.02Rightmove Plc 14,022 131,438 326,849 0.02Rio Tinto Plc 29,500 1,440,106 1,683,364 0.11Rolls Royce Holdings 'C' 26,264,156 – 42,692 0Rolls-Royce Holdings Plc 271,681 2,663,869 3,853,116 0.27Rotork Plc 670 19,236 27,717 0Royal Bank of Scotland Group Plc 47,296 436,604 249,397 0.02Royal Dutch Shell Plc 313,061 10,307,824 11,022,764 0.75RPS Group Plc 4,352 12,861 14,799 0SABMiller Plc 11,563 380,062 530,320 0.04Sage Group Plc/The 92,094 340,030 440,559 0.03Salamander Energy Plc 3,561 10,237 10,946 0Savills Plc 2,682 13,458 20,176 0SDL Plc 15,388 166,956 126,191 0.01Senior Plc 4,000 8,883 12,952 0Serco Group Plc 15,177 130,767 131,985 0.01Severn Trent Plc 6,176 132,239 158,015 0.01Shaftesbury Plc 2,860 19,435 26,127 0SIG Plc 8,205 13,308 16,111 0Smith & Nephew Plc 6,309 57,130 69,633 0136
<strong>STANLIB</strong> <strong>Funds</strong> <strong>Limited</strong>Portfolio Statement (continued)<strong>STANLIB</strong> Multi-Manager Global Equity Fund as at 31 December <strong>2012</strong> (continued)Common Stock continuedNominal holding Cost Market Value % of Net AssetsUSDUSDUnited Kingdom (continued)Smiths Group Plc 15,512 234,593 299,299 0.02Soco International Plc 3,261 23,926 18,950 0Spectris Plc 7,640 207,119 251,481 0.02Spirax-Sarco Engineering Plc 1,000 25,301 36,688 0Spirent Communications Plc 12,112 25,077 29,670 0Spirit Pub Co Plc 28,233 21,098 29,258 0Sportingbet Plc 97,022 85,014 84,370 0.01Sports Direct International Plc 3,329 5,481 20,915 0SSE Plc 13,791 262,443 317,652 0.02St James's Place Plc 3,416 15,427 23,321 0Stagecoach Group Plc 47,540 114,196 237,391 0.02Standard Chartered Plc 413,518 9,396,038 10,566,583 0.72Standard Life Plc 38,551 134,482 207,921 0.01Sthree Plc 30,358 144,048 163,338 0.01SuperGroup Plc 6,000 60,693 54,324 0Synergy Health Plc 1,200 12,938 21,281 0TalkTalk Telecom Group Plc 37,406 105,105 141,185 0.01Taylor Wimpey Plc 245,289 220,266 262,165 0.02Telecity Group Plc 2,444 20,052 31,246 0Tesco Plc 153,673 861,867 839,316 0.06Thomas Cook Group Plc 152,287 475,272 118,814 0.01Travis Perkins Plc 16,757 279,909 296,083 0.02TUI Travel Plc 36,769 208,860 168,843 0.01Tullett Prebon Plc 2,925 16,922 11,920 0Tullow Oil Plc 13,567 286,723 276,988 0.02Ultra Electronics Holdings Plc 189 4,785 5,112 0Unilever Plc 117,714 4,042,979 4,525,291 0.31United Utilities Group Plc 15,535 144,821 169,821 0.01Vedanta Resources Plc 6,422 201,355 120,675 0.01Vesuvius Plc 3,564 13,465 20,045 0Victrex Plc 643 12,946 16,807 0Vodafone Group Plc 7,846,055 20,132,206 19,692,028 1.34WH Smith Plc 11,607 78,377 125,750 0.01Whitbread Plc 15,200 406,352 603,113 0.04William Hill Plc 7,358 27,292 41,551 0WPP Plc 36,829 397,044 531,008 0.04WS Atkins Plc 1,672 16,693 20,642 0Xchanging Plc 5,943 8,696 11,931 0Xstrata Plc 48,070 869,878 825,915 0.06Total United Kingdom 10.96% (2011: 11.03%) 162,688,093 10.96United States3D Systems Corp 400 17,501 21,332 0137
<strong>STANLIB</strong> <strong>Funds</strong> <strong>Limited</strong>Portfolio Statement (continued)<strong>STANLIB</strong> Multi-Manager Global Equity Fund as at 31 December <strong>2012</strong> (continued)Common Stock continuedNominal holding Cost Market Value % of Net AssetsUSDUSDUnited States (continued)3M Co 7,417 632,021 688,668 0.05A Schulman Inc 700 13,790 20,251 0AAON Inc 750 11,905 15,660 0AAR Corp 700 11,529 13,062 0Aaron's Inc 400 7,503 11,316 0Abaxis Inc 700 14,088 25,942 0Abbott Laboratories 18,664 463,951 585,117 0.04AbbVie Inc 18,664 505,698 637,562 0.05ABIOMED Inc 500 5,073 6,725 0ABM Industries Inc 600 12,705 11,970 0Acadia Realty Trust 1,500 32,714 37,560 0Accelrys Inc 16,600 136,140 149,898 0.01ACI Worldwide Inc 700 14,508 30,562 0Acme Packet Inc 800 31,258 17,696 0Acorda Therapeutics Inc 500 12,868 12,410 0Actuant Corp 600 12,450 16,734 0Acuity Brands Inc 600 28,210 40,620 0Acxiom Corp 1,500 17,077 26,160 0Adobe Systems Inc 49,850 1,658,244 1,877,850 0.14ADT Corp/The 3,379 108,885 157,157 0.01ADTRAN Inc 8,500 228,069 166,005 0.01Advance Auto Parts Inc 1,641 94,147 118,743 0.01Advanced Energy Industries Inc 1,000 11,817 13,800 0Advent Software Inc 800 18,842 17,096 0Advisory Board Co/The 600 13,250 28,062 0AECOM Technology Corp 800 20,942 19,048 0Aeropostale Inc 900 21,965 11,700 0Aetna Inc 4,455 144,088 206,311 0.01Aflac Inc 11,270 529,971 598,550 0.04Agilent Technologies Inc 5,495 182,981 225,020 0.02AGL Resources Inc 919 36,133 36,714 0Air Products & Chemicals Inc 2,491 205,292 209,319 0.01Airgas Inc 2,034 136,506 185,684 0.01AK Steel Holding Corp 4,500 30,390 20,700 0Alaska Air Group Inc 200 5,484 8,618 0Albany International Corp 700 13,843 15,862 0Albemarle Corp 6,100 382,001 378,932 0.03Alcoa Inc 14,492 178,437 125,646 0.01Alere Inc 900 25,781 16,632 0Alexander & Baldwin Inc 600 11,600 17,604 0Alexandria Real Estate Equities Inc 700 50,569 48,475 0Align Technology Inc 900 15,632 24,966 0138
<strong>STANLIB</strong> <strong>Funds</strong> <strong>Limited</strong>Portfolio Statement (continued)<strong>STANLIB</strong> Multi-Manager Global Equity Fund as at 31 December <strong>2012</strong> (continued)Common Stock continuedNominal holding Cost Market Value % of Net AssetsUSDUSDUnited States (continued)Allegheny Technologies Inc 32,091 1,427,989 974,283 0.07Allergan Inc/United States 23,789 2,106,114 2,181,213 0.16ALLETE Inc 400 14,932 16,388 0Alliance Data Systems Corp 7,392 520,657 1,070,066 0.08Allied Nevada Gold Corp 800 24,196 24,176 0Allscripts Healthcare Solutions Inc 2,400 42,335 22,608 0Allstate Corp/The 10,790 326,063 433,434 0.03Alpha Natural Resources Inc 4,000 29,944 38,960 0Altisource Residential Corp 99 394 1,554 0Altria Group Inc 38,600 997,314 1,213,198 0.09AMAG Pharmaceuticals Inc 1,300 23,406 19,084 0Amazon.com Inc 22,606 2,218,071 5,680,210 0.39AMC Networks Inc 17,272 476,698 854,791 0.07AMCOL International Corp 500 14,479 15,340 0Amedisys Inc 500 12,328 5,630 0AMERCO 200 15,691 25,230 0Ameren Corp 5,641 156,460 173,348 0.01American Axle & Manufacturing Holdings Inc 1,500 14,940 16,785 0American Campus Communities Inc 1,400 53,184 64,540 0American Capital Ltd 3,400 36,113 40,868 0American Eagle Outfitters Inc 1,500 20,702 30,765 0American Equity Investment Life Holding Co 10,300 126,587 125,660 0.01American Express Co 32,259 1,470,743 1,854,247 0.13American Financial Group Inc/OH 600 20,020 23,712 0American Greetings Corp 48,304 994,843 814,888 0.06American International Group Inc 83,033 2,347,011 2,931,065 0.21American Public Education Inc 300 8,282 10,827 0American Science & Engineering Inc 200 15,074 13,016 0American States Water Co 500 17,012 23,985 0American Superconductor Corp 3,100 33,087 8,122 0American Tower Corp 34,775 1,986,146 2,686,021 0.19Ameriprise Financial Inc 3,766 174,882 235,865 0.02AMETEK Inc 6,363 138,422 239,122 0.02Amgen Inc 10,121 571,002 873,948 0.07Amkor Technology Inc 2,200 12,595 9,328 0Amsurg Corp 700 12,656 20,986 0Amtrust Financial Services Inc 440 5,742 12,615 0Anadarko Petroleum Corp 58,148 4,189,810 4,321,559 0.31Analogic Corp 400 18,638 29,692 0Andersons Inc/The 400 14,880 17,160 0Anixter International Inc 400 19,854 25,576 0ANN Inc 800 12,784 27,056 0139
<strong>STANLIB</strong> <strong>Funds</strong> <strong>Limited</strong>Portfolio Statement (continued)<strong>STANLIB</strong> Multi-Manager Global Equity Fund as at 31 December <strong>2012</strong> (continued)Common Stock continuedNominal holding Cost Market Value % of Net AssetsUSDUSDUnited States (continued)Anworth Mortgage Asset Corp 1,900 13,576 10,963 0AO Smith Corp 500 18,849 31,525 0AOL Inc 3,151 82,585 93,301 0.01Apache Corp 4,415 439,901 346,489 0.02Apartment Investment & Management Co 1,300 27,807 35,165 0Apollo Investment Corp 3,200 31,976 26,752 0Apple Inc 13,156 4,484,917 7,012,411 0.48Applied Industrial Technologies Inc 500 14,413 21,005 0Applied Materials Inc 16,960 207,175 193,853 0.01Applied Micro Circuits Corp 2,000 14,526 16,820 0Aptargroup Inc 300 12,959 14,316 0Aqua America Inc 1,000 20,773 25,430 0Arbitron Inc 500 16,280 23,320 0Archer-Daniels-Midland Co 9,033 276,470 247,324 0.02Arena Pharmaceuticals Inc 3,400 30,148 30,702 0Ares Capital Corp 2,300 39,374 40,250 0Ariad Pharmaceuticals Inc 2,300 27,708 44,068 0Arkansas Best Corp 600 12,735 5,730 0ARMOUR Residential REIT Inc 2,200 16,428 14,212 0Armstrong World Industries Inc 400 15,004 20,292 0Arris Group Inc 1,700 16,065 25,381 0Arthur J Gallagher & Co 1,100 31,103 38,093 0Aruba Networks Inc 1,700 35,130 35,258 0Asbury Automotive Group Inc 1,000 13,985 32,030 0Ascena Retail Group Inc 18,000 349,167 332,640 0.02Ascent Capital Group Inc 455 12,024 28,183 0Ashford Hospitality Trust Inc 2,200 17,682 23,122 0Ashland Inc 8,100 495,202 651,321 0.04Aspen Technology Inc 11,100 229,176 306,582 0.02Associated Banc-Corp 2,000 26,950 26,240 0Assurant Inc 3,693 142,332 128,110 0.01Astec Industries Inc 600 18,474 19,992 0Astoria Financial Corp 1,000 12,955 9,360 0AT&T Inc 110,144 3,183,124 3,714,056 0.26athenahealth Inc 500 13,733 36,690 0Atlantic Tele-Network Inc 300 14,330 10,992 0Atlas Air Worldwide Holdings Inc 200 9,699 8,858 0Atmel Corp 4,900 36,149 32,095 0ATMI Inc 800 11,764 16,688 0Atmos Energy Corp 1,000 30,328 35,120 0Atwood Oceanics Inc 700 21,997 32,067 0Automatic Data Processing Inc 7,463 353,059 425,391 0.03140
<strong>STANLIB</strong> <strong>Funds</strong> <strong>Limited</strong>Portfolio Statement (continued)<strong>STANLIB</strong> Multi-Manager Global Equity Fund as at 31 December <strong>2012</strong> (continued)Common Stock continuedNominal holding Cost Market Value % of Net AssetsUSDUSDUnited States (continued)AutoZone Inc 703 211,442 249,206 0.02Auxilium Pharmaceuticals Inc 600 15,321 11,112 0Avid Technology Inc 1,000 12,265 7,580 0Avis Budget Group Inc 1,400 16,924 27,748 0Avista Corp 700 16,165 16,863 0Avnet Inc 3,883 101,975 118,859 0.01Avon Products Inc 5,901 179,660 84,797 0.01AVX Corp 1,000 14,235 10,780 0B/E Aerospace Inc 5,000 209,415 246,950 0.02Babcock & Wilcox Co/The 1,300 30,214 34,060 0Badger Meter Inc 400 13,945 18,952 0Baker Hughes Inc 6,806 320,877 278,025 0.02Balchem Corp 600 19,210 21,846 0Ball Corp 3,758 113,975 168,133 0.01Bally Technologies Inc 700 23,988 31,283 0BancorpSouth Inc 900 12,920 13,068 0Bank Mutual Corp 1,800 6,869 7,722 0Bank of America Corp 316,546 4,684,932 3,675,099 0.26Bank of Hawaii Corp 500 25,293 22,030 0Bank Of Montreal Npv 8,160 377,381 499,963 0.03Bank of New York Mellon Corp/The 14,265 383,624 366,753 0.02Bank of the Ozarks Inc 600 11,565 20,076 0Barnes Group Inc 800 15,379 17,952 0Barrick Gold Corp Npv 5,300 257,124 185,553 0.01Baxter International Inc 48,642 3,075,657 3,242,476 0.23BB&T Corp 74,462 2,005,210 2,167,589 0.16Beacon Roofing Supply Inc 700 10,231 23,289 0Becton Dickinson and Co 3,039 230,894 237,650 0.02Bed Bath & Beyond Inc 3,651 171,525 204,018 0.01Belden Inc 600 16,524 26,982 0Belo Corp 2,000 12,340 15,340 0Bemis Co Inc 700 21,142 23,429 0Benchmark Electronics Inc 100 1,653 1,661 0Berkshire Hathaway Inc 36,885 2,389,466 3,311,535 0.23Berry Petroleum Co 10,400 469,777 348,920 0.02Best Buy Co Inc 6,258 206,490 74,095 0Big Lots Inc 500 17,546 14,220 0Bill Barrett Corp 700 29,238 12,446 0Biogen Idec Inc 3,102 228,637 454,753 0.03BioMarin Pharmaceutical Inc 7,900 273,882 388,996 0.03BioMed Realty Trust Inc 1,600 28,458 30,944 0Bio-Rad Laboratories Inc 200 19,290 20,976 0141
<strong>STANLIB</strong> <strong>Funds</strong> <strong>Limited</strong>Portfolio Statement (continued)<strong>STANLIB</strong> Multi-Manager Global Equity Fund as at 31 December <strong>2012</strong> (continued)Common Stock continuedNominal holding Cost Market Value % of Net AssetsUSDUSDUnited States (continued)Bio-Reference Labs Inc 700 13,988 20,048 0BJ's Restaurants Inc 200 7,871 6,578 0Black Box Corp 500 13,821 12,155 0Black Hills Corp 500 16,084 18,175 0Blackbaud Inc 900 22,192 20,520 0BlackRock Inc 4,618 842,689 954,633 0.07Blount International Inc 1,200 13,392 18,972 0Blue Nile Inc 22,684 768,313 873,334 0.07Bob Evans Farms Inc/DE 500 12,933 20,100 0Boeing Co/The 8,084 564,681 609,453 0.04BorgWarner Inc 2,204 118,503 157,850 0.01Boston Private Financial Holdings Inc 1,900 12,369 17,100 0Boston Properties Inc 2,504 232,325 264,948 0.02Boston Scientific Corp 23,439 139,928 134,071 0.01Bottomline Technologies de Inc 7,200 136,711 189,936 0.01Boyd Gaming Corp 1,500 12,263 9,960 0Brady Corp 500 14,070 16,685 0Brandywine Realty Trust 1,400 15,890 17,038 0BRE Properties Inc 800 34,311 40,648 0Briggs & Stratton Corp 700 12,642 14,742 0Brinker International Inc 1,000 15,555 30,980 0Brink's Co/The 800 18,568 22,808 0Bristol-Myers Squibb Co 112,542 3,524,953 3,669,995 0.26Bristow Group Inc 500 19,448 26,825 0Broadcom Corp 27,437 966,327 910,908 0.07Broadridge Financial Solutions Inc 3,600 85,168 82,332 0.01Brocade Communications Systems Inc 2,900 15,713 15,428 0Brookdale Senior Living Inc 1,200 18,739 30,384 0Brookline Bancorp Inc 1,300 12,051 11,037 0Brooks Automation Inc 1,700 13,609 13,685 0Brown & Brown Inc 1,200 28,711 30,540 0Brown Shoe Co Inc 900 12,776 16,524 0Brown-Forman Corp 3,112 134,284 196,710 0.01Bruker Corp 12,800 192,979 195,200 0.01Brunswick Corp/DE 1,000 16,279 29,090 0Buckeye Technologies Inc 600 7,299 17,232 0Buffalo Wild Wings Inc 300 12,612 21,834 0Cabela's Inc 300 4,643 12,525 0Cablevision Systems Corp 150,474 2,747,185 2,248,082 0.16Cabot Corp 900 29,336 35,856 0Cabot Microelectronics Corp 400 13,382 14,184 0CACI International Inc 300 14,679 16,497 0142
<strong>STANLIB</strong> <strong>Funds</strong> <strong>Limited</strong>Portfolio Statement (continued)<strong>STANLIB</strong> Multi-Manager Global Equity Fund as at 31 December <strong>2012</strong> (continued)Common Stock continuedNominal holding Cost Market Value % of Net AssetsUSDUSDUnited States (continued)Cadence Design Systems Inc 199,200 2,323,632 2,693,184 0.19Calgon Carbon Corp 900 11,129 12,753 0California Water Service Group 1,000 17,743 18,340 0Callaway Golf Co 2,500 15,286 16,225 0Cal-Maine Foods Inc 400 11,922 16,052 0Calpine Corp 7,777 101,404 140,919 0.01Capella Education Co 500 24,168 14,115 0Capital One Financial Corp 59,163 3,261,709 3,427,904 0.24Capital Senior Living Corp 11,200 105,758 209,440 0.01CapitalSource Inc 3,300 19,206 24,981 0Capitol Federal Financial Inc 805 9,166 9,435 0CARBO Ceramics Inc 300 31,117 23,493 0Cardinal Health Inc 5,367 194,482 221,013 0.01Career Education Corp 900 15,316 3,168 0CareFusion Corp 4,100 93,665 117,178 0.01Carlisle Cos Inc 4,500 215,796 264,420 0.02CarMax Inc 4,812 103,602 180,642 0.01Carpenter Technology Corp 700 33,253 36,141 0Carrizo Oil & Gas Inc 700 14,214 14,637 0Carter's Inc 700 19,814 38,962 0Cascade Corp 300 10,404 19,290 0Casey's General Stores Inc 400 15,200 21,240 0Cash America International Inc 400 16,653 15,868 0Caterpillar Inc 19,111 1,709,115 1,712,728 0.13Cathay General Bancorp 1,100 12,942 21,450 0Cato Corp/The 500 11,723 13,715 0Cavco Industries Inc 1,586 55,029 79,268 0.01Cavium Inc 1,000 30,268 31,200 0CBL & Associates Properties Inc 2,100 26,864 44,541 0CBOE Holdings Inc 600 15,978 17,664 0CBRE Group Inc 75,076 1,082,489 1,494,763 0.11CBS Corp 73,498 1,755,661 2,796,150 0.2CC Media Holdings Inc 19,726 639,113 67,068 0CEC Entertainment Inc 400 12,884 13,256 0Cedar Realty Trust Inc 1,700 7,199 8,976 0Celanese Corp 3,682 118,100 163,959 0.01Celgene Corp 24,161 1,863,104 1,900,263 0.14Centene Corp 15,700 595,491 643,700 0.04CenterPoint Energy Inc 9,473 145,111 182,261 0.01Central European Distribution Corp 3,000 35,406 6,510 0Century Aluminum Co 1,300 14,151 11,388 0CenturyLink Inc 42,287 1,626,120 1,654,267 0.12143
<strong>STANLIB</strong> <strong>Funds</strong> <strong>Limited</strong>Portfolio Statement (continued)<strong>STANLIB</strong> Multi-Manager Global Equity Fund as at 31 December <strong>2012</strong> (continued)Common Stock continuedNominal holding Cost Market Value % of Net AssetsUSDUSDUnited States (continued)Cepheid Inc 900 22,162 30,420 0Cerner Corp 4,155 206,617 322,553 0.02CF Industries Holdings Inc 971 110,958 197,200 0.01CH Energy Group Inc 300 14,294 19,560 0Charles River Laboratories International Inc 700 21,340 26,229 0Charles Schwab Corp/The 14,205 228,208 203,984 0.01Chart Industries Inc 400 6,682 26,664 0Checkpoint Systems Inc 700 11,131 7,511 0Cheesecake Factory Inc/The 100 2,646 3,271 0Chemed Corp 5,200 325,558 356,460 0.02Chemical Financial Corp 1,000 18,861 23,700 0Cheniere Energy Inc 1,900 28,953 35,530 0Chesapeake Energy Corp 6,302 149,599 104,676 0.01Chevron Corp 35,504 3,376,505 3,842,243 0.27Chico's FAS Inc 1,800 16,146 33,246 0Children's Place Retail Stores Inc/The 300 12,554 13,284 0Chimera Investment Corp 12,000 35,617 31,200 0Chiquita Brands International Inc 1,000 14,040 8,240 0Chubb Corp/The 3,849 233,587 289,907 0.02Ciena Corp 1,500 18,640 23,550 0Cigna Corp 4,711 183,443 251,756 0.02Cincinnati Bell Inc 17,220 65,660 94,366 0.01Cincinnati Financial Corp 5,335 154,481 208,812 0.01Cinemark Holdings Inc 1,100 19,754 28,556 0CIRCOR International Inc 400 12,552 15,836 0Cirrus Logic Inc 6,600 217,232 191,202 0.02Cisco Systems Inc 248,783 4,838,794 4,888,586 0.35CIT Group Inc 20,639 830,531 797,078 0.06Citigroup Inc 222,446 7,798,896 8,804,413 0.6Citrix Systems Inc 2,700 178,974 177,498 0.01City Holding Co 600 17,326 20,868 0City National Corp/CA 5,800 289,317 286,984 0.02City Telecom (H.K.) Ltd 1,900 29,803 12,046 0CLARCOR Inc 400 15,570 19,096 0Clean Harbors Inc 600 21,166 32,988 0Clearwater Paper Corp 400 13,308 15,664 0Cleco Corp 600 17,394 24,000 0Cliffs Natural Resources Inc 6,807 551,700 262,478 0.02CME Group Inc/IL 21,375 1,209,970 1,083,499 0.08CNO Financial Group Inc 3,400 18,153 31,722 0Coach Inc 12,712 747,549 705,770 0.05Cobalt International Energy Inc 25,600 437,049 628,224 0.04144
<strong>STANLIB</strong> <strong>Funds</strong> <strong>Limited</strong>Portfolio Statement (continued)<strong>STANLIB</strong> Multi-Manager Global Equity Fund as at 31 December <strong>2012</strong> (continued)Common Stock continuedNominal holding Cost Market Value % of Net AssetsUSDUSDUnited States (continued)Coca-Cola Co/The 180,607 6,376,488 6,550,616 0.45Coeur d'Alene Mines Corp 1,100 20,982 27,049 0Cogent Communications Group Inc 15,400 293,863 348,656 0.02Cognex Corp 700 15,180 25,753 0Cognizant Technology Solutions Corp 6,740 464,547 498,962 0.03Coherent Inc 400 15,078 20,240 0Coinstar Inc 300 14,130 15,621 0Colfax Corp 4,540 137,812 183,098 0.01Colgate-Palmolive Co 5,712 480,816 597,247 0.04Colonial Properties Trust 1,100 19,225 23,507 0Columbia Banking System Inc 700 11,865 12,551 0Comcast Corp 207,471 5,590,807 7,743,151 0.53Commerce Bancshares Inc/MO 672 25,142 23,567 0Commercial Metals Co 1,100 15,840 16,346 0CommonWealth REIT 1,300 31,964 20,579 0Community Bank System Inc 500 12,443 13,670 0Community Health Systems Inc 1,100 29,284 33,825 0Community Trust Bancorp Inc 300 7,755 9,810 0CommVault Systems Inc 700 14,151 48,790 0Compass Minerals International Inc 2,500 180,433 186,925 0.01Compuware Corp 12,200 113,360 132,492 0.01comScore Inc 700 14,084 9,639 0Comstock Resources Inc 1,200 23,500 18,144 0Comtech Telecommunications Corp 600 12,966 15,228 0Conceptus Inc 900 12,290 18,891 0Concho Resources Inc 2,144 212,437 172,785 0.01Concur Technologies Inc 700 34,002 47,257 0CONMED Corp 700 13,794 19,558 0ConocoPhillips 13,765 667,614 798,508 0.06CONSOL Energy Inc 4,307 169,205 138,255 0.01Consolidated Communications Holdings Inc 800 13,676 12,728 0Consolidated Edison Inc 4,514 261,179 250,617 0.02Consolidated Graphics Inc 400 15,343 13,968 0Constant Contact Inc 900 16,336 12,762 0Contango Oil & Gas Co 300 13,958 12,678 0Convergys Corp 1,700 16,458 27,897 0Con-way Inc 700 18,448 19,460 0Cooper Cos Inc/The 500 27,300 46,240 0Cooper Tire & Rubber Co 1,000 14,446 25,360 0Copart Inc 900 16,213 26,550 0CoreLogic Inc/United States 18,470 329,151 497,212 0.03Corning Inc 17,607 339,907 222,024 0.01145
<strong>STANLIB</strong> <strong>Funds</strong> <strong>Limited</strong>Portfolio Statement (continued)<strong>STANLIB</strong> Multi-Manager Global Equity Fund as at 31 December <strong>2012</strong> (continued)Common Stock continuedNominal holding Cost Market Value % of Net AssetsUSDUSDUnited States (continued)Corporate Executive Board Co/The 600 18,997 28,464 0Corporate Office Properties Trust 1,200 43,112 29,952 0Corrections Corp of America 1,200 25,596 42,564 0Corvel Corp 4,300 186,184 192,769 0.01CoStar Group Inc 400 19,318 35,720 0Costco Wholesale Corp 43,597 2,109,968 4,307,820 0.3Cousins Properties Inc 1,911 13,259 15,957 0Covance Inc 300 14,351 17,337 0Covanta Holding Corp 1,200 17,766 22,104 0Cracker Barrel Old Country Store Inc 300 14,468 19,263 0Crane Co 500 19,032 23,140 0Credicorp Ltd Usd5 340 35,979 49,640 0Crocs Inc 1,000 18,583 14,390 0Crown Castle International Corp 4,996 212,867 360,461 0.02Crown Holdings Inc 2,981 86,891 109,671 0.01CSG Systems International Inc 1,000 15,273 18,170 0CSX Corp 13,965 257,597 275,390 0.02CTC Media Inc 3,568 42,039 27,759 0CubeSmart 21,200 267,773 308,672 0.02Cubic Corp 300 11,921 14,394 0Cubist Pharmaceuticals Inc 700 23,968 29,435 0Cullen/Frost Bankers Inc 800 45,903 43,424 0Cummins Inc 2,344 221,248 253,972 0.02Curtiss-Wright Corp 400 12,124 13,116 0CVB Financial Corp 1,900 15,635 19,760 0CVR Energy Inc 300 8,531 14,622 0CVS Caremark Corp 255,170 9,226,149 12,342,572 0.84Cyberonics Inc 500 11,623 26,265 0Cymer Inc 400 13,534 36,140 0Cypress Semiconductor Corp 700 9,242 7,581 0Cytec Industries Inc 600 26,083 41,298 0Dana Holding Corp 13,700 198,204 213,583 0.01Danaher Corp 50,047 2,423,675 2,798,628 0.2Darden Restaurants Inc 2,797 123,966 126,061 0.01Darling International Inc 1,700 17,570 27,251 0DCT Industrial Trust Inc 4,100 18,145 26,568 0DDR Corp 2,900 32,872 45,356 0Dealertrack Technologies Inc 800 12,952 22,960 0Dean Foods Co 2,300 18,603 37,950 0Deckers Outdoor Corp 400 27,572 16,108 0Deere & Co 4,403 332,918 380,507 0.03Dell Inc 21,133 331,283 214,077 0.01146
<strong>STANLIB</strong> <strong>Funds</strong> <strong>Limited</strong>Portfolio Statement (continued)<strong>STANLIB</strong> Multi-Manager Global Equity Fund as at 31 December <strong>2012</strong> (continued)Common Stock continuedNominal holding Cost Market Value % of Net AssetsUSDUSDUnited States (continued)Delta Air Lines Inc 124,514 1,567,949 1,477,981 0.11Deltic Timber Corp 300 13,436 21,186 0Deluxe Corp 600 11,859 19,332 0Dendreon Corp 2,300 56,466 12,144 0DENTSPLY International Inc 4,390 141,333 173,844 0.01Devon Energy Corp 5,144 346,914 267,694 0.02DFC Global Corp 1,050 12,159 19,436 0Diamond Foods Inc 300 13,070 4,101 0Diamond Offshore Drilling Inc 1,725 109,198 117,231 0.01DiamondRock Hospitality Co 2,400 19,842 21,600 0Digital Generation Inc 1,400 18,409 15,176 0Digital River Inc 400 6,859 5,752 0DigitalGlobe Inc 500 15,048 12,220 0Dillard's Inc 300 6,659 25,137 0Dime Community Bancshares Inc 1,400 16,346 19,432 0DineEquity Inc 300 9,801 20,094 0Diodes Inc 700 12,187 12,145 0DIRECTV 17,951 574,791 900,602 0.07Discover Financial Services 8,722 211,469 336,233 0.02Discovery Communications Inc 19,374 789,678 1,225,925 0.09DISH Network Corp 4,457 83,600 162,235 0.01Dollar Tree Inc 5,144 126,217 208,641 0.01Dominion Resources Inc/VA 7,462 347,861 386,532 0.03Domino's Pizza Inc 500 6,628 21,775 0Domtar Corp 500 38,378 41,760 0Donaldson Co Inc 1,600 36,268 52,544 0Douglas Emmett Inc 9,200 200,936 214,360 0.01Dow Chemical Co/The 13,424 393,113 433,998 0.03Dr Pepper Snapple Group Inc 68,224 2,749,897 3,013,454 0.21DreamWorks Animation SKG Inc 35,100 729,252 581,607 0.04Dresser-Rand Group Inc 900 35,124 50,526 0Dril-Quip Inc 3,000 193,725 219,150 0.01DST Systems Inc 11,609 535,462 703,505 0.05DSW Inc 300 19,375 19,707 0DTS Inc/CA 400 14,426 6,676 0Duke Energy Corp 5,923 316,443 377,828 0.03Dunkin' Brands Group Inc 1,100 37,481 36,498 0DuPont Fabros Technology Inc 700 15,914 16,912 0Dycom Industries Inc 1,100 16,120 21,780 0E*TRADE Financial Corp 3,700 48,673 33,078 0Eagle Materials Inc 500 12,135 29,240 0EarthLink Inc 3,200 24,943 20,672 0147
<strong>STANLIB</strong> <strong>Funds</strong> <strong>Limited</strong>Portfolio Statement (continued)<strong>STANLIB</strong> Multi-Manager Global Equity Fund as at 31 December <strong>2012</strong> (continued)Common Stock continuedNominal holding Cost Market Value % of Net AssetsUSDUSDUnited States (continued)East West Bancorp Inc 1,700 28,509 36,533 0EastGroup Properties Inc 400 14,370 21,524 0Eastman Chemical Co 3,646 126,244 248,220 0.02eBay Inc 42,662 1,225,799 2,177,042 0.16EchoStar Corp 700 13,517 23,947 0EI du Pont de Nemours & Co 10,872 493,952 489,023 0.03El Paso Electric Co 600 13,908 19,146 0Electro Scientific Industries Inc 1,100 12,502 10,934 0Electronic Arts Inc 8,898 147,149 129,199 0.01Electronics for Imaging Inc 1,200 13,566 22,776 0Eli Lilly & Co 12,571 476,673 620,002 0.04Elizabeth Arden Inc 400 6,232 17,988 0EMC Corp/MA 21,487 473,850 543,836 0.04EMCOR Group Inc 12,700 350,518 439,293 0.03Emeritus Corp 700 12,408 17,290 0Emerson Electric Co 8,160 418,698 432,317 0.03Empire District Electric Co/The 600 12,090 12,210 0Employers Holdings Inc 800 11,764 16,464 0Emulex Corp 13,800 135,422 100,740 0.01Encore Capital Group Inc 600 12,852 18,366 0Encore Wire Corp 600 12,765 18,180 0Endo Health Solutions Inc 1,200 37,005 31,512 0Energizer Holdings Inc 29,500 2,338,693 2,359,705 0.17Energy XXI Bermuda 1,000 26,046 28,500 0EnerNOC Inc 1,800 31,406 21,150 0EnerSys Inc 500 12,290 18,805 0EnPro Industries Inc 600 18,005 24,558 0Entegris Inc 2,800 13,118 25,676 0Entergy Corp 2,427 170,740 154,697 0.01Enzon Pharmaceuticals Inc 900 8,396 3,978 0EOG Resources Inc 67,858 6,567,708 8,195,889 0.56EPIQ Systems Inc 1,400 18,292 17,864 0EPR Properties 500 21,395 23,045 0EQT Corp 2,784 114,343 164,145 0.01Equity Lifestyle Properties Inc 500 31,039 33,650 0Equity One Inc 800 13,304 16,808 0Equity Residential 4,804 257,160 272,099 0.02ESCO Technologies Inc 400 12,816 14,948 0Essex Property Trust Inc 400 43,390 58,680 0Estee Lauder Cos Inc/The 31,187 765,212 1,866,854 0.14Esterline Technologies Corp 300 15,257 19,077 0Ethan Allen Interiors Inc 800 12,020 20,568 0148
<strong>STANLIB</strong> <strong>Funds</strong> <strong>Limited</strong>Portfolio Statement (continued)<strong>STANLIB</strong> Multi-Manager Global Equity Fund as at 31 December <strong>2012</strong> (continued)Common Stock continuedNominal holding Cost Market Value % of Net AssetsUSDUSDUnited States (continued)Euronet Worldwide Inc 800 11,948 18,864 0EXCO Resources Inc 5,200 52,564 35,152 0Exelon Corp 8,802 366,508 261,683 0.02Exide Technologies 5,800 22,658 19,836 0Expedia Inc 2,200 53,513 135,190 0.01Expeditors International of Washington Inc 5,941 224,939 234,907 0.02Express Inc 11,900 183,856 179,571 0.01Express Scripts Holding Co 21,943 1,036,366 1,184,483 0.09Exterran Holdings Inc 600 8,396 13,140 0Extra Space Storage Inc 900 19,053 32,742 0Exxon Mobil Corp 127,744 10,144,984 11,062,629 0.76Ezcorp Inc 700 13,640 13,902 0F5 Networks Inc 1,487 148,095 144,358 0.01Facebook Inc 7,666 214,541 204,069 0.01FactSet Research Systems Inc 300 26,298 26,418 0Fair Isaac Corp 500 12,270 21,000 0Fairchild Semiconductor International Inc 1,400 12,397 20,146 0FARO Technologies Inc 300 6,015 10,701 0Federal Realty Investment Trust 2,312 192,084 240,494 0.02Federal Signal Corp 900 5,099 6,858 0Federal-Mogul Corp 800 15,160 6,408 0Federated Investors Inc 10,045 267,448 203,311 0.01FedEx Corp 3,303 287,770 303,017 0.02FEI Co 600 12,630 33,270 0FelCor Lodging Trust Inc 2,200 8,533 10,296 0Ferro Corp 2,900 22,778 12,151 0Fifth & Pacific Cos Inc 1,100 5,924 13,684 0Fifth Third Bancorp 14,797 201,680 224,914 0.02Finisar Corp 1,800 33,926 29,322 0Finish Line Inc/The 900 11,898 17,037 0First American Financial Corp 1,000 14,912 24,060 0First Cash Financial Services Inc 1,500 49,912 74,415 0.01First Citizens BancShares Inc/NC 100 18,933 16,300 0First Commonwealth Financial Corp 2,600 13,221 17,732 0First Financial Bancorp 1,000 15,765 14,600 0First Financial Bankshares Inc 450 14,330 17,523 0First Horizon National Corp 1,900 17,041 18,829 0First Midwest Bancorp Inc/IL 1,600 15,005 20,000 0First Niagara Financial Group Inc 3,100 29,372 24,583 0First Republic Bank/CA 1,001 31,990 32,823 0FirstEnergy Corp 5,832 236,339 243,428 0.02FirstMerit Corp 1,200 23,490 17,016 0149
<strong>STANLIB</strong> <strong>Funds</strong> <strong>Limited</strong>Portfolio Statement (continued)<strong>STANLIB</strong> Multi-Manager Global Equity Fund as at 31 December <strong>2012</strong> (continued)Common Stock continuedNominal holding Cost Market Value % of Net AssetsUSDUSDUnited States (continued)FleetCor Technologies Inc 800 41,785 42,880 0Fleetwood Enterprises 249,607 904,158 250 0FLIR Systems Inc 4,661 130,978 103,987 0.01Flowers Foods Inc 1,200 19,100 27,936 0Flowserve Corp 1,415 140,991 207,651 0.01Fluor Corp 2,216 113,935 130,279 0.01Flushing Financial Corp 1,200 14,298 18,384 0FMC Corp 4,780 165,523 279,630 0.02FNB Corp/PA 1,500 13,103 15,915 0Foot Locker Inc 1,500 34,144 48,180 0Ford Motor Co 129,663 1,581,863 1,679,136 0.12Forest Oil Corp 1,500 34,109 10,035 0Forestar Group Inc 700 9,261 12,117 0FormFactor Inc 1,200 10,950 5,472 0Forrester Research Inc 12,016 366,959 321,909 0.02Fortinet Inc 1,700 31,583 35,802 0Fortune Brands Home & Security Inc 1,700 30,829 49,657 0Forward Air Corp 700 19,612 24,500 0Franklin Electric Co Inc 400 13,368 24,828 0Franklin Resources Inc 2,224 242,012 279,557 0.02Franklin Street Properties Corp 1,400 16,332 17,248 0Fred's Inc 1,200 13,026 15,972 0Freeport-McMoRan Copper & Gold Inc 17,403 765,087 595,182 0.04Fresh Market Inc/The 300 17,333 14,427 0FTI Consulting Inc 500 17,980 16,500 0Fulton Financial Corp 2,200 19,437 21,142 0Gannett Co Inc 28,100 433,566 505,800 0.03Gap Inc/The 5,857 107,587 181,684 0.01Gardner Denver Inc 400 24,180 27,396 0Gartner Inc 37,402 687,607 1,721,614 0.13GATX Corp 600 18,604 25,980 0Gazprom OAO 148,311 865,194 698,189 0.05General Cable Corp 600 14,835 18,240 0General Dynamics Corp 3,223 216,106 223,257 0.02General Electric Co 146,515 2,512,335 3,073,885 0.22General Growth Properties Inc 8,969 135,821 178,124 0.01General Mills Inc 7,944 296,135 321,017 0.02General Motors Co 5,024 152,627 144,792 0.01Genesco Inc 300 8,144 16,491 0Genesee & Wyoming Inc 600 27,704 45,648 0Gentex Corp/MI 600 18,830 11,292 0Genworth Financial Inc 7,000 41,683 52,570 0150
<strong>STANLIB</strong> <strong>Funds</strong> <strong>Limited</strong>Portfolio Statement (continued)<strong>STANLIB</strong> Multi-Manager Global Equity Fund as at 31 December <strong>2012</strong> (continued)Common Stock continuedNominal holding Cost Market Value % of Net AssetsUSDUSDUnited States (continued)Geo Group Inc/The 600 13,071 16,902 0Geoeye Inc 400 14,578 12,292 0Geron Corp 8,600 30,875 12,126 0Getty Realty Corp 500 12,388 9,025 0Gibson Energy Inc 800 17,485 19,448 0Gilead Sciences Inc 85,556 4,283,014 6,287,510 0.43Glacier Bancorp Inc 800 12,828 11,760 0Global Payments Inc 600 26,530 27,174 0Globe Specialty Metals Inc 1,000 17,768 13,750 0GNC Holdings Inc 800 22,160 26,616 0Goldman Sachs Group Inc/The 21,786 2,573,829 2,780,329 0.2Google Inc 20,962 11,803,055 14,867,507 1.01Government Properties Income Trust 500 12,608 11,980 0Graco Inc 800 27,720 41,192 0GrafTech International Ltd 1,400 22,064 13,146 0Grand Canyon Education Inc 600 10,848 14,076 0Granite Construction Inc 500 11,723 16,800 0Great Plains Energy Inc 1,400 25,872 28,406 0Greatbatch Inc 900 19,124 20,889 0Green Mountain Coffee Roasters Inc 2,403 196,066 99,364 0.01Greenhill & Co Inc 600 28,391 31,176 0Greif Inc 200 11,777 8,902 0Griffon Corp 2,000 18,897 22,900 0Group 1 Automotive Inc 500 13,693 30,985 0Guess? Inc 300 9,921 7,353 0Gulfmark Offshore Inc 400 11,076 13,792 0H&R Block Inc 6,650 94,277 123,424 0.01Hackett Group Inc/The 34,604 183,926 148,105 0.01Haemonetics Corp 1,400 49,686 57,176 0Hain Celestial Group Inc/The 600 12,657 32,520 0Halliburton Co 136,089 4,600,912 4,722,288 0.34Halozyme Therapeutics Inc 2,900 19,542 19,459 0Hancock Holding Co 1,100 34,327 34,903 0Hanesbrands Inc 16,435 403,040 588,866 0.04Hanger Inc 13,500 295,921 369,495 0.02Hanover Insurance Group Inc/The 400 17,906 15,492 0Harley-Davidson Inc 4,260 145,612 208,101 0.01Harman International Industries Inc 500 19,617 22,315 0Harmonic Inc 2,200 14,905 11,154 0Harris Teeter Supermarkets Inc 500 19,352 19,270 0Harsco Corp 900 20,655 21,150 0Harte-Hanks Inc 1,200 12,540 7,080 0151
<strong>STANLIB</strong> <strong>Funds</strong> <strong>Limited</strong>Portfolio Statement (continued)<strong>STANLIB</strong> Multi-Manager Global Equity Fund as at 31 December <strong>2012</strong> (continued)Common Stock continuedNominal holding Cost Market Value % of Net AssetsUSDUSDUnited States (continued)Hartford Financial Services Group Inc 5,776 140,579 129,613 0.01Hasbro Inc 3,599 158,951 129,132 0.01Hatteras Financial Corp 800 22,590 19,824 0Hawaiian Electric Industries Inc 1,000 24,773 25,130 0Haynes International Inc 400 13,340 20,748 0HB Fuller Co 800 15,574 27,840 0HCC Insurance Holdings Inc 600 16,477 22,314 0Health Care REIT Inc 4,417 220,272 270,718 0.02Health Management Associates Inc 21,388 135,718 199,122 0.01Health Net Inc/CA 1,000 25,923 24,290 0Healthcare Realty Trust Inc 500 10,370 12,000 0Healthcare Services Group Inc 1,100 17,273 25,542 0HealthSouth Corp 3,300 65,615 69,630 0Healthways Inc 600 7,049 6,414 0Heartland Express Inc 800 12,500 10,456 0Heartland Payment Systems Inc 800 11,784 23,584 0Heckmann Corp 2,800 12,222 11,284 0Hecla Mining Co 3,600 19,275 20,988 0Heidrick & Struggles International Inc 3,053 80,308 46,589 0Helix Energy Solutions Group Inc 1,300 16,436 26,806 0Helmerich & Payne Inc 2,792 121,550 156,380 0.01Henry Schein Inc 32,562 2,463,196 2,619,939 0.18Herman Miller Inc 900 17,358 19,287 0Hersha Hospitality Trust 4,000 25,986 20,000 0Hess Corp 3,580 213,178 189,525 0.01Hewlett-Packard Co 44,226 1,460,441 629,778 0.04Hexcel Corp 1,200 24,763 32,328 0Hibbett Sports Inc 500 13,428 26,345 0Highwoods Properties Inc 700 22,327 23,415 0Hillenbrand Inc 600 12,372 13,560 0Hill-Rom Holdings Inc 800 29,940 22,800 0Hillshire Brands Co 1,600 46,078 45,024 0Hittite Microwave Corp 300 14,782 18,615 0HJ Heinz Co 5,292 258,891 305,295 0.02HMS Holdings Corp 9,600 219,611 248,736 0.01HNI Corp 700 16,184 21,028 0Hologic Inc 5,750 89,809 115,173 0.01Home BancShares Inc/AR 700 15,762 23,107 0Home Depot Inc/The 34,673 1,350,641 2,144,525 0.15Home Properties Inc 500 26,578 30,660 0Honeywell International Inc 9,037 443,570 573,669 0.04Horace Mann Educators Corp 800 13,324 15,944 0152
<strong>STANLIB</strong> <strong>Funds</strong> <strong>Limited</strong>Portfolio Statement (continued)<strong>STANLIB</strong> Multi-Manager Global Equity Fund as at 31 December <strong>2012</strong> (continued)Common Stock continuedNominal holding Cost Market Value % of Net AssetsUSDUSDUnited States (continued)Hornbeck Offshore Services Inc 700 18,067 24,017 0Hospitality Properties Trust 1,200 28,203 28,080 0Host Hotels & Resorts Inc 12,839 199,759 201,187 0.01HSN Inc 200 5,502 11,016 0Hub Group Inc 6,600 210,474 221,694 0.01Hubbell Inc 400 23,882 33,860 0Humana Inc 2,161 175,530 148,309 0.01Huntington Bancshares Inc/OH 153,680 883,098 982,015 0.08Huntington Ingalls Industries Inc 475 19,666 20,577 0Huntsman Corp 2,400 23,661 38,136 0Huron Consulting Group Inc 600 12,009 20,202 0Hyster -Yale Materials 'B' 100 0 – –Hyster-Yale Materials Handling Inc 100 4,950 4,881 0IAC/InterActiveCorp 900 35,588 42,570 0Iberiabank Corp 300 16,095 14,733 0Iconix Brand Group Inc 800 13,312 17,856 0ICU Medical Inc 300 10,967 18,243 0IDACORP Inc 400 14,745 17,344 0IDEX Corp 3,300 139,213 153,549 0.01IDEXX Laboratories Inc 600 37,097 55,668 0II-VI Inc 800 14,346 14,608 0Illinois Tool Works Inc 5,824 282,356 354,216 0.02Illumina Inc 2,349 94,179 130,581 0.01Impax Laboratories Inc 8,200 187,827 167,936 0.01Incyte Corp Ltd 1,400 20,563 23,254 0Independent Bank Corp/Rockland MA 600 13,359 17,334 0Infinera Corp 1,400 12,537 8,120 0Infinity Property & Casualty Corp 300 14,394 17,457 0Informatica Corp 1,300 42,238 39,403 0Ingram Micro Inc 1,800 31,423 30,474 0Ingredion Inc 900 34,452 57,987 0Inland Real Estate Corp 2,200 16,122 18,414 0Innophos Holdings Inc 200 5,968 9,300 0Insight Enterprises Inc 900 13,397 15,615 0Insulet Corp 900 13,563 19,098 0Integra LifeSciences Holdings Corp 400 14,668 15,568 0Integrated Device Technology Inc 2,800 15,600 20,440 0Intel Corp 57,032 1,219,432 1,176,570 0.09Interactive Brokers Group Inc 32,600 539,348 445,642 0.03InterDigital Inc/PA 700 27,751 28,770 0Interface Inc 1,000 13,385 16,070 0Intermec Inc 2,000 15,985 19,700 0153
<strong>STANLIB</strong> <strong>Funds</strong> <strong>Limited</strong>Portfolio Statement (continued)<strong>STANLIB</strong> Multi-Manager Global Equity Fund as at 31 December <strong>2012</strong> (continued)Common Stock continuedNominal holding Cost Market Value % of Net AssetsUSDUSDUnited States (continued)InterMune Inc 700 7,119 6,783 0International Bancshares Corp 800 13,764 14,440 0International Business Machines Corp 13,660 2,126,806 2,616,846 0.19International Flavors & Fragrances Inc 2,196 110,757 146,122 0.01International Game Technology 7,053 111,087 99,941 0.01International Paper Co 6,844 173,466 272,665 0.02International Rectifier Corp 200 4,252 3,546 0International Speedway Corp 500 13,083 13,810 0Interpublic Group of Cos Inc/The 22,442 185,180 247,535 0.02Intersil Corp 1,500 16,736 12,420 0Interval Leisure Group Inc 25,500 471,885 493,935 0.03Intrepid Potash Inc 600 14,394 12,774 0Intuit Inc 4,435 204,671 263,838 0.02Intuitive Surgical Inc 586 216,524 287,169 0.02Invacare Corp 500 12,723 8,135 0Invesco Mortgage Capital Inc 2,800 58,782 55,160 0Investment Technology Group Inc 12,100 141,026 108,779 0.01Investors Bancorp Inc 1,000 12,435 17,760 0Investors Real Estate Trust 1,600 12,356 13,968 0ION Geophysical Corp 2,900 12,572 18,850 0IPC The Hospitalist Co Inc 500 12,880 19,805 0IPG Photonics Corp 300 18,465 19,986 0Iron Mountain Inc 7,017 183,866 217,738 0.01Isis Pharmaceuticals Inc 1,500 12,060 15,675 0ITC Holdings Corp 600 39,714 46,146 0Itron Inc 400 24,544 17,820 0ITT Educational Services Inc 300 21,417 5,190 0J&J Snack Foods Corp 300 12,120 19,167 0j2 Global Inc 900 26,443 27,522 0Jabil Circuit Inc 15,400 280,832 296,912 0.02Jack Henry & Associates Inc 900 23,441 35,343 0Jack in the Box Inc 600 11,754 17,148 0Jacobs Engineering Group Inc 3,370 124,697 143,461 0.01JAKKS Pacific Inc 900 13,874 11,268 0Jarden Corp 600 16,671 31,032 0JB Hunt Transport Services Inc 2,200 90,205 131,252 0.01JC Penney Co Inc 3,280 68,913 64,682 0JDS Uniphase Corp 3,400 41,264 45,968 0John Bean Technologies Corp 1,000 15,260 17,770 0John Wiley & Sons Inc 500 19,583 19,495 0Johnson & Johnson 238,674 15,522,810 16,731,046 1.13Johnson Controls Inc 8,878 282,174 272,288 0.02154
<strong>STANLIB</strong> <strong>Funds</strong> <strong>Limited</strong>Portfolio Statement (continued)<strong>STANLIB</strong> Multi-Manager Global Equity Fund as at 31 December <strong>2012</strong> (continued)Common Stock continuedNominal holding Cost Market Value % of Net AssetsUSDUSDUnited States (continued)Jones Group Inc/The 1,300 16,666 14,378 0Jones Lang LaSalle Inc 600 47,320 50,370 0Jos A Bank Clothiers Inc 300 13,429 12,771 0Joy Global Inc 2,152 145,545 137,255 0.01JPMorgan Chase & Co 72,724 2,952,767 3,199,129 0.23Juniper Networks Inc 99,414 1,905,771 1,956,468 0.14K12 Inc 14,837 356,607 303,120 0.02Kaiser Aluminum Corp 3,000 143,235 185,040 0.01Kaman Corp 600 14,208 22,080 0Kansas City Southern 26,084 485,490 2,177,492 0.16Kaydon Corp 400 14,544 9,572 0KB Home 14,160 289,100 223,728 0.02Kelly Services Inc 800 11,296 12,592 0Kemper Corp 500 12,763 14,730 0Kennametal Inc 700 24,533 28,021 0Key Energy Services Inc 1,700 16,791 11,798 0Kilroy Realty Corp 700 22,299 33,173 0Kimberly-Clark Corp 4,777 332,940 403,179 0.03Kimco Realty Corp 8,326 131,795 160,858 0.01Kinder Morgan Inc/Delaware 9,000 307,350 317,970 0.02Kinder Morgan Management LLC 4,855 257,496 366,261 0.02Kindred Healthcare Inc 1,482 19,186 16,020 0Kirby Corp 5,400 258,709 333,666 0.02KLA-Tencor Corp 32,791 1,641,016 1,566,098 0.12Knight Capital Group Inc 900 13,001 3,150 0Knight Transportation Inc 600 12,108 8,778 0Knoll Inc 900 12,933 13,824 0Kohl's Corp 3,211 157,686 138,009 0.01Koppers Holdings Inc 500 12,058 19,060 0Korn/Ferry International 900 13,950 14,265 0Kraft Foods Group Inc 6,732 168,052 305,969 0.02Kraton Performance Polymers Inc 4,500 114,331 108,045 0.01Kroger Co/The 46,233 1,088,960 1,202,983 0.09Laclede Group Inc/The 400 14,902 15,448 0Lam Research Corp 3,204 136,941 115,728 0.01Lamar Advertising Co 500 16,577 19,380 0Lancaster Colony Corp 200 9,920 13,826 0Landauer Inc 300 16,223 18,336 0Landstar System Inc 300 11,908 15,729 0Las Vegas Sands Corp 5,314 253,710 245,241 0.02LaSalle Hotel Properties 1,100 23,153 27,940 0Lattice Semiconductor Corp 2,400 11,988 9,576 0155
<strong>STANLIB</strong> <strong>Funds</strong> <strong>Limited</strong>Portfolio Statement (continued)<strong>STANLIB</strong> Multi-Manager Global Equity Fund as at 31 December <strong>2012</strong> (continued)Common Stock continuedNominal holding Cost Market Value % of Net AssetsUSDUSDUnited States (continued)Layne Christensen Co 500 12,473 12,120 0Leap Wireless International Inc 1,100 11,083 7,315 0Lear Corp 1,300 60,539 60,892 0Legg Mason Inc 49,450 1,071,649 1,271,360 0.1Lender Processing Services Inc 600 16,859 14,760 0Lennox International Inc 700 32,369 36,764 0Leucadia National Corp 4,919 122,429 116,974 0.01Level 3 Communications Inc 20,522 527,591 474,058 0.03Lexington Realty Trust 2,100 14,291 21,924 0Lexmark International Inc 300 11,220 6,960 0Liberty Global Inc 92,466 2,061,273 5,666,933 0.4Liberty Interactive Corp 37,584 537,705 739,653 0.05Liberty Media Corp 7,303 143,832 846,856 0.07Liberty Ventures 1,873 64,944 126,971 0.01Life Time Fitness Inc 4,800 207,766 236,160 0.02LifePoint Hospitals Inc 500 16,380 18,870 0Lincoln Electric Holdings Inc 800 23,569 38,944 0Lincoln National Corp 5,023 133,663 130,045 0.01Littelfuse Inc 400 16,064 24,628 0Live Nation Entertainment Inc 8,178 80,177 76,137 0.01LivePerson Inc 5,300 89,748 69,536 0Lockheed Martin Corp 69,752 5,473,874 6,439,505 0.44Loral Space & Communications Inc 300 10,219 16,356 0Lorillard Inc 1,934 214,526 225,601 0.02Louisiana-Pacific Corp 2,300 31,560 44,413 0Lowe's Cos Inc 15,855 332,285 563,170 0.04LSI Corp 116,484 765,957 824,707 0.07LTC Properties Inc 1,000 27,783 35,150 0Lufkin Industries Inc 400 20,967 23,252 0Lululemon Athletica Inc 7,200 480,632 548,784 0.04Lumber Liquidators Holdings Inc 600 13,719 31,698 0Luminex Corp 800 12,820 13,408 0Lumos Networks Corp 150 2,000 1,499 0M&T Bank Corp 5,178 423,774 509,774 0.03Macerich Co/The 3,791 180,381 220,902 0.01Mack-Cali Realty Corp 800 26,284 20,896 0Macy's Inc 7,067 166,814 275,754 0.02Madison Square Garden Co/The 600 14,729 26,604 0Magellan Health Services Inc 400 17,774 19,596 0Manhattan Associates Inc 600 18,611 36,204 0Manitowoc Co Inc/The 1,900 16,812 29,792 0ManTech International Corp/VA 400 14,180 10,372 0156
<strong>STANLIB</strong> <strong>Funds</strong> <strong>Limited</strong>Portfolio Statement (continued)<strong>STANLIB</strong> Multi-Manager Global Equity Fund as at 31 December <strong>2012</strong> (continued)Common Stock continuedNominal holding Cost Market Value % of Net AssetsUSDUSDUnited States (continued)Marathon Oil Corp 10,070 234,739 308,646 0.02Marathon Petroleum Corp 4,365 136,530 274,951 0.02Markel Corp 100 41,415 43,343 0Marriott International Inc/DE 5,374 181,390 200,289 0.01Marsh & McLennan Cos Inc 114,900 3,411,345 3,959,454 0.28Martin Marietta Materials Inc 1,690 138,127 159,333 0.01Masco Corp 8,860 90,694 147,696 0.01Masimo Corp 600 14,517 12,600 0MasTec Inc 1,200 12,408 29,904 0Mastercard Inc 7,615 3,077,781 3,743,839 0.26Materion Corp 500 12,267 12,865 0Matson Inc 600 11,949 14,808 0Matthews International Corp 400 14,040 12,832 0Maxim Integrated Products Inc 6,577 123,863 193,298 0.01MAXIMUS Inc 400 11,787 25,276 0MB Financial Inc 800 13,940 15,792 0MBIA Inc 103,141 1,235,581 809,657 0.06McCormick & Co Inc/MD 4,221 171,717 268,034 0.02McDonald's Corp 11,896 978,624 1,049,703 0.08McGrath RentCorp 900 21,259 26,109 0McGraw-Hill Cos Inc/The 65,961 3,313,968 3,606,088 0.26McKesson Corp 32,473 2,858,254 3,148,907 0.22McMoRan Exploration Co 1,300 14,105 20,852 0MDC Holdings Inc 400 11,094 14,700 0Mead Johnson Nutrition Co 22,040 1,727,644 1,452,216 0.11MeadWestvaco Corp 5,288 111,276 168,529 0.01MedAssets Inc 1,100 13,845 18,425 0Medical Properties Trust Inc 1,800 17,231 21,528 0Medivation Inc 7,600 276,895 388,892 0.03MEDNAX Inc 3,700 223,200 294,224 0.02Medtronic Inc 11,314 422,539 464,100 0.03Men's Wearhouse Inc/The 700 13,132 21,805 0Mentor Graphics Corp 1,400 13,622 23,800 0MercadoLibre Inc 500 32,019 39,405 0Merck & Co Inc 37,154 1,281,833 1,521,456 0.11Mercury General Corp 8,836 440,999 350,701 0.02Meredith Corp 400 13,150 13,780 0Meridian Bioscience Inc 700 13,776 14,161 0Merit Medical Systems Inc 1,000 13,476 13,880 0Meritage Homes Corp 700 12,457 26,131 0Meritor Inc 2,600 28,509 12,298 0Methode Electronics Inc 1,700 15,210 17,017 0157
<strong>STANLIB</strong> <strong>Funds</strong> <strong>Limited</strong>Portfolio Statement (continued)<strong>STANLIB</strong> Multi-Manager Global Equity Fund as at 31 December <strong>2012</strong> (continued)Common Stock continuedNominal holding Cost Market Value % of Net AssetsUSDUSDUnited States (continued)MetLife Inc 9,414 389,257 310,003 0.02Mettler-Toledo International Inc 400 49,421 77,208 0.01MFA Financial Inc 2,900 20,371 23,490 0MGE Energy Inc 300 11,268 15,249 0MGIC Investment Corp 78,412 907,840 209,360 0.01MGM Resorts International 67,564 817,622 786,445 0.05Micrel Inc 1,300 12,578 12,337 0Microchip Technology Inc 3,114 98,096 101,454 0.01Micron Technology Inc 20,630 163,726 130,588 0.01MICROS Systems Inc 1,000 41,056 42,420 0Microsemi Corp 500 8,870 10,515 0Microsoft Corp 543,482 15,464,954 14,521,838 0.99MicroStrategy Inc 200 15,245 18,664 0Mid-America Apartment Communities Inc 500 29,823 32,365 0Middleby Corp 200 13,352 25,608 0Mine Safety Appliances Co 400 11,994 17,072 0Minerals Technologies Inc 200 6,030 7,982 0MKS Instruments Inc 300 7,367 7,725 0Mobile Mini Inc 1,000 16,588 20,830 0Modine Manufacturing Co 2,600 23,979 21,138 0Mohawk Industries Inc 718 16,820 64,922 0Molex Inc 900 20,180 20,061 0Molycorp Inc 800 36,145 7,560 0Momenta Pharmaceuticals Inc 600 10,194 7,068 0Mondelez International Inc 20,196 482,267 514,594 0.03Monolithic Power Systems Inc 9,000 165,917 200,430 0.01Monro Muffler Brake Inc 450 11,993 15,710 0Monsanto Co 67,907 5,129,081 6,427,398 0.45Monster Worldwide Inc 700 7,321 3,927 0Moody's Corp 8,839 261,628 444,778 0.03Moog Inc 400 13,630 16,412 0Morgan Stanley 16,739 445,121 320,050 0.02Morningstar Inc 300 13,422 18,849 0Mosaic Co/The 65,588 3,725,355 3,714,248 0.26Motorola Solutions Inc 4,681 201,824 260,638 0.02MSC Industrial Direct Co Inc 500 27,871 37,700 0MSCI Inc 1,100 35,954 34,100 0MTS Systems Corp 400 11,704 20,372 0Mueller Industries Inc 100 2,528 5,003 0Mueller Water Products Inc 5,100 12,994 28,611 0Murphy Oil Corp 2,275 148,745 135,454 0.01MWI Veterinary Supply Inc 100 5,043 10,996 0158
<strong>STANLIB</strong> <strong>Funds</strong> <strong>Limited</strong>Portfolio Statement (continued)<strong>STANLIB</strong> Multi-Manager Global Equity Fund as at 31 December <strong>2012</strong> (continued)Common Stock continuedNominal holding Cost Market Value % of Net AssetsUSDUSDUnited States (continued)Mylan Inc/PA 7,866 152,532 216,079 0.01Myriad Genetics Inc 900 17,229 24,525 0NACCO Industries Inc 100 4,777 6,049 0Nash Finch Co 300 12,213 6,384 0National CineMedia Inc 700 11,128 9,884 0National Financial Partners Corp 1,300 14,229 22,256 0National Fuel Gas Co 900 45,499 45,621 0National Health Investors Inc 300 11,763 16,947 0National Instruments Corp 1,200 27,108 30,960 0National Oilwell Varco Inc 5,457 308,059 373,095 0.03National Penn Bancshares Inc 1,900 12,265 17,689 0National Presto Industries Inc 100 10,227 6,898 0National Retail Properties Inc 900 23,256 28,071 0Nationstar Mortgage Holdings Inc 5,700 196,173 176,529 0.01Natus Medical Inc 700 8,280 7,819 0Navigant Consulting Inc 1,400 14,721 15,610 0Navigators Group Inc/The 300 13,016 15,276 0Navistar International Corp 700 32,285 15,218 0NBT Bancorp Inc 600 13,038 12,162 0NCR Corp 1,900 30,783 48,412 0Neogen Corp 500 14,123 22,635 0NetApp Inc 5,057 209,719 169,662 0.01Netflix Inc 1,221 159,852 113,211 0.01NETGEAR Inc 8,800 268,854 346,720 0.02Netscout Systems Inc 800 13,120 20,776 0NeuStar Inc 700 21,366 29,344 0New Jersey Resources Corp 400 15,346 15,840 0New York Times Co/The 2,400 17,585 20,448 0Newell Rubbermaid Inc 121,120 2,509,396 2,697,342 0.19Newfield Exploration Co 4,229 223,948 113,253 0.01NewMarket Corp 100 15,171 26,220 0Newmont Mining Corp 6,712 398,856 311,705 0.02Newpark Resources Inc 1,600 13,144 12,544 0Newport Corp 1,000 11,865 13,420 0News Corp 20,686 291,736 528,114 0.04NextEra Energy Inc 5,519 310,056 381,749 0.03NIC Inc 2,100 19,515 34,314 0NII Holdings Inc 22,945 1,058,965 163,598 0.01NIKE Inc 71,640 3,465,777 3,696,624 0.26NiSource Inc 9,775 169,803 243,202 0.02Noble Energy Inc 16,035 1,443,386 1,631,401 0.12Nordson Corp 600 22,631 37,872 0159
<strong>STANLIB</strong> <strong>Funds</strong> <strong>Limited</strong>Portfolio Statement (continued)<strong>STANLIB</strong> Multi-Manager Global Equity Fund as at 31 December <strong>2012</strong> (continued)Common Stock continuedNominal holding Cost Market Value % of Net AssetsUSDUSDUnited States (continued)Norfolk Southern Corp 9,478 624,775 585,930 0.04Northeast Utilities 6,182 186,944 241,531 0.02Northern Oil and Gas Inc 900 22,523 15,120 0Northern Trust Corp 103,000 4,651,463 5,165,450 0.36Northrop Grumman Corp 6,384 394,471 431,431 0.03NorthStar Realty Finance Corp 23,700 153,921 166,848 0.01Northwest Bancshares Inc 1,100 12,529 13,343 0Northwest Natural Gas Co 400 18,554 17,680 0NorthWestern Corp 600 18,680 20,820 0NRG Energy Inc 7,072 158,006 162,515 0.01NTELOS Holdings Corp 550 12,022 7,205 0Nu Skin Enterprises Inc 700 23,617 25,928 0Nuance Communications Inc 58,600 1,312,618 1,307,366 0.1Nucor Corp 35,110 1,471,574 1,515,348 0.11Nutrisystem Inc 600 11,346 4,908 0NuVasive Inc 400 8,583 6,176 0NV Energy Inc 2,500 32,413 45,325 0NVIDIA Corp 105,343 1,445,981 1,294,665 0.1Oasis Petroleum Inc 600 15,840 19,086 0Occidental Petroleum Corp 8,655 746,648 663,060 0.04Oceaneering International Inc 5,400 281,506 290,466 0.02Ocwen Financial Corp 1,300 12,422 44,954 0Office Depot Inc 12,251 41,210 40,183 0OfficeMax Inc 900 10,944 8,784 0Ogk-2 994,200 42,648 11,135 0Oil States International Inc 2,200 153,881 157,388 0.01Old Dominion Freight Line Inc 600 10,892 20,562 0Old National Bancorp/IN 1,200 12,792 14,244 0Old Republic International Corp 1,900 16,413 20,235 0Olin Corp 400 8,440 8,640 0OM Group Inc 500 14,108 11,105 0Omega Healthcare Investors Inc 1,200 22,428 28,620 0Omnicell Inc 1,100 13,503 16,357 0Omnicom Group Inc 5,318 222,629 265,740 0.02OmniVision Technologies Inc 600 12,123 8,442 0ON Semiconductor Corp 4,900 32,904 34,545 0ONEOK Inc 5,248 132,118 224,300 0.02Onyx Pharmaceuticals Inc 5,000 199,547 377,650 0.03OpenTable Inc 300 20,721 14,637 0Oracle Corp 262,805 7,616,076 8,756,663 0.6Orbital Sciences Corp 900 12,641 12,384 0Oritani Financial Corp 1,300 12,877 19,903 0160
<strong>STANLIB</strong> <strong>Funds</strong> <strong>Limited</strong>Portfolio Statement (continued)<strong>STANLIB</strong> Multi-Manager Global Equity Fund as at 31 December <strong>2012</strong> (continued)Common Stock continuedNominal holding Cost Market Value % of Net AssetsUSDUSDUnited States (continued)Oshkosh Corp 1,000 29,920 29,630 0OSI Systems Inc 500 14,025 32,020 0Otter Tail Corp 600 11,916 14,988 0Owens & Minor Inc 300 8,456 8,547 0Owens Corning 5,900 187,075 218,182 0.01Owens-Illinois Inc 5,678 138,771 120,658 0.01PACCAR Inc 3,601 162,360 162,729 0.01Packaging Corp of America 800 23,424 30,776 0PacWest Bancorp 1,000 16,994 24,760 0Pall Corp 3,164 119,947 190,599 0.01Panera Bread Co 300 33,509 47,649 0Papa John's International Inc 100 2,414 5,495 0Parametric Technology Corp 12,300 250,152 276,627 0.02PAREXEL International Corp 700 14,810 20,699 0Park Electrochemical Corp 800 19,364 20,560 0Park National Corp 200 13,093 12,896 0Parker Drilling Co 3,000 12,630 13,770 0Parker Hannifin Corp 2,588 222,191 220,161 0.01Patterson-UTI Energy Inc 1,700 41,924 31,671 0PDC Energy Inc 400 11,476 13,276 0PDL BioPharma Inc 2,000 12,630 14,080 0Peabody Energy Corp 4,812 220,568 128,095 0.01Penn National Gaming Inc 700 22,287 34,377 0Penn Virginia Corp 2,900 29,023 12,760 0Penske Automotive Group Inc 1,000 13,745 30,080 0People's United Financial Inc 11,788 159,532 142,517 0.01Pep Boys-Manny Moe & Jack/The 1,300 12,441 12,753 0PepsiCo Inc 106,631 6,952,106 7,297,826 0.5PerkinElmer Inc 1,100 25,120 34,914 0Perrigo Co 1,844 116,814 191,758 0.01PetSmart Inc 2,504 81,066 171,148 0.01Pfizer Inc 86,839 1,511,570 2,178,791 0.16PH Glatfelter Co 1,100 13,371 19,228 0Pharmacyclics Inc 600 39,793 34,716 0PharMerica Corp 1,000 8,155 14,200 0PHH Corp 700 15,197 15,932 0Philip Morris International Inc 147,650 9,292,838 12,350,922 0.84Phillips 66 7,564 221,350 401,573 0.03PICO Holdings Inc 900 22,811 18,234 0Piedmont Natural Gas Co Inc 900 25,781 28,152 0Piedmont Office Realty Trust Inc 1,300 26,700 23,478 0Pier 1 Imports Inc 1,800 12,474 35,964 0161
<strong>STANLIB</strong> <strong>Funds</strong> <strong>Limited</strong>Portfolio Statement (continued)<strong>STANLIB</strong> Multi-Manager Global Equity Fund as at 31 December <strong>2012</strong> (continued)Common Stock continuedNominal holding Cost Market Value % of Net AssetsUSDUSDUnited States (continued)Pinnacle Entertainment Inc 1,200 13,056 18,996 0Pinnacle Financial Partners Inc 1,200 12,252 22,596 0Pinnacle West Capital Corp 4,215 169,085 214,796 0.01Pitney Bowes Inc 11,675 314,954 124,222 0.01Plantronics Inc 600 18,781 22,110 0Plexus Corp 500 13,687 12,895 0Plum Creek Timber Co Inc 4,350 165,975 192,879 0.01PMC - Sierra Inc 2,400 19,524 12,504 0PNC Financial Services Group Inc 6,002 351,602 349,977 0.02PNM Resources Inc 1,200 17,297 24,612 0Polycom Inc 2,600 42,224 27,196 0PolyOne Corp 1,600 17,333 32,640 0Polypore International Inc 500 14,478 23,250 0Pool Corp 600 15,190 25,368 0Portfolio Recovery Associates Inc 300 20,436 31,968 0Portland General Electric Co 800 16,200 21,888 0Post Properties Inc 6,500 289,991 324,610 0.02Potlatch Corp 400 14,690 15,672 0Power Integrations Inc 400 13,186 13,440 0Power-One Inc 1,700 18,617 6,970 0PPL Corp 7,407 198,090 211,988 0.01Praxair Inc 29,206 3,121,154 3,194,844 0.23Precision Castparts Corp 1,936 279,486 366,582 0.02Priceline.com Inc 3,366 401,888 2,090,724 0.15Pricesmart Inc 1,217 74,136 93,721 0.01Principal Financial Group Inc 7,584 210,537 216,296 0.01PrivateBancorp Inc 1,100 13,574 16,852 0ProAssurance Corp 600 17,091 25,320 0Procter & Gamble Co/The 29,881 1,862,302 2,029,219 0.15Progress Software Corp 4,000 88,639 83,960 0.01Progressive Corp/The 13,200 265,812 278,520 0.02Prologis Inc 6,408 177,930 233,828 0.02Prosperity Bancshares Inc 400 13,614 16,804 0Protective Life Corp 400 10,799 11,432 0Provident Financial Services Inc 1,400 16,575 20,874 0Prudential Financial Inc 6,146 359,884 327,705 0.02PS Business Parks Inc 200 11,953 12,996 0PSS World Medical Inc 700 13,591 20,209 0Public Service Enterprise Group Inc 6,588 212,099 201,527 0.01Public Storage 2,522 299,340 365,614 0.02PulteGroup Inc 86,023 871,138 1,562,178 0.12QLogic Corp 1,100 17,441 10,703 0162
<strong>STANLIB</strong> <strong>Funds</strong> <strong>Limited</strong>Portfolio Statement (continued)<strong>STANLIB</strong> Multi-Manager Global Equity Fund as at 31 December <strong>2012</strong> (continued)Common Stock continuedNominal holding Cost Market Value % of Net AssetsUSDUSDUnited States (continued)QUALCOMM Inc 19,718 933,403 1,222,910 0.09Quality Systems Inc 400 11,014 6,940 0Quanta Services Inc 4,675 91,552 127,534 0.01Quest Diagnostics Inc 64,000 3,541,133 3,728,000 0.26Questar Corp 1,900 35,607 37,544 0Questcor Pharmaceuticals Inc 800 9,004 21,360 0Quicksilver Resources Inc 1,000 12,690 2,860 0Quiksilver Inc 2,900 12,688 12,325 0Rackspace Hosting Inc 1,100 62,002 81,697 0.01Radian Group Inc 4,900 24,013 29,939 0RAIT Financial Trust 29,000 163,699 163,850 0.01Ralph Lauren Corp 1,179 126,478 176,732 0.01Rambus Inc 1,300 24,349 6,331 0Range Resources Corp 2,712 117,915 170,395 0.01Raven Industries Inc 400 6,909 10,536 0Raymond James Financial Inc 1,200 33,492 46,224 0Raytheon Co 13,368 600,589 769,462 0.05RBC Bearings Inc 400 12,988 20,028 0Red Hat Inc 3,123 114,675 165,363 0.01Redwood Trust Inc 25,800 373,458 435,504 0.03Regal Entertainment Group 12,200 167,417 170,190 0.01Regal-Beloit Corp 4,400 291,139 310,156 0.02Regions Financial Corp 110,036 694,201 783,456 0.05Regis Corp 900 16,376 15,219 0Reinsurance Group of America Inc 6,200 342,657 331,824 0.02Reliance Steel & Aluminum Co 600 28,132 37,248 0Renasant Corp 700 9,305 13,279 0Rent-A-Center Inc/TX 400 12,036 13,740 0Republic Bancorp Inc/KY 500 10,515 10,560 0Republic Services Inc 5,795 180,302 170,025 0.01Resolute Forest Products 8,520 207,709 112,720 0.01Resources Connection Inc 1,000 12,585 11,940 0Responsys Inc 14,500 174,249 86,275 0.01RF Micro Devices Inc 3,400 18,734 15,198 0Rite Aid Corp 13,800 13,869 18,768 0Riverbed Technology Inc 2,000 47,861 39,420 0RLI Corp 300 16,149 19,371 0Robbins & Myers Inc 600 14,844 35,676 0Rock Tenn Co 4,500 289,101 314,505 0.02Rockwood Holdings Inc 4,600 225,875 227,470 0.02Rofin-Sinar Technologies Inc 600 14,241 13,008 0Rogers Corp 400 14,352 19,868 0163
<strong>STANLIB</strong> <strong>Funds</strong> <strong>Limited</strong>Portfolio Statement (continued)<strong>STANLIB</strong> Multi-Manager Global Equity Fund as at 31 December <strong>2012</strong> (continued)Common Stock continuedNominal holding Cost Market Value % of Net AssetsUSDUSDUnited States (continued)Rollins Inc 900 12,930 19,854 0Roper Industries Inc 2,828 192,408 315,096 0.02Rosetta Resources Inc 700 20,096 31,745 0Rovi Corp 1,300 60,332 20,059 0Royal Gold Inc 600 38,700 48,786 0RPC Inc 600 4,855 7,344 0RPM International Inc 1,000 19,259 29,370 0RR Donnelley & Sons Co 1,400 15,387 12,600 0RTI Biologics Inc 25,200 92,726 107,352 0.01RTI International Metals Inc 500 14,610 13,780 0Ruby Tuesday Inc 1,300 13,247 10,218 0Ryder System Inc 500 25,810 24,965 0Ryland Group Inc/The 800 13,740 29,192 0Ryman Hospitality Properties 6,179 240,098 237,459 0.02S&T Bancorp Inc 800 14,721 14,424 0Sabra Health Care REIT Inc 766 12,885 16,630 0Safety Insurance Group Inc 400 16,173 18,432 0Saks Inc 1,600 13,640 16,800 0Salesforce.com Inc 1,760 201,947 295,698 0.02Salix Pharmaceuticals Ltd 700 25,973 28,329 0Sally Beauty Holdings Inc 1,400 12,810 33,012 0Sanderson Farms Inc 300 12,657 14,262 0SanDisk Corp 2,789 130,789 121,433 0.01SandRidge Energy Inc 4,600 24,824 29,164 0Sandy Spring Bancorp Inc 1,100 17,877 21,274 0Sanmina Corp 1,000 11,910 11,060 0Sapient Corp 45,598 586,372 481,515 0.03Saul Centers Inc 300 12,977 12,819 0SBA Communications Corp 2,900 148,059 205,929 0.01SCANA Corp 4,332 174,667 197,756 0.01ScanSource Inc 500 15,620 15,880 0Schnitzer Steel Industries Inc 300 14,313 9,099 0Scholastic Corp 500 12,703 14,760 0Schweitzer-Mauduit International Inc 400 9,678 15,608 0Scientific Games Corp 1,200 13,494 10,404 0Scotts Miracle-Gro Co/The 13,693 466,735 603,177 0.04Scripps Networks Interactive Inc 2,575 117,173 149,144 0.01Seaboard Corp 8 12,869 20,200 0SEACOR Holdings Inc 100 8,756 8,376 0Seattle Genetics Inc 33,500 655,006 776,865 0.05Selective Insurance Group Inc 1,200 17,381 23,112 0Semtech Corp 900 18,384 26,046 0164
<strong>STANLIB</strong> <strong>Funds</strong> <strong>Limited</strong>Portfolio Statement (continued)<strong>STANLIB</strong> Multi-Manager Global Equity Fund as at 31 December <strong>2012</strong> (continued)Common Stock continuedNominal holding Cost Market Value % of Net AssetsUSDUSDUnited States (continued)Senior Housing Properties Trust 1,800 42,362 42,552 0Sensient Technologies Corp 700 22,414 24,878 0Service Corp International/US 1,300 10,941 17,927 0Shaw Group IncNpv 900 30,366 41,949 0Sherwin-Williams Co/The 600 32,889 92,292 0.01SHFL Entertainment Inc 1,400 12,740 20,272 0Signature Bank/New York NY 400 16,046 28,536 0Silgan Holdings Inc 400 11,864 16,620 0Silicon Laboratories Inc 200 8,256 8,362 0Simmons First National Corp 700 17,061 17,752 0Simon Property Group Inc 4,475 504,366 707,453 0.05Simpson Manufacturing Co Inc 500 12,258 16,395 0Sirius XM Radio Inc 75,380 177,196 218,602 0.01Sirona Dental Systems Inc 700 33,402 45,115 0Six Flags Entertainment Corp 300 16,586 18,354 0Skechers U.S.A. Inc 400 11,976 7,400 0SkyWest Inc 1,000 13,475 12,450 0Skyworks Solutions Inc 2,400 46,667 48,696 0SL Green Realty Corp 27,394 904,686 2,099,750 0.15SLM Corp 9,687 127,670 166,035 0.01SM Energy Co 900 49,321 46,980 0Smithfield Foods Inc 1,000 21,982 21,560 0Snap-on Inc 800 52,872 63,192 0Snyders-Lance Inc 600 13,197 14,460 0SolarWinds Inc 300 16,480 15,735 0Solera Holdings Inc 2,800 123,751 149,716 0.01Sonic Corp 1,500 12,728 15,615 0Sonoco Products Co 700 23,803 20,811 0Sonus Networks Inc 4,500 14,580 7,650 0Sotheby's 22,194 348,057 745,940 0.05Sourcefire Inc 5,600 250,176 264,376 0.02South Jersey Industries Inc 4,800 249,786 241,536 0.02Southern Co/The 11,139 445,612 476,749 0.03Southern Copper Corp 2,939 95,586 111,271 0.01Southwest Gas Corp 500 17,767 21,195 0Southwestern Energy Co 4,785 172,468 159,819 0.01Sovran Self Storage Inc 700 31,682 43,442 0Spartan Stores Inc 900 12,600 13,797 0Spectra Energy Corp 10,728 249,543 293,625 0.02Spirit Aerosystems Holdings Inc 1,400 29,353 23,744 0Sprint Nextel Corp 39,385 178,648 222,919 0.02St Jude Medical Inc 4,626 182,589 167,230 0.01165
<strong>STANLIB</strong> <strong>Funds</strong> <strong>Limited</strong>Portfolio Statement (continued)<strong>STANLIB</strong> Multi-Manager Global Equity Fund as at 31 December <strong>2012</strong> (continued)Common Stock continuedNominal holding Cost Market Value % of Net AssetsUSDUSDUnited States (continued)StanCorp Financial Group Inc 6,400 211,291 234,496 0.02Standard Pacific Corp 19,632 67,151 144,295 0.01Staples Inc 8,170 166,254 93,056 0.01Starbucks Corp 20,347 818,509 1,091,413 0.08Starwood Hotels & Resorts Worldwide Inc 3,907 197,859 224,066 0.02Starwood Property Trust Inc 1,600 34,915 36,752 0STEC Inc 800 11,188 3,944 0Steel Dynamics Inc 1,700 26,050 23,341 0Stepan Co 400 12,332 22,216 0Stericycle Inc 2,211 154,568 206,154 0.01STERIS Corp 300 10,245 10,419 0Steven Madden Ltd 600 15,334 25,356 0Stewart Enterprises Inc 2,500 13,413 19,075 0Stifel Financial Corp 600 17,854 19,170 0Stillwater Mining Co 2,100 30,733 26,838 0Stone Energy Corp 1,100 14,889 22,550 0Strayer Education Inc 200 37,175 11,218 0Stryker Corp 59,901 3,202,407 3,283,174 0.23Sun Communities Inc 400 11,480 15,948 0SunPower Corp 480 5,862 2,702 0Sunstone Hotel Investors Inc 2,000 12,777 21,400 0Sun-Times Media Group Inc 'A' 23,145 337,374 14 0SunTrust Banks Inc 7,633 207,561 216,319 0.01Superior Energy Services Inc 3,700 92,846 76,701 0.01Superior Industries International Inc 900 13,032 18,342 0SUPERVALU Inc 1,777 27,494 4,371 0Susquehanna Bancshares Inc 3,200 28,748 33,504 0SVB Financial Group 500 21,223 27,985 0Swift Energy Co 900 30,259 13,851 0Sykes Enterprises Inc 800 9,852 12,168 0Symantec Corp 12,109 156,024 227,891 0.02Synaptics Inc 400 11,658 11,992 0Synovus Financial Corp 190,700 471,657 465,308 0.03Syntel Inc 300 12,438 16,071 0Sysco Corp 7,104 215,493 224,913 0.02T Rowe Price Group Inc 4,310 234,315 280,667 0.02Take-Two Interactive Software Inc 1,200 11,628 13,188 0TAL International Group Inc 500 12,830 18,175 0Tanger Factory Outlet Centers 1,300 34,521 44,434 0Target Corp 7,399 386,304 437,725 0.03Taubman Centers Inc 700 38,480 55,083 0TCF Financial Corp 14,300 176,860 173,602 0.01166
<strong>STANLIB</strong> <strong>Funds</strong> <strong>Limited</strong>Portfolio Statement (continued)<strong>STANLIB</strong> Multi-Manager Global Equity Fund as at 31 December <strong>2012</strong> (continued)Common Stock continuedNominal holding Cost Market Value % of Net AssetsUSDUSDUnited States (continued)TD Ameritrade Holding Corp 8,608 151,783 144,786 0.01Tech Data Corp 500 19,760 22,755 0Techne Corp 400 25,572 27,312 0TECO Energy Inc 2,100 38,494 35,196 0Teledyne Technologies Inc 100 4,999 6,508 0Teleflex Inc 200 10,805 14,256 0Telephone & Data Systems Inc 1,500 32,838 33,195 0TeleTech Holdings Inc 900 12,605 16,020 0Tellabs Inc 4,300 31,820 9,804 0Tempur-Pedic International Inc 800 26,616 25,192 0Tenet Healthcare Corp 425 7,549 13,791 0Tennant Co 400 13,834 17,560 0Tenneco Inc 6,000 207,897 210,660 0.01Teradata Corp 2,859 107,682 176,858 0.01Teradyne Inc 1,300 17,257 21,957 0Terex Corp 1,800 45,739 50,562 0Tesoro Corp 1,100 28,962 48,455 0Tessera Technologies Inc 900 13,087 14,778 0Tetra Tech Inc 600 12,156 15,864 0TETRA Technologies Inc 1,300 12,643 9,867 0Texas Capital Bancshares Inc 4,000 158,453 179,160 0.01Texas Industries Inc 400 13,206 20,396 0Texas Instruments Inc 15,117 432,036 467,871 0.03Texas Roadhouse Inc 1,000 14,025 16,790 0Textron Inc 5,354 116,016 132,619 0.01TFS Financial Corp 1,000 9,120 9,620 0Theravance Inc 1,100 19,598 24,453 0Thermo Fisher Scientific Inc 5,071 254,643 323,530 0.02Thor Industries Inc 500 13,243 18,715 0Thoratec Corp 700 25,003 26,243 0TIBCO Software Inc 2,200 34,602 48,422 0Tidewater Inc 800 38,192 35,752 0Tiffany & Co 11,989 724,223 687,569 0.05Time Warner Cable Inc 4,374 280,263 425,240 0.03Time Warner Inc 26,731 889,675 1,278,544 0.1Timken Co 900 33,858 43,047 0Titan International Inc 700 12,533 15,197 0TiVo Inc 1,500 12,968 18,465 0TJX Cos Inc 11,566 294,160 490,977 0.03TNS Inc 700 11,361 14,504 0Tootsie Roll Industries Inc 530 12,350 13,738 0Torchmark Corp 3,946 146,275 203,771 0.01167
<strong>STANLIB</strong> <strong>Funds</strong> <strong>Limited</strong>Portfolio Statement (continued)<strong>STANLIB</strong> Multi-Manager Global Equity Fund as at 31 December <strong>2012</strong> (continued)Common Stock continuedNominal holding Cost Market Value % of Net AssetsUSDUSDUnited States (continued)Toro Co/The 600 15,342 25,770 0Tower Group Inc 600 13,899 10,662 0Towers Watson & Co 16,129 606,391 906,611 0.07Travelers Cos Inc/The 4,881 258,954 350,553 0.02Tredegar Corp 800 14,036 16,328 0TreeHouse Foods Inc 5,800 337,384 302,412 0.02Trinity Industries Inc 1,000 22,950 35,820 0TripAdvisor Inc 35,250 1,306,957 1,477,328 0.11TriQuint Semiconductor Inc 1,900 14,336 9,177 0Triumph Group Inc 400 16,102 26,120 0True Religion Apparel Inc 500 10,720 12,710 0TrueBlue Inc 1,000 12,850 15,750 0TrustCo Bank Corp NY 3,200 15,865 16,864 0Trustmark Corp 600 13,023 13,470 0TTM Technologies Inc 1,300 12,578 11,947 0Tupperware Brands Corp 3,800 205,282 243,542 0.02Tutor Perini Corp 700 14,662 9,590 0tw telecom inc 1,700 31,833 43,282 0Two Harbors Investment Corp 3,300 36,039 36,531 0Tyler Technologies Inc 400 7,126 19,372 0Tyson Foods Inc 6,506 105,891 126,216 0.01UGI Corp 1,100 30,047 35,992 0UIL Holdings Corp 500 13,715 17,895 0Ultimate Software Group Inc 300 12,192 28,287 0UMB Financial Corp 300 11,036 13,131 0Umpqua Holdings Corp 1,800 19,553 21,204 0UniFirst Corp/MA 300 12,939 21,975 0Union Pacific Corp 28,514 3,047,816 3,584,780 0.25Unisys Corp 500 12,178 8,650 0Unit Corp 500 19,103 22,525 0United Bankshares Inc/WV 500 13,293 12,160 0United Fire Group Inc 800 15,336 17,440 0United Natural Foods Inc 400 14,719 21,432 0United Online Inc 2,800 15,411 15,624 0United Parcel Service Inc 8,253 582,780 608,576 0.04United Rentals Inc 1,000 13,225 45,510 0United States Cellular Corp 100 4,462 3,525 0United States Steel Corp 1,535 40,066 36,625 0United Stationers Inc 700 20,506 21,693 0United Technologies Corp 94,237 6,799,339 7,728,376 0.53United Therapeutics Corp 400 21,910 21,368 0UnitedHealth Group Inc 107,882 4,738,983 5,851,520 0.4168
<strong>STANLIB</strong> <strong>Funds</strong> <strong>Limited</strong>Portfolio Statement (continued)<strong>STANLIB</strong> Multi-Manager Global Equity Fund as at 31 December <strong>2012</strong> (continued)Common Stock continuedNominal holding Cost Market Value % of Net AssetsUSDUSDUnited States (continued)Unitil Corp 6,500 165,374 168,480 0.01Universal American Corp/NY 800 724 6,864 0Universal Corp/VA 300 11,220 14,973 0Universal Display Corp 600 13,644 15,360 0Universal Forest Products Inc 400 12,154 15,216 0Universal Health Services Inc 700 37,510 33,845 0UNS Energy Corp 5,000 203,311 212,100 0.01Urban Outfitters Inc 4,388 135,675 172,756 0.01URS Corp 1,100 41,481 43,197 0Urstadt Biddle Properties Inc 700 12,618 13,762 0US Airways Group Inc 57,754 577,806 779,679 0.05US Bancorp 109,959 3,333,149 3,512,090 0.25USANA Health Sciences Inc 300 13,109 9,882 0USG Corp 1,000 12,235 28,060 0Vail Resorts Inc 500 21,498 27,045 0Valassis Communications Inc 700 16,931 18,053 0Valero Energy Corp 104,864 2,785,936 3,575,862 0.25Valmont Industries Inc 200 13,615 27,310 0Valspar Corp 900 28,188 56,160 0Valueclick Inc 1,500 19,905 29,115 0Varian Medical Systems Inc 89,000 4,782,153 6,249,580 0.43VCA Antech Inc 210,602 4,592,839 4,433,172 0.31Vector Group Ltd 809 13,241 12,014 0Vectren Corp 800 20,744 23,504 0Veeco Instruments Inc 500 15,321 14,745 0VeriSign Inc 5,031 155,954 195,303 0.01Verizon Communications Inc 33,514 1,105,558 1,449,816 0.11Vertex Pharmaceuticals Inc 2,915 146,462 122,313 0.01Viacom Inc 43,008 2,217,174 2,268,672 0.16Viad Corp 34,521 926,724 937,590 0.07ViaSat Inc 600 21,349 23,334 0Virgin Media Inc 5,220 117,103 191,887 0.01ViroPharma Inc 1,200 15,834 27,312 0Visa Inc 13,886 1,215,143 2,103,312 0.15Vishay Intertechnology Inc 2,100 19,051 22,302 0Visteon Corp 600 29,375 32,268 0Vivus Inc 800 17,177 10,728 0VMware Inc 1,390 120,055 130,855 0.01Vocus Inc 13,200 188,150 228,624 0.02Volcano Corp 600 13,644 14,154 0Vornado Realty Trust 3,166 266,292 253,502 0.02WABCO Holdings Inc 800 33,774 52,152 0169
<strong>STANLIB</strong> <strong>Funds</strong> <strong>Limited</strong>Portfolio Statement (continued)<strong>STANLIB</strong> Multi-Manager Global Equity Fund as at 31 December <strong>2012</strong> (continued)Common Stock continuedNominal holding Cost Market Value % of Net AssetsUSDUSDUnited States (continued)Wabtec Corp/DE 600 29,704 52,482 0Waddell & Reed Financial Inc 700 17,502 24,374 0Walgreen Co 10,583 326,977 391,888 0.03Wal-Mart Stores Inc 68,390 4,634,612 4,668,301 0.32Walt Disney Co 20,011 730,601 996,148 0.08Walter Energy Inc 6,900 228,604 247,641 0.02Walter Investment Management Corp 6,100 212,594 262,178 0.02Warnaco Group Inc/The 600 29,217 42,936 0Washington Federal Inc 1,300 21,015 21,931 0Washington Real Estate Investment Trust 600 18,555 15,696 0Waste Connections Inc 650 17,198 21,964 0Waste Management Inc 7,111 246,313 239,854 0.02Waters Corp 52,000 4,141,629 4,530,240 0.32Watsco Inc 200 11,996 14,980 0Watson Pharmaceuticals Inc 2,327 105,509 200,099 0.01Watts Water Technologies Inc 400 13,352 17,196 0WD-40 Co 4,300 193,433 202,573 0.01Web.com Group Inc 8,800 136,488 130,152 0.01Websense Inc 800 14,122 12,024 0Webster Financial Corp 1,500 28,687 30,810 0Weight Watchers International Inc 400 23,724 20,936 0Weingarten Realty Investors 1,400 34,220 37,492 0WellCare Health Plans Inc 500 22,278 24,345 0WellPoint Inc 25,144 1,467,358 1,532,024 0.11Wells Fargo & Co 68,284 1,992,045 2,335,996 0.17Werner Enterprises Inc 600 13,269 13,002 0WESCO International Inc 7,600 476,418 512,316 0.03West Pharmaceutical Services Inc 400 14,018 21,888 0Westamerica Bancorporation 300 16,001 12,774 0Westar Energy Inc 1,100 28,732 31,482 0Western Alliance Bancorp 1,800 13,059 18,954 0Western Digital Corp 9,100 365,471 386,659 0.03Western Refining Inc 600 5,532 16,908 0Western Union Co/The 10,792 187,583 146,879 0.01WEX Inc 600 23,469 45,210 0Weyerhaeuser Co 33,919 691,398 943,966 0.07WGL Holdings Inc 500 18,325 19,580 0Whirlpool Corp 3,900 240,892 396,981 0.03Whole Foods Market Inc 2,591 125,737 236,610 0.02Williams Cos Inc/The 9,680 183,042 316,826 0.02Williams Partners LP 657 33,086 31,956 0Williams-Sonoma Inc 1,000 29,263 43,750 0170
<strong>STANLIB</strong> <strong>Funds</strong> <strong>Limited</strong>Portfolio Statement (continued)<strong>STANLIB</strong> Multi-Manager Global Equity Fund as at 31 December <strong>2012</strong> (continued)Common Stock continuedNominal holding Cost Market Value % of Net AssetsUSDUSDUnited States (continued)Windstream Corp 10,406 122,334 86,370 0.01Wintrust Financial Corp 400 12,236 14,672 0Wisconsin Energy Corp 6,066 172,938 223,471 0.02WMI Holdings Corp 610 167,146 512 0WMS Industries Inc 700 27,601 12,250 0Wolverine World Wide Inc 600 19,828 24,588 0Woodward Inc 700 21,098 26,684 0World Acceptance Corp 300 12,074 22,368 0World Fuel Services Corp 9,500 367,170 391,020 0.03Worthington Industries Inc 900 13,460 23,373 0WPX Energy Inc 1,100 17,177 16,368 0WR Berkley Corp 4,497 122,890 169,717 0.01WR Grace & Co 900 28,863 60,462 0WSFS Financial Corp 3,900 156,752 164,034 0.01Wynn Resorts Ltd 1,315 162,641 147,806 0.01Xerox Corp 48,199 554,727 328,717 0.02Yahoo! Inc 15,511 226,907 308,514 0.02Yum! Brands Inc 9,419 471,139 625,610 0.04Zebra Technologies Corp 800 26,570 31,424 0Zep Inc 800 14,512 11,544 0Zimmer Holdings Inc 2,957 166,247 197,025 0.01Zions Bancorporation 5,530 115,608 118,397 0.01Zumiez Inc 400 6,696 7,760 0Total United States 36.83% (2011: 37.80%) 546,846,626 36.83Total Common Stock 94.53% (2011: 94.28%) 1,403,554,425 94.53<strong>STANLIB</strong> Multi-Manager Global Equity Fund at at 31 December <strong>2012</strong>Preferred StockNominal holding Cost Market Value % of Net AssetsUSDUSDBrazilBanco Bradesco SA 27,200 479,730 467,217 0.03Banco do Estado do Rio Grande do Sul SA 3,700 34,028 28,028 0Bradespar SA 3,600 75,719 57,671 0Braskem SA 4,200 32,131 26,236 0Cia Brasileira de Distribuicao Grupo Pao de Acucar 1,400 46,500 61,860 0Cia de Bebidas das Americas 10,600 237,534 443,054 0.03Cia Energetica de Minas Gerais 7,450 93,990 81,941 0.01Cia Energetica de Sao Paulo 3,700 60,944 35,039 0Cia Energetica do Ceara 1,100 20,514 24,176 0171
<strong>STANLIB</strong> <strong>Funds</strong> <strong>Limited</strong>Nominal holding Cost Market Value % of Net AssetsUSDUSDBrazil (continued)Cia Paranaense de Energia 1,900 43,525 29,361 0Eletropaulo Metropolitana Eletricidade de Sao Paulo SA 1,200 22,312 9,846 0Gerdau SA 12,100 152,354 105,961 0.01Gol Linhas Aereas Inteligentes SA 6,400 31,155 40,228 0Itau Unibanco Holding SA 37,600 738,834 613,169 0.05Itausa - Investimentos Itau SA 36,520 236,772 172,835 0.01Klabin SA 10,600 29,759 65,697 0Lojas Americanas SA 8,859 55,146 78,747 0.01Metalurgica Gerdau SA 4,400 79,087 48,997 0Oi SA 12,775 79,589 51,474 0Petroleo Brasileiro SA 59,400 890,031 566,005 0.04Randon Participacoes SA 4,500 29,910 27,802 0Telefonica Brasil SA 3,935 83,349 94,133 0.01Usinas Siderurgicas de Minas Gerais SA 600 8,429 3,751 0Vale SA 28,100 699,689 560,766 0.04Total Brazil 0.24% (2011: 0.00%) 3,693,994 0.24ColombiaBancolombia SA 4,392 62,523 72,976 0.01Grupo Argos SA/Colombia 3,425 29,314 40,123 0Total Colombia 0.01% (2011: 0.00%) 113,099 0.01GermanyDraegerwerk AG & Co KGaA 199 16,748 20,005 0Fuchs Petrolub AG 381 13,304 28,224 0Henkel AG & Co KGaA 3,892 208,849 318,439 0.02Jungheinrich AG 470 13,554 18,341 0Porsche Automobil Holding SE 2,453 172,318 198,955 0.01Volkswagen AG 1,660 212,406 377,629 0.03Total Germany 0.06% (2011: 0.00%) 961,593 0.06Korea, Republic of (South Korea)Hyundai Motor Co 279 17,817 19,520 0Samsung Electronics Co Ltd 288 149,989 228,931 0.02Total Korea, Republic of (South Korea) 0.02% (2011: 0.00%) 248,451 0.02MalaysiaMalaysian Airline System 20,467 19,532 6,625 0Total Malaysia 0.00% (2011: 0.00%) 6,625 0RussiaSurgutneftegas 122,300 59,289 79,727 0.01Total Russia 0.01% (2011: 0.00%) 79,727 0.01United KingdomMcbride 163,560 2 262 0Total United Kingdom 0.00% (2011: 0.00%) 262 0Total Preferred Stock 0.34% (2011: 0.00%) 5,103,751 0.34172
<strong>STANLIB</strong> <strong>Funds</strong> <strong>Limited</strong>Portfolio Statement (continued)<strong>STANLIB</strong> Multi-Manager Global Equity Fund as at 31 December <strong>2012</strong> (continued)Investment CompaniesNominal holding Cost Market Value % of Net AssetsUSDUSDLuxembourgCapital International Emerging Markets Fund 197,499 23,071,155 22,370,688 1.51Total Luxembourg 1.51% (2011: 0.00%) 22,370,688 1.51Total Investment Companies 1.51% (2011: 0.00%) 22,370,688 1.51WarrantsNominal holding Cost Market Value % of Net AssetsUSDUSDCanadaYellow Media Ltd 20/12/2022 25 6,379 39 0Total Canada 0.00% (2011: 0.00%) 39 0FranceUBISOFT Entertainment 10/10/2013 1,340 3 247 0Total France 0.00% (2011: 0.00%) 247 0GermanyNovatek Microelectronics Corp 02/11/2016 1,033 – 4,161 0Total Germany 0.00% (2011: 0.00%) 4,161 0LuxembourgEurofins Scientific 29/06/2017 27 73 1,709 0Total Luxembourg 0.00% (2011: 0.00%) 1,709 0MalaysiaWCT Bhd 11/12/2017 4,700 – 446 0Total Malaysia 0.00% (2011: 0.00%) 446 0SingaporeGlobal Yellow Pages Ltd 10/09/2014 69,000 – 228 0Total Singapore 0.00% (2011: 0.00%) 228 0Total Warrants 0.00% (2011: 0.00%) 6,830 0RightsNominal holding Cost Market Value % of Net AssetsUSDUSDKorea, Republic ofTaihan Electric Wire - Rights 07/01/2013 1,978 8,722 576 0Total Korea, Republic of 0.00% (2011: –%) 576 0PhilippinesABS CBN - Rights 24/01/2013 1,472,131 – – –Total Philippines 0.00% (2011: 0.00%) – –PolandPolimex - Rights 01/05/2013 22,374 2,527 268 0Total Poland 0.00% (2011: 0.00%) 268 0173
<strong>STANLIB</strong> <strong>Funds</strong> <strong>Limited</strong>Portfolio Statement (continued)<strong>STANLIB</strong> Multi-Manager Global Equity Fund as at 31 December <strong>2012</strong> (continued)Rights continuedNominal holding Cost Market Value % of Net AssetsUSDUSDSpainRepsol S.A. - Rights 24/01/2013 10,462 – 6,360 0Total Spain 0.00% (2011: 0.00%) 6,360 0Total Rights 0.00% (2011: 0.00%) 7,204 0Total Investments 1,264,363,279 1,431,042,898 96.38Net current assets 53,702,154 3.62Total net assets 1,484,745,052 100High Alpha Global Equity Fund as at 31 December <strong>2012</strong>Common StockTransferable securities listed on an exchange or dealt in on another regulated marketNominal holding Cost Market Value % of Net AssetsUSDUSDBrazilItau Unibanco Holding SA 519,494 7,910,124 8,550,871 1.24Multiplan Empreendimentos Imobiliarios SA 212,200 6,224,955 6,239,062 0.91Total Brazil 2.15% (2011: –0.00%) 14,789,933 2.15CanadaFirst Quantum Minerals Ltd 233,600 5,601,537 5,128,571 0.74Methanex Corp 204,300 6,271,836 6,469,446 0.94Total Canada 1.68% (2011: 1.93%) 11,598,017 1.68Cayman IslandsBaidu Inc 51,836 5,491,945 5,198,632 0.75Total Cayman Islands 0.75% (2011: 1.68%) 5,198,632 0.75CyprusProSafe SE 651,206 5,473,522 5,507,835 0.8Total Cyprus 0.80% (2011: 0.00%) 5,507,835 0.8FranceRenault SA 165,718 7,664,263 8,887,755 1.29Total France 1.29% (2011: 0.48%) 8,887,755 1.29GermanyBrenntag AG Npv 43,363 5,448,214 5,658,017 0.82Kabel Deutschland Holding AG 95,243 7,005,011 7,083,222 1.03Linde AG 27,331 4,611,639 4,752,716 0.69MTU Aero Engines Holding AG 65,482 4,011,707 5,950,749 0.86Total Germany 3.40% (2011: 2.12%) 23,444,704 3.4Hong KongChina Overseas Land & Investment Ltd 1,605,000 3,790,044 4,783,382 0.69Sun Hung Kai Properties Ltd 680,000 9,760,931 10,194,492 1.48Total Hong Kong 2.17% (2011: 0.82%) 14,977,874 2.17174
<strong>STANLIB</strong> <strong>Funds</strong> <strong>Limited</strong>Portfolio Statement (continued)High Alpha Global Equity Fund as at 31 December <strong>2012</strong>(continued)Common Stock continuedNominal holding Cost Market Value % of Net AssetsUSDUSDIndonesiaBank Rakyat Indonesia Persero 6,897,500 5,083,328 4,938,610 0.72Total Indonesia 0.72% (2011: 0.00%) 4,938,610 0.72IrelandCovidien Plc 224,154 12,501,253 12,940,410 1.88Total Ireland 1.88% (2011: 1.00%) 12,940,410 1.88JapanAsahi Group Holdings Ltd 305,900 7,027,279 6,499,029 0.94Daikin Industries Ltd 214,300 6,240,490 7,291,622 1.06Konami Corp 198,200 4,815,050 4,428,640 0.64Makita Corp 241,100 9,936,371 11,056,050 1.6Sanrio Co Ltd 191,500 6,629,416 6,072,905 0.88Toyota Motor Corp 308,600 12,419,511 14,276,300 2.08Total Japan 7.20% (2011: 11.63%) 49,624,546 7.2Korea, Republic of (South Korea)Kangwon Land Inc 173,420 4,291,672 4,738,147 0.69Samsung Electronics Co Ltd 12,226 11,334,555 17,369,867 2.52Total Korea, Republic of (South Korea) 3.21% (2011: 7.83%) 22,108,014 3.21NetherlandsFugro NV 84,484 5,759,888 4,939,805 0.72LyondellBasell Industries NV 175,799 9,380,161 10,039,881 1.45Total Netherlands 2.17% (2011: 0.61%) 14,979,686 2.17SwitzerlandNestle SA 190,648 12,037,491 12,413,434 1.8Novartis AG 227,254 13,081,767 14,263,120 2.07Swatch Group AG 25,415 11,152,531 12,802,608 1.86TE Connectivity Ltd 190,847 6,303,962 7,084,241 1.03Tyco International Ltd 125,037 3,491,176 3,654,832 0.53Total Switzerland 7.29% (2011: 1.35%) 50,218,235 7.29United KingdomAggreko Plc 96,253 3,479,971 2,722,391 0.4Aon Plc 130,933 7,215,838 7,279,875 1.06BG Group Plc 427,375 7,544,575 7,026,857 1.02GlaxoSmithKline Plc 401,151 8,992,721 8,698,639 1.26HSBC Holdings Plc 1,370,087 13,714,420 14,404,684 2.09Rio Tinto Plc 135,255 6,957,004 7,718,083 1.12Tullow Oil Plc 426,022 9,869,858 8,697,793 1.26Unilever Plc 332,110 12,496,657 12,767,338 1.85Vodafone Group Plc 5,037,086 13,622,017 12,642,078 1.83Weir Group Plc 214,792 6,226,504 6,542,972 0.95Total United Kingdom 12.84% (2011: 1.04%) 88,500,710 12.84175
<strong>STANLIB</strong> <strong>Funds</strong> <strong>Limited</strong>Portfolio Statement (continued)High Alpha Global Equity Fund as at 31 December <strong>2012</strong>(continued)Common Stock continuedNominal holding Cost Market Value % of Net AssetsUSDUSDUnited StatesAetna Inc 244,500 9,256,643 11,322,795 1.64Airgas Inc 107,885 9,644,603 9,848,822 1.43American Express Co 155,521 8,788,782 8,939,347 1.3American International Group Inc 309,361 10,206,333 10,920,443 1.58Apple Inc 31,431 11,723,079 16,753,351 2.44CF Industries Holdings Inc 29,500 4,391,624 5,991,155 0.87Comcast Corp 238,205 8,903,578 8,904,103 1.29Copa Holdings SA 62,567 5,928,004 6,220,411 0.9Cummins Inc 67,331 6,737,333 7,295,314 1.06Discover Financial Services 200,726 6,153,639 7,737,987 1.12Dresser-Rand Group Inc 104,729 5,332,896 5,879,486 0.85eBay Inc 197,430 9,707,965 10,074,853 1.46EMC Corp/MA 406,693 10,178,632 10,293,399 1.5Enterprise Products Partners LP 130,029 6,919,695 6,509,252 0.94Equifax Inc 109,826 5,503,546 5,943,783 0.86Facebook Inc 162,875 3,459,503 4,335,733 0.63Fidelity National Financial Inc 408,315 9,049,044 9,611,735 1.4Google Inc 17,065 11,760,261 12,103,522 1.77Henry Schein Inc 99,985 7,622,600 8,044,793 1.17JPMorgan Chase & Co 312,731 13,222,776 13,757,036 2Lam Research Corp 207,614 7,622,727 7,499,018 1.09Las Vegas Sands Corp 168,594 7,736,595 7,780,613 1.13Marathon Petroleum Corp 116,418 6,262,530 7,333,170 1.06McDonald's Corp 77,994 6,816,834 6,882,191 1Microsoft Corp 250,879 7,417,036 6,703,487 0.97National Oilwell Varco Inc 94,519 6,824,319 6,462,264 0.94PepsiCo Inc 116,374 8,048,096 7,964,637 1.16Pfizer Inc 544,683 13,425,385 13,666,095 1.99Philip Morris International Inc 91,885 8,024,298 7,686,180 1.12Priceline.com Inc 16,380 10,591,213 10,174,110 1.48QUALCOMM Inc 188,184 10,236,663 11,671,172 1.69Riverbed Technology Inc 326,614 6,211,875 6,437,562 0.93Sberbank of Russia 527,095 6,179,752 6,483,269 0.94Sirona Dental Systems Inc 142,785 8,359,623 9,202,493 1.34Solera Holdings Inc 101,363 4,909,155 5,419,880 0.79Union Pacific Corp 69,802 8,684,828 8,775,507 1.27United Rentals Inc 256,996 10,661,008 11,695,888 1.69Walt Disney Co 208,261 10,468,088 10,367,233 1.5WESCO International Inc 116,862 7,633,722 7,877,667 1.14World Fuel Services Corp 154,798 6,163,711 6,371,486 0.92Zimmer Holdings Inc 116,015 7,601,958 7,730,079 1.12Total United States 51.48% (2011: 60.08%) 354,671,321 51.48176
<strong>STANLIB</strong> <strong>Funds</strong> <strong>Limited</strong>Portfolio Statement (continued)High Alpha Global Equity Fund as at 31 December <strong>2012</strong>(continued)Common Stock continuedNominal holding Cost Market Value % of Net AssetsUSDUSDTotal Common Stock 99.03% (2011: 99.30%) 682,386,282 99.03Total Investments 645,241,146 682,386,282 99.03Net current assets 6,714,472 0.97Total net assets 689,100,754 100<strong>STANLIB</strong> Global Bond FundBondsTransferable securities listed on an exchange or dealt in on another regulated marketNominal holding Cost Market Value % of Net AssetsUSDUSDAustraliaNew South Wales Treasury Corp 6.00% 01/04/2016 3,775,000 3,872,984 4,252,368 5.2Queensland Treasury Corp 6.25% 21/02/2020 2,245,000 2,319,976 2,651,742 3.24Queensland Treasury Corp 6.00% 21/07/2022 815,000 874,958 959,174 1.17Total Australia 9.61 (2011: 8.32%) 7,863,284 9.61BrazilBrazil Notas do Tesouro Nacional 10.00% 01/01/2017 3,275,000 1,638,229 1,608,325 1.97Oi SA 5.75% 10/02/2022 700,000 687,974 729,892 0.89Total Brazil 2.86 (2011: 2.42%) 2,338,217 2.86GermanyKFW 6.25% 04/12/2019 890,000 797,722 1,049,191 1.28Total Germany 1.28 (2011: 1.06%) 1,049,191 1.28HungaryHungary Government Bond 5.50% 12/02/2016 246,000,000 1,014,068 1,101,342 1.35Total Hungary 1.35 (2011: 1.11%) 1,101,342 1.35ItalyItaly Buoni Poliennali Del Tesoro 5.00% 01/08/2039 2,110,000 2,257,415 2,777,756 3.39Total Italy 3.39 (2011: 0.00%) 2,777,756 3.39Korea, Republic of (South Korea)Korea Treasury Bond 3.00% 10/12/2013 634,600,000 554,843 593,988 0.73Korea Treasury Bond 5.75% 10/09/2018 3,182,700,000 2,962,485 3,440,498 4.2Total Korea, Republic of (South Korea) 4.93 (2011: 4.22%) 4,034,486 4.93MalaysiaMalaysia Government Bond 5.09% 30/04/2014 10,140,000 3,366,652 3,404,698 4.16Malaysia Government Bond 3.74% 27/02/2015 1,200,000 393,574 397,897 0.49Total Malaysia 4.65 (2011: 4.08%) 3,802,595 4.65MexicoMexican Bonos 8.50% 31/05/2029 19,300,000 1,643,674 1,870,556 2.29Total Mexico 2.29 (2011: 3.72%) 1,870,556 2.29New ZealandNew Zealand Government Bond 6.00% 15/05/2021 334,000 229,356 328,033 0.4177
<strong>STANLIB</strong> <strong>Funds</strong> <strong>Limited</strong>Portfolio Statement (continued)<strong>STANLIB</strong> Global Bond Fund as at 31 December <strong>2012</strong>(continued)Bonds continuedNominal holding Cost Market Value % of Net AssetsUSDUSDNew Zealand (continued)New Zealand Government Bond 5.50% 15/04/2023 2,495,000 2,216,173 2,403,389 2.94Total New Zealand 3.34 (2011: 3.50%) 2,731,422 3.34PolandPoland Government Bond 5.25% 25/10/2020 5,055,000 1,468,799 1,827,388 2.23Poland Government Bond 5.75% 23/09/2022 10,075,000 3,277,909 3,815,221 4.66Total Poland 6.89 (2011: 4.81%) 5,642,609 6.89South AfricaSouth Africa Government Bond 6.75% 31/03/2021 18,880,000 2,304,067 2,279,080 2.78South Africa Government Bond 6.50% 28/02/2041 8,980,000 837,700 867,441 1.06Total South Africa 3.84 (2011: 3.50%) 3,146,521 3.84United KingdomUnited Kingdom Gilt 4.50% 07/03/2013 3,890,000 6,358,708 6,366,666 7.78Total United Kingdom 7.78 (2011: 7.78%) 6,366,666 7.78United StatesBank of America Corp 4.50% 01/04/2015 1,317,000 1,315,763 1,403,551 1.72Dell Inc 6.50% 15/04/2038 375,000 465,454 432,477 0.53Fifth Third Bancorp 8.25% 01/03/2038 705,000 630,808 1,013,430 1.24General Electric Capital Corp 0.94% 02/06/2014 1,540,000 1,540,000 1,547,230 1.89Goldman Sachs Group Inc 5.25% 27/07/2021 300,000 298,855 341,646 0.42Goldman Sachs Group Inc 6.75% 01/10/2037 1,018,000 903,265 1,136,475 1.39Hartford Financial Services Group Inc 5.13% 15/04/2022 320,000 330,166 370,500 0.45Hewlett-Packard Co 4.65% 09/12/2021 875,000 884,952 876,775 1.07JP Morgan Alternative Loan Trust 6.00% 27/12/2036 2,525,315 1,799,632 2,199,529 2.68JPMorgan Chase & Co 1.10% 24/01/2014 805,000 806,034 809,464 0.99Mastr Resecuritization Trust 6.00% 27/06/2036 284,663 254,354 225,561 0.28Mastr Resecuritization Trust 6.00% 27/09/2037 235,959 179,648 210,768 0.26Merrill Lynch & Co Inc 7.75% 14/05/2038 400,000 440,681 516,150 0.63Municipal Electric Authority of Georgia 6.64% 01/04/2057 805,000 806,187 961,581 1.18Municipal Electric Authority of Georgia 6.66% 01/04/2057 700,000 698,723 831,208 1.02Time Warner Cable Inc 7.30% 01/07/2038 955,000 1,018,174 1,267,381 1.55United States Treasury Bill –% 07/03/2013 3,705,000 3,702,995 3,704,770 4.53United States Treasury Bill –% 14/11/2013 13,535,000 13,515,336 13,517,769 16.51United States Treasury Note/Bond 2.75% 15/08/2042 3,880,000 3,768,806 3,732,680 4.55Total United States 42.89 (2011: 31.78%) 35,098,945 42.89Total Bonds 95.10 (2011: 84.43%) 77,823,590 95.1Total Investments 72,437,099 77,823,590 95.1Net current assets 4,013,089 4.9Total net assets 81,836,679 100An analysis of the credit rating of the bonds held by <strong>STANLIB</strong> Global Bond Fund is disclosed in note 11.178
<strong>STANLIB</strong> <strong>Funds</strong> <strong>Limited</strong>Portfolio Statement (continued)<strong>STANLIB</strong> Global Emerging Markets Fund as at 31 December <strong>2012</strong>Common StockTransferable securities listed on an exchange or dealt in on another regulated marketNominal holding Cost Market Value % of Net AssetsUSDUSDAustraliaAnsell Ltd 54,913 899,120 872,260 0.84Total Australia 0.84% 872,260 0.84BermudaCredicorp Ltd 11,137 1,544,357 1,631,014 1.58Total Bermuda 1.58% 1,631,014 1.58BrazilBM&FBovespa SA 131,100 900,907 896,409 0.87BR Malls Participacoes SA 55,900 766,072 735,236 0.71CCR SA 114,500 1,032,397 1,085,449 1.05Cia de Bebidas das Americas 46,105 1,952,393 1,935,488 1.87Cia Hering 36,200 797,735 738,147 0.71Itau Unibanco Holding SA 95,871 1,505,263 1,578,037 1.53Petroleo Brasileiro SA 139,290 2,619,445 2,710,583 2.63Totvs SA 32,300 639,204 636,694 0.62Vale SA 53,939 1,063,723 1,131,101 1.09Total Brazil 11.08% 11,447,144 11.08Cayman IslandsAAC Technologies Holdings Inc 223,507 839,229 778,587 0.75Belle International Holdings Ltd 503,000 1,074,945 1,083,764 1.04ENN Energy Holdings Ltd 208,000 906,965 904,363 0.88Golden Eagle Retail Group Ltd 206,000 495,762 503,917 0.49Hengan International Group Co Ltd 73,000 669,186 657,394 0.64Tencent Holdings Ltd 30,384 992,713 972,963 0.94Total Cayman Islands 4.74% 4,900,988 4.74ChileInversiones La Construccion SA 33,183 617,968 646,611 0.63Total Chile 0.63% 646,611 0.63ChinaPetroChina Co Ltd 608,000 845,745 858,192 0.83Zhuzhou CSR Times Electric Co Ltd 305,000 1,054,656 1,119,533 1.08Total China 1.91% 1,977,725 1.91China, Republic of (Taiwan)Chinatrust Financial Holding Co Ltd 1,163,000 697,916 684,891 0.66Delta Electronics Inc 325,000 1,198,361 1,186,348 1.15Far EasTone Telecommunications Co Ltd 425,000 1,061,978 1,080,095 1.05Hon Hai Precision Industry Co Ltd 265,000 875,972 810,370 0.78President Chain Store Corp 106,000 564,091 567,619 0.55Taiwan Semiconductor Manufacturing Co Ltd 381,547 3,808,204 3,810,372 3.69Total China, Republic of (Taiwan) 7.88% 8,139,695 7.88179
<strong>STANLIB</strong> <strong>Funds</strong> <strong>Limited</strong>Portfolio Statement (continued)<strong>STANLIB</strong> Global Emerging Markets Fund as at 31 December <strong>2012</strong>(continued)Common Stock continuedNominal holding Cost Market Value % of Net AssetsUSDUSDCzech RepublicKomercni Banka AS 3,922 812,875 826,234 0.8Total Czech Republic 0.80% 826,234 0.8Hong KongAIA Group Ltd 277,600 1,088,954 1,083,417 1.05China Mobile Ltd 218,051 2,492,804 2,538,943 2.45CNOOC Ltd 898,538 1,942,817 1,945,245 1.88Sun Art Retail Group Ltd 754,500 1,195,652 1,154,460 1.12Total Hong Kong 6.50% 6,722,065 6.5IndiaICICI Bank Ltd 50,490 2,218,971 2,201,868 2.14Larsen & Toubro Ltd 16,750 516,965 488,263 0.47Mahindra & Mahindra Ltd 29,848 516,595 498,760 0.48Total India 3.09% 3,188,891 3.09IndonesiaJasa Marga Persero Tbk PT 1,705,000 1,028,976 964,178 0.93Semen Indonesia Persero Tbk PT 643,500 993,667 1,054,953 1.02Total Indonesia 1.95% 2,019,131 1.95IsraelIsrael Chemicals Ltd 84,795 1,038,090 1,014,055 0.98Total Israel 0.98% 1,014,055 0.98Korea, Republic of (South Korea)Hyundai Department Store Co Ltd 4,296 624,188 636,028 0.62Hyundai Mobis 1,860 504,136 499,498 0.48Hyundai Motor Co 9,092 1,950,311 1,855,640 1.8Hyundai Wia Corp 3,092 500,827 498,209 0.48LG Household & Health Care Ltd 1,370 778,624 840,754 0.81Samsung Electronics Co Ltd 4,923 6,873,877 6,994,262 6.77Samsung Engineering Co Ltd 2,678 426,158 412,741 0.4SK Innovation Co Ltd 3,173 518,244 515,706 0.5SK Telecom Co Ltd 31,497 503,724 498,598 0.48Total Korea, Republic of (South Korea) 12.34% 12,751,436 12.34LuxembourgSamsonite International SA 487,200 1,023,837 1,004,461 0.98Tenaris SA 16,873 669,227 707,147 0.68Total Luxembourg 1.66% 1,711,608 1.66MalaysiaAxiata Group Bhd 2,100 4,126 4,526 0DiGi.Com Bhd 415,200 660,458 712,815 0.69Total Malaysia 0.69% 717,341 0.69MexicoAlfa SAB de CV 467,200 1,015,403 986,867 0.95180
<strong>STANLIB</strong> <strong>Funds</strong> <strong>Limited</strong>Portfolio Statement (continued)<strong>STANLIB</strong> Global Emerging Markets Fund as at 31 December <strong>2012</strong>(continued)Common Stock continuedNominal holding Cost Market Value % of Net AssetsUSDUSDMexico (continued)Arca Continental SAB de CV 133,900 1,010,984 989,869 0.96Cemex SAB de CV 125,013 1,129,326 1,233,878 1.19Fomento Economico Mexicano SAB de CV 14,207 1,429,772 1,430,503 1.39Genomma Lab Internacional SAB de CV 524,600 1,108,826 1,072,545 1.04Grupo Financiero Santander Mexico SAB de CV 52,544 828,281 850,687 0.82Wal-Mart de Mexico SAB de CV 165,900 557,320 538,727 0.52Total Mexico 6.87% 7,103,076 6.87NetherlandsX5 Retail Group NV 48,582 834,185 866,217 0.84Total Netherlands 0.84% 866,217 0.84PhilippinesAyala Corp 95,520 1,205,177 1,201,489 1.17BDO Unibank Inc 334,670 614,323 592,935 0.57SM Investments Corp 30,950 650,004 663,658 0.64SM Prime Holdings Inc 816,200 311,995 327,949 0.32Universal Robina Corp 242,260 480,083 489,680 0.47Total Philippines 3.17% 3,275,711 3.17RussiaMagnit OJSC 39,323 1,435,159 1,576,852 1.53MegaFon OAO 23,984 526,645 560,266 0.54MMC Norilsk Nickel OJSC 53,271 949,310 981,785 0.95Mobile Telesystems OJSC 70,832 1,267,288 1,320,308 1.28NovaTek OAO 9,335 1,074,857 1,108,998 1.07Sberbank Of Russian Federation 963,680 2,932,673 2,936,044 2.84Total Russia 8.21% 8,484,253 8.21SingaporeKeppel Corp Ltd 152,000 1,343,742 1,367,559 1.32Total Singapore 1.32% 1,367,559 1.32South AfricaNaspers Ltd 21,893 1,365,451 1,401,662 1.36Shoprite Holdings Ltd 73,446 1,659,106 1,770,269 1.71Total South Africa 3.07% 3,171,931 3.07ThailandCP ALL PCL 686,400 943,491 1,026,580 0.99Kasikornbank PCL 150,746 918,972 953,559 0.92PTT PCL 95,900 1,039,911 1,040,822 1.01Siam Commercial Bank PCL 180,872 958,164 1,070,219 1.04Total Access Communication PCL 355,700 1,031,204 1,026,159 0.99Total Thailand 4.95% 5,117,339 4.95TurkeyEnka Insaat ve Sanayi AS 192,825 550,760 570,473 0.55181
<strong>STANLIB</strong> <strong>Funds</strong> <strong>Limited</strong>Portfolio Statement (continued)<strong>STANLIB</strong> Global Emerging Markets Fund as at 31 December <strong>2012</strong>(continued)Common Stock continuedNominal holding Cost Market Value % of Net AssetsUSDUSDTurkey (continued)Migros Ticaret AS 92,297 1,136,490 1,109,290 1.07Turkiye Garanti Bankasi AS 339,474 1,686,463 1,757,559 1.71Turkiye Halk Bankasi AS 85,873 831,391 839,623 0.81Total Turkey 4.14% 4,276,945 4.14United StatesCopa Holdings SA 7,497 711,015 745,352 0.72Total United States 0.72% 745,352 0.72Total Common Stock 89.96% 92,974,581 89.96Preferred StockNominal holding Cost Market Value % of Net AssetsUSDUSDBrazilAlpargatas SA 123,000 856,929 907,113 0.88Total Brazil 0.88% 907,113 0.88RussiaSurgutneftegas 2,024,087 1,304,836 1,319,502 1.27Total Russia 1.27% 1,319,502 1.27Total Preferred Stock 2.15% 2,226,615 2.15Investment CompaniesNominal holding Cost Market Value % of Net AssetsUSDUSDSingaporeiShares MSCI India Index ETF 576,900 3,673,045 3,640,239 3.52Total Singapore 3.52% 3,640,239 3.52Total Investment Companies 3.52% 3,640,239 3.52Total Investments 97,680,991 98,841,435 95.63Net current assets 4,507,497 4.36Total net assets 103,348,932 100182
<strong>STANLIB</strong> <strong>Funds</strong> <strong>Limited</strong>Fund Statistics (unaudited) as at 31 December <strong>2012</strong>CCY <strong>2012</strong> 2011 2010 2009 2008Combined Net Assets USD 2,972,259,578 2,587,118,908 2,663,504,317 2,247,387,030 1,389,327,106<strong>STANLIB</strong> Global Property FundCCY <strong>2012</strong> 2011 2010 2009 2008Net Assets USD 79,084,541 33,557,524 37,808,990 4,643,953 -Participating shares in issue USD 41,135 21,964 24,936 3,710 -Net asset value (NAV) per participatingshare at year endHighest NAV per participating share duringthe yearLowest NAV per participating share duringthe yearUSD 1,922.56 1,527.84 1,516.24 1,251.74 -USD 1,928.56 1,704.90 1,527.51 2,006.73 -USD 1,517.84 1,350.19 1,166.74 985.62 -<strong>STANLIB</strong> Multi-Manager Global Bond FundCCY <strong>2012</strong> 2011 2010 2009 2008Net Assets USD 534,143,620 358,653,440 476,386,117 287,212,648 270,048,477Participating shares in issue 258,448 184,298 259,935 166,519 174,624Net asset value (NAV) per participatingshare at year endHighest NAV per participating share duringthe yearLowest NAV per participating share duringthe yearUSD 2,066.74 1,946.05 1,832.71 1,724.80 1,546.462,075.81 1,995.52 1,898.07 1,780.39 1,629.951,931.85 1,805.45 1,691.15 1,436.36 1,410.79<strong>STANLIB</strong> Multi-Manager Global Equity FundCCY <strong>2012</strong> 2011 2010 2009 2008Net Assets USD 1,484,745,052 1,367,888,233 1,171,930,890 664,711,715 384,887,549Participating shares in issue 801,847 865,422 691,313 444,051 352,078Net asset value (NAV) per participatingshare at year endHighest NAV per participating share duringthe yearLowest NAV per participating share duringthe yearUSD 1,851.66 1,580.60 1,695.22 1,496.93 1,093.19USD 1,858.36 1,827.75 1,695.22 1,052.38 2,092.34USD 1,597.81 1,434.98 1,352.96 851.52 927.64High Alpha Global Equity FundCCY <strong>2012</strong> 2011 2010 2009 2008Net Assets USD 689,100,754 753,842,969 889,228,404 1,006,474,687 461,430,574Participating shares in issue - Class A 180,980 217,416 334,929 945,953 613,189Net asset value (NAV) per participatingshare at year endHighest NAV per participating share duringthe yearLowest NAV per participating share duringthe yearUSD 773.02 742.51 802.76 697.23 552.75USD 834.24 924.78 803.45 699.45 960.82USD 738.63 673.65 624.99 447.19 454.55Participating shares in issue - Class B 637,147 783,907 762,342 492,814 219,095Net asset value (NAV) per participatingshare at year endHighest NAV per participating share duringthe yearLowest NAV per participating share duringthe yearUSD 789.56 755.71 813.76 703.97 559.08USD 852.37 939.39 814.37 706.09 761.10USD 753.23 685.15 632.02 449.98 459.58183
<strong>STANLIB</strong> <strong>Funds</strong> <strong>Limited</strong>Fund Statistics (unaudited) as at 31 December <strong>2012</strong><strong>STANLIB</strong> Global Bond FundCCY <strong>2012</strong> 2011 2010 2009 2008Net Assets USD 81,836,679 73,176,742 88,149,916 284,344,027 272,960,506Participating shares in issue 56,857 56,057 73,868 264,317 298,257Net asset value (NAV) perparticipating share at year endHighest NAV per participating shareduring the yearLowest NAV per participating shareduring the yearUSD 1,439.34 1,305.40 1,193.34 1,075.77 915.19USD 1,441.25 1,320.79 1,225.17 1,100.81 1,001.08USD 1,294.60 1,177.20 1,074.37 843.31 834.20<strong>STANLIB</strong> Global Emerging Markets Fund *CCY <strong>2012</strong> 2011 2010 2009 2008Net Assets USD 103,348,932 - - - -Participating shares in issue 101,093 - - - -Net asset value (NAV) per participatingshare at year endHighest NAV per participating share duringthe yearLowest NAV per participating share duringthe yearUSD 1,022.32 - - - -USD 1,026.04 - - - -USD 1,000.00 - - - -* Class Fund launched on 6 December <strong>2012</strong>184
<strong>STANLIB</strong> <strong>Funds</strong> <strong>Limited</strong>Summary of Material Portfolio Changes (unaudited) as at 31 December <strong>2012</strong>Global Property FundCostProceedsPurchases USD’000 Sales USD’000Growthpoint Properties Australia 2,134 BR Malls Participacoes SA 990Simon Property Group Inc 1,988 American Tower Corp 658New Europe Property Invest 1,793 Unibail-Rodamco SE 649Unibail-Rodamco SE 1,751 Castellum AB 515Wharf Holdings Ltd 1,362 Swiss Prime Site AG 498Swiss Prime Site AG 1,339 Westfield Group 496HCP Inc 1,275 Corrections Corp of America 414Public Storage 1,021 Prologis Inc 396BR Malls Participacoes SA 930 General Growth Properties Inc 366Goodman Group 712 Eurocommercial Properties NV 343Canadian Real Estate Investment Trust 683 Simon Property Group Inc 313Equity Residential 663 Deutsche Euroshop AG 298Link REIT/The 662 Cromwell Property Group 290Primaris Retail Real Estate Investment Trust 655 Medical Properties Trust 288American Campus Communities Inc 613 Hongkong Land Holdings Ltd 279Westfield Retail Trust 612 Sovran Self Storage 276Canadian Apartment Properties REIT 600 Immofinanz Immobilien Anlagen 254American Tower Corp 599 Conwert Immobilien Invest 247Japan Retail Fund Investment Corp 596 LaSalle Hotel Properties 231Yuexiu Real Estate Investment Trust 575 Digital Realty Trust Inc 224Cost of investments purchased during the year USD 52,208,588Proceeds of investments sold during the year USD 15,008,209The schedule refers to the top 20 securities bought and sold during the year. The Directors consider that disclosure of the 20 largestpurchases and 20 largest sales is sufficient to reflect the nature of the operating activity of the Class Fund and that further disclosureof all transactions of the Class Fund would not add any further value.185
<strong>STANLIB</strong> <strong>Funds</strong> <strong>Limited</strong>Summary of Material Portfolio Changes (unaudited) as at 31 December <strong>2012</strong><strong>STANLIB</strong> Multi-Manager Global Bond FundCostProceedsPurchases USD’000 Sales USD’000United States Treasury Bill 0% 14/11/2013 20,970Institutional Cash Series PLC - Institutional USDollar Liquidity FundInstitutional Cash Series PLC - Institutional USDollar Liquidity Fund13,17115,000 Fannie Mae Pool 3.5% 01/12/2040 10,919United States Treasury Bill 0% 07/03/2013 17,334 Fannie Mae Pool 2.5%31/12/<strong>2012</strong> 9,746Fannie Mae Pool 3.5% 01/12/2040 12,155 United States Treasury Bill 4.125% 15/05/2015 9,666Fannie Mae Pool 4.5% 01/12/2039 11,040 United States Treasury Bill 0% 28/06/<strong>2012</strong> 8,850Fannie Mae Pool 2.5% 31/12/<strong>2012</strong> 9,848 Fannie Mae Pool 4.5%01/12/2039 7,899United States Treasury Bill 4.125% 15/05/2015 9,664 United States Treasury Bill 4.25% 15/11/2040 14,658United States Treasury Bill 0% 28/06/<strong>2012</strong> 8,847 Fannie Mae Pool 3.5% 6,987United States Treasury Bill 1.625% 15/08/2022 6,958United States Treasury Note/Bond1.62%15/08/2022United States Treasury Bill 2.75% 15/08/2042 6,464 Fannie Mae Pool 4% 11/05/<strong>2012</strong> 5,178Fannie Mae Pool 3.5% 15/10/2041 6,396 Fannie Mae Pool 4% 12/07/<strong>2012</strong> 5,177Fannie Mae Pool 4% 01/12/2040 6,114 Bundesrepublic Deutschland 3% 04/07/2020 4,955Fannie Mae Pool 4.5% 25/01/2040 5,914Federal National Mortgage Association 4.5%01/04/2042Fannie Mae Pool 3% 19/11/<strong>2012</strong> 5,617 Fannie Mae Pool 3% 19/11/<strong>2012</strong> 4,831Federal National Mortgage Association 4.5%01/04/20426,9424,8534,847 Fannie Mae Pool 3% 11/08/<strong>2012</strong> 4,618Fannie Mae Pool 3% 11/08/<strong>2012</strong> 4,619 Fannie Mae Pool 4.5% 13/11/2036 4,609Fannie Mae Pool 3.5%11/05/<strong>2012</strong> 4,553 Fannie Mae Pool 3% 31/12/<strong>2012</strong> 4,414Capital International Global High IncomeOpportunitiesFannie Mae Pool 2.5% 31/12/2049 4,4644,505 Norway Government Bond 6.5% 15/05/2013 4,090Federal National Mortgage Association 4.5%09/01/2042Fannie Mae Pool 3% 31/12/2049 4,457 Bundesrepublic Deutschland4.25% 04/07/2014 3,935Cost of investments purchased during the year USD 804,522,118Proceeds of investments sold during the year USD 635,878,0874,089The schedule refers to the top 20 securities bought and sold during the year. The Directors consider that disclosure of the 20 largestpurchases and 20 largest sales is sufficient to reflect the nature of the operating activity of the Class Fund and that further disclosureof all transactions of the Class Fund would not add any further value.186
<strong>STANLIB</strong> <strong>Funds</strong> <strong>Limited</strong>Summary of Material Portfolio Changes (unaudited) as at 31 December <strong>2012</strong><strong>STANLIB</strong> Multi-Manager Global Equity FundCostProceedsPurchases USD’000 Sales USD’000Vodafone Group Plc 15,219 Apple Inc 24,864Microsoft Corp 12,450 Google Inc 17,257Roche Holding AG 12,378 JPMorgan Chase & Co 15,376Nestle SA 12,265 Vodafone Group Plc 14,959GlaxoSmithKline Plc 11,711 Baidu Com 14,884Johnson & Johnson 11,517 Roche Holding AG 13,205Exxon Mobil Corp 10,829 Capital International Emerging Markets Fund 12,874AT&T Inc 10,352 Goldman Sachs Group Inc/The 11,933UnitedHealth Group Inc 10,075 CME Group Inc/IL 11,687Royal Dutch Shell ‘B’ 10,066 Petroleo Brasileiro SA 11,345Google Com 9,568 Wpp Plc Gbp0.1 10,934Citigroup Inc 9,115 GlaxoSmithKline Plc 10,547Kraft Foods Group Inc 8,363 Broadcom Corp 9,011Comcast Corp 8,312 UBS AG 8,743UBS AG 7,770 UnitedHealth Group Inc 8,620Potash Corp of Saskatchewan Inc 7,748 Juniper Networks Inc 8,318Coca-Cola Co/The 7,679 Accenture Plc 8,212Centrica Plc 7,617 AT&T Inc 7,839Tyco International Ltd 7,559 Microsoft Corp 7,807Taiwan Semiconductor Manufacturing Co Ltd 7,483 Heineken Holding NV 7,688Cost of investments purchased during the year USD 1,138,712,467Proceeds of investments sold during the year USD 1,147,155,819The schedule refers to the top 20 securities bought and sold during the year. The Directors consider that disclosure of the 20 largestpurchases and 20 largest sales is sufficient to reflect the nature of the operating activity of the Class Fund and that further disclosureof all transactions of the Class Fund would not add any further value.187
<strong>STANLIB</strong> <strong>Funds</strong> <strong>Limited</strong>Summary of Material Portfolio Changes (unaudited) as at 31 December <strong>2012</strong>High Alpha Global Equity FundCostProceedsPurchases USD’000 Sales USD’000iShares MSCI EAFE Index Fund 16,191 SPDR S&P 500 ETF Trust NPV 16,543SPDR S&P 500 ETF Trust NPV 16,112 World Fuel Services Corp 16,282Unilever Plc 15,235 Samsung Engineering 14,477Pfizer Inc 13,881 Eisai 14,301Nestle SA 13,770 Zeon Corp 13,579HSBC Holdings Plc 13,714 Wright Express Com 13,019Vodafone Group Plc 13,622 Apple Com NPV 12,836Covidien Plc 12,501 McKesson Corp 12,227Toyota Motor Corp 12,420 Roper Industries Inc 11,959PepsiCo Inc 12,397 Hormel Foods Com 11,946JPMorgan Chase & Co 12,311 Amgen Inc 11,809Google Inc 11,760 Endo Health Solutions 11,651Swatch Group AG/The 11,153 Esterline Technologies Com 11,646Amgen Com 10,968 Dell Inc Com 11,628United Therapeutics Corporation 10,671 TransDigm Group Inc 11,304Agco Corp Com 10,510 Polaris Industries Inc 11,229TGS Nopec Geophs 10,494 TGS Nopec Geophysical Co ASA 11,196Walt Disney Co/The 10,468 DISH Network Corp 10,900eBay Inc 10,347 Continental AG 10,607Kabel Deutschland Holding AG 10,276 Mattel Inc 10,416Cost of investments purchased during the year USD 1,120,793,601Proceeds of investments sold during the year USD 1,217,513,960The schedule refers to the top 20 securities bought and sold during the year. The Directors consider that disclosure of the 20 largestpurchases and 20 largest sales is sufficient to reflect the nature of the operating activity of the Class Fund and that further disclosureof all transactions of the Class Fund would not add any further value.188
<strong>STANLIB</strong> <strong>Funds</strong> <strong>Limited</strong>Summary of Material Portfolio Changes (unaudited) as at 31 December <strong>2012</strong><strong>STANLIB</strong> Global Bond FundCostProceedsPurchases USD’000 Sales USD’000United States Treasury Bill 0% 14/11/2013 13,513 United States Treasury Bill 4.25% 15/11/2040 11,144United States Treasury Bill 0% 07/03/2013 6,184 United States Treasury Bill 0% 28/06/<strong>2012</strong> 6,185United States Treasury Bill 0% 28/06/<strong>2012</strong> 6,183 United States Treasury Bill 0% 07/03/2013 4,642United States Treasury Bill 2.75% 15/8/2042 3,768 Mexico Bonos Desarr 8.5% 31/05/2029 3,787Italy Buoni Poliennali Del Tesoro 5% 01/08/39 2,831 Norway Government Bond 6.5% 15/05/2013 2,817United States Treasury Bill 4.25% 15/11/2040 2,439 Canadian Government Bond 2% 01/09/<strong>2012</strong> 2,690Mexico Bonos 8.5% 31/05/2029 2,202 Amgen Inc 5.15% 15/11/2041 1,569United States Treasury Bill 0% 07/03/2013 2,158 United Kingdom Gilt 4.5% 07/03/2013 1,422United Kingdom Gilt 4.5% 07/03/2013 2,048 New South Wales Treasury Corp 6% 01/04/2019 1,393Queensland Treasury Corp 6.25% 21/02/2020 1,887 New South Wales Treasury Corp 6% 01/04/2016 1,270Korea Treasury Bond 5.75% 10/09/2018 1,492 Comcast Corp 6.55% 01/07/2039 1,236Poland Government Bond 5.75% 23/09/2022 1,401 Morgan Stanley 5.5% 28/07/2021 1,036New South Wales Treasury Corp 6% 01/04/16 1,362 JPMorgan Chase & Co 4.5% 24/01/2022 928Malaysia Government Bond 5.094% 30/04/2014 1,146 Poland Government Bond 5.75% 23/09/2022 847Queensland Treasury Corp 6% 21/07/2022 890 New Zealand Government 5.5% 15/04/2023 844JP Morgan Chase 4.5% 24/01/2022 841 Indonesia Treasury Bond 10% 15/09/2024 838New Zealand Government Bond 5.5% 15/04/2023 755 Italy Buoni Poliennali Del Tesoro 5% 01/08/2039 786Oi SA 5.75% 10/02/2022 688 Malaysia Government Bond 5.094% 30/04/2014 774South Africa Government Bond 6.5% 28/02/2041 664 Korea Treasury Bond 3% 10/12/2013 707Morgan Stanley 5.5% 28/07/2021 560 South Africa Government Bond 6.5% 28/02/2041 636Cost of investments purchased during the year USD 61,052,837Proceeds of investments sold during the year USD 53,281,865The schedule refers to the top 20 securities bought and sold during the year. The Directors consider that disclosure of the 20 largestpurchases and 20 largest sales is sufficient to reflect the nature of the operating activity of the Class Fund and that further disclosureof all transactions of the Class Fund would not add any further value.189
<strong>STANLIB</strong> <strong>Funds</strong> <strong>Limited</strong>Summary of Material Portfolio Changes (unaudited) as at 31 December <strong>2012</strong><strong>STANLIB</strong> Global Emerging Markets FundCostPurchases USD’000 SalesiShares MSCI Taiwan Index Fund 10,298 iShares MSCI Taiwan Index Fund 10,351ProceedsUSD’000iShares MSCI South Korea Capped Index Fund 9,827 iShares MSCI South Korea Capped Index Fund 10,034iShares MSCI Emerging Markets Index Fund 9,791 iShares MSCI Emerging Markets Index Fund 10,020iShares MSCI Brazil Capped Index Fund 9,590 iShares MSCI Brazil Capped Index Fund 9,868Samsung Electronics Co Ltd 6,874 China Overseas Land & Investment Ltd 3,656iShares MSCI India Index ETF 3,673 Cie Financiere Richemont SA 3,565Cie Financiere Richemont SA 3,564 Great Wall Motor Co Ltd 3,317China Overseas Land & Investment Ltd 3,498 Koza Altin Isletmeleri AS 3,105Great Wall Motor Co Ltd 3,497 Lukoil OAO 2,087Koza Altin Isletmeleri AS 3,115 Woolworths Holdings Ltd/South Africa 2,045Sberbank of Russian Federation 2,933 Galaxy Entertainment Group Ltd 2,039Siam Commercial Bank PCL 2,844 Siam Commercial Bank PCL 2,026China Mobile Ltd 2,710 Turkcell Iletisim Hizmetleri AS 1,933Petroleo Brasileiro SA 2,619 China Minsheng Banking Corp Ltd 1,867Kasikornbank PCL 2,444 Tata Motors Ltd 1,846Taiwan Semiconductor Manufacturing Co Ltd 2,232 Kasikornbank PCL 1,630ICICI Bank Ltd 2,219 Imperial Holdings Ltd 1,615Galaxy Entertainment Group Ltd 2,131 Skyworth Digital Holdings Ltd 1,400Lukoil OAO 2,037 Copa Holdings SA 1,281Copa Holdings SA 2,014 AAC Technologies Holdings Inc 1,179Cost of investments purchased during the year USD 187,056,397Proceeds of investments sold during the year USD 90,539,655The schedule refers to the top 20 securities bought and sold during the year. The Directors consider that disclosure of the 20 largestpurchases and 20 largest sales is sufficient to reflect the nature of the operating activity of the Class Fund and that further disclosureof all transactions of the Class Fund would not add any further value.190
<strong>STANLIB</strong> <strong>Funds</strong> <strong>Limited</strong>Notice of <strong>Annual</strong> General MeetingNOTICE IS HEREBY GIVEN that the <strong>Annual</strong> General Meeting of <strong>STANLIB</strong> <strong>Funds</strong> <strong>Limited</strong> will be held at Standard Bank House, 47-49La Motte Street, St. Helier, Jersey, Channel Islands on Wednesday 26th June 2013 at 2.30 pm for the purpose of considering and, ifthought fit, passing the following Resolutions:1. To receive and adopt the financial statements for the year ended 31 December <strong>2012</strong> together with the reports of theDirectors and Independent Auditor thereon.2. To re-elect Mr Neil Deacon as a Director of the Company, having been appointed by the Directors since the date of the last<strong>Annual</strong> General Meeting, in accordance with Article 30.3;3. To re-elect Mr Michael Farrow, Mr Sidney Place and Mr Martin Rabe as Directors of the Company;4. To fix the remuneration of the Directors at £65,000 for the forthcoming year.5. To authorise the directors to agree the auditors’ remuneration for the year ended 31 December <strong>2012</strong> payable toPricewaterhouseCoopers CI LLP.6. To appoint PricewaterhouseCoopers, Ireland as auditors of the Company for the year ended 31 December 2013 and authorisethe directors to agree the auditors’ remuneration.By order of the boardStandard Bank Fund Managers Jersey <strong>Limited</strong>SecretaryMay 2013Notes1. A member entitled to attend and vote is entitled to appoint one or more proxies to attend and vote in his stead. A proxy neednot be a member of the company.2. To be valid, this proxy form must be completed and deposited at the registered office of the company not less than 48 hoursbefore the time fixed for the meeting.3. If the shareholder is a corporation, the form must be executed either under its common seal or under the hand of an officeror attorney so authorised.4. In the case of joint holders, the signature of any one joint holder will be sufficient, but the names of all joint holders should bestated.191
The Secretary<strong>STANLIB</strong> <strong>Funds</strong> <strong>Limited</strong>Standard Bank House47-49 La Motte StreetSt HelierJERSEYJE2 4SZ<strong>STANLIB</strong> <strong>Funds</strong> <strong>Limited</strong>Form of ProxyPlease complete in blockcapitalsI/WeComplete only if specialproxy desired. (See Note abelow)being a shareholder(s) of no par value each in the capital of the company hereby appoint theChairman of the Meeting or failing him:as my/our proxy to vote for me/us on my/our behalf at the <strong>Annual</strong> GeneralMeeting of the Company to be held on Wednesday 26th June 2013 at 2.30 pmand at any adjournments thereof, in the following manner:Resolutions*Strike out whatever is notdesiredOrdinary ResolutionsNo.1 For/Against*No.2 For/Against*No.3 For/Against*No.4 For/Against*No.5 For/Against*No.6 For/Against*Signed this day of [year]Signaturea. If you desire to appoint a proxy otherthan indicated above, please delete theappropriate words and insert the name andaddress of your proxyc. To be valid, the proxy must be lodged withthe secretary of the company 48 hoursprior to the meetingb. Unless otherwise instructed, the proxy willvote or abstain from voting as he thinks fit inrelation to the resolutions referred to aboved. A corporation should complete this formunder its common seal or under the hand ofa duly authorised officer or attorney192
Notes193
Notes194
17 Melrose Boulevard, Melrose Arch2196PO Box 203Melrose Arch2076T0860 123 003 (SA only)T+27 (0)11 448 6000Econtact@stanlib.comWstanlib.comGPS coordinatesS 26.13433°, E 028.06800°W<strong>STANLIB</strong> Asset Management <strong>Limited</strong> | Reg. No. 1969/002753/06 | Authorised FSP in terms of the FAIS Act, 2002 (Licence No. 26/10/719) 2647_Q4<strong>2012</strong>