Illinois Migration History 1850-2018
 Other state maps: California, Florida, Illinois, Texas, New York, Alabama, Arizona, Colorado, Utah, Virginia, Washington, all other states
by James Gregory
Illinois, like other midwestern states, experienced rapid population growth through migration in the 19th century and much slower growth since then. Recording a population of 851,000 in 1850, the state doubled its numbers by 1860, doubled again by 1880, and again before 1910. It has taken a century to double the 1910 total.
Migration in the 19th century drew heavily on states to the east of Illinois, especially New York, Ohio, and Pennsylvania. European immigrants from Gemany and Ireland came in huge numbers in the same period. The 1880 census showed that roughly half the population were from out of state with Germany, New York, Ohio, and Ireland the leading contributors. Eastern Europeans joined the mix at the turn of the century. The 1910 census marks the leading out-of-state birthplaces as Germany, Poland, Indiana, and the Russian empire. In the following decades the percentage of whites born in state would grow with each census, reflecting the restriction on European immigration and reduced rates of white interstate migration. But these same decades witnessed an important new migration, the Great Migration of African Americans out of the South. Chicago and other Illinois cities were transformed as hundreds of thousands of people made their way north in the decades from 1910 to mid 1970s, with Mississippi, Arkansas, and Tennessee the leading contributors. Latinos have made major contributions since the 1970s, coming not just from Mexico but also from Puerto Rico and as US born migrants from other states.
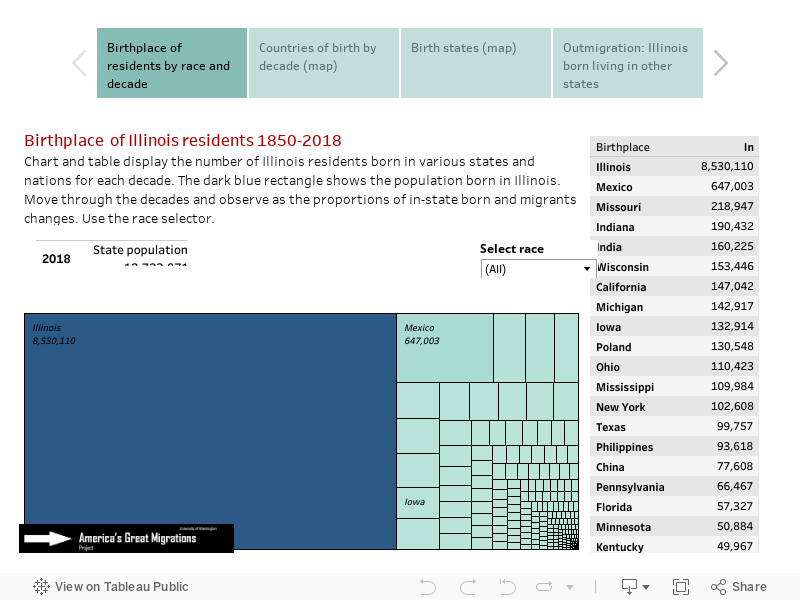
Notice in the visualization below that the dark blue rectangle representing population born in state grows decade by decade from 1850 until 2000 when there is small reversal. Switch the race category to Black or Latino to see a very different sequence. This visualization tool is hosted by Tableau Public and may take a few seconds to respond. If slow, refresh the page. Click here for other state migration histories
Move between four visualizations with tabs below
Note on data issues: Birth state information is missing for about 5% of US-born persons in 1970 and about 2% in 1960. These birthplaces are labeled "United States, ns" in the charts. Birthplaces were not recorded for enslaved persons in the 1850 and 1860 censuses, so it is not until 1870 that reliable data on African Americans became available. Native Americans were not routinely included in decennial censuses until 1900.
Source: U.S. Census data from the Minnesota Population Center's IPUMS USA: Steven Ruggles, Katie Genadek, Ronald Goeken, Josiah Grover, and Matthew Sobek. Integrated Public Use Microdata Series: Version 6.0 [Machine-readable database]. Minneapolis: University of Minnesota, 2015, the following samples: 1850 1%, 1860 1%, 1870 1%, 1880 1% 1900 1%, 1910 1%, 1920 1%, 1930 1%, 1940 1%, 1950 1%, 1960 5%, 1970 1% State FM1, 1980 5% State, 1990 5% State, 2000 1%, 2010 ACS, 2016-2020 ACS (shown here as 2018).
Maps, data development, calculations: James Gregory.