Article

Impacts of Heavy and Persistent Precipitation on Railroad Infrastructure in July 2021: A Case Study from the Ahr Valley, Rhineland-Palatinate, Germany

1
German Centre for Rail Traffic Research at the Federal Railway Authority, 01219 Dresden, Germany
2
Deutscher Wetterdienst, 63067 Offenbach, Germany
*
Author to whom correspondence should be addressed.
Atmosphere 2022, 13(7), 1118; https://doi.org/10.3390/atmos13071118
Submission received: 3 June 2022 / Revised: 12 July 2022 / Accepted: 12 July 2022 / Published: 15 July 2022

Abstract

:
In contrast to river floods, the enormous erosion potential in catchments contributes significantly to the extent of damage to infrastructure in valleys. This paper investigates the impact of the heavy precipitation event of 14–15 July 2021 on the railroad in the Ahr valley in Rhineland-Palatinate, Germany. In a first step, a detailed overview of the climatological and hydrological drivers using spatially high-resolved precipitation distribution and peak discharge modeling is provided, and the event is placed in a broader context by comparing it to past flash flood events from 1910 and 2016. In a second step, a detailed mapping of damages along the railroad line is performed using aerial photographs. The mapping revealed that bridges are the weakest point during a flood event and that they contribute to an increase and modification of the flood wave through backwater effects. Since flood events are expected to increase in the future, there is an urgent need to increase the resilience of transportation to this hazard and to answer the question of what magnitudes and return periods of events should be used in future sizing of rail infrastructure.

1. Introduction

River flooding is one of the most serious natural hazards worldwide. Recently, destructive flash floods caused by extreme rainfall during the period 12–15 July 2021 occurred in Germany, Belgium, Luxembourg and neighboring countries, with the areas along the rivers Ahr and Erft as well as the Vesdre in the basin of the Meuse being most severely affected [1]. In some valleys of the Eifel, western Germany, the flood was far more violent, faster and more unpredictable than previously thought possible for such an event in Central Europe [2]. According to Kreienkamp et al. [1], the flooding resulted in at least 184 fatalities in Germany, 38 in Belgium and caused considerable damage to infrastructure such as houses, communication facilities, roads and railway lines, making the event the deadliest European flooding event in nearly three decades and the costliest on record [3]. In case global warming reaches 2 °C, the 6th Intergovernmental Panel on Climate Change (IPCC) assessment report states that extreme precipitation and pluvial and fluvial floods will increase with high confidence in Western and Central Europe [4], meaning that floods caused by heavy precipitation can be expected more often and more severe in the future. In addition, it must be considered that even disregarding climate change, increasing land sealing and anthropogenic changes in river valleys can cause a further increase in floods. In this context, it is essential not only to consider water volumes, and to understand floods triggered by heavy precipitation not only as a phenomenon of too much fast-flowing water [2]. Instead, it is important to assess the erosion potential in the catchment area, because mobilization of large amounts of sediment and deadwood often leads to entrapments at narrow points, e.g., bridges. As a result, runoff is impeded, backwater occurs, and water can reach higher areas [5]. This aspect is particularly important in deeply incised valleys with narrow valley bottoms.
Transport infrastructure has a special role to play, as on the one hand it is affected by natural events, and on the other hand it can contribute to amplifying the effects of them. A functioning and efficient transportation system is a basic requirement for modern economy, supplying society with goods and services. Disruptions or breakdowns in the transportation system can result in potential fatalities, large replacement costs, loss of service even for extended periods, and reputational damage [6]. For instance, road closures left some places inaccessible for days for any forms of emergency response during the flooding event in July 2021 [1]. Otherwise, the artificial constructions of transport routes such as dams, tunnels and bridges can lead to the effects of natural processes being intensified. Bridge piers can lead to higher flood levels upstream, besides eddy currents and high flow velocities near piers can cause local erosion [5]. In turn, the collapse of bridges is often caused by the process of scouring [7]. In mountainous areas, main transport routes usually follow valley courses, reducing the often already limited potential floodplains. Slope cuts for route construction and the construction of tunnel portals, artificial embankments and slopes can interact with deep seated landslides (e.g., [8]) or lead to slope instabilities, thus increasing the potential for gravitational mass movements to occur [9]. In special cases, the means of transport itself represent the main triggering factor for the natural hazard, for example in case of embankment fires, which are frequently caused by fixed brakes [10,11].
The adaptation of transport infrastructure to climate-related natural hazards is a topical issue (e.g., [12]). This is especially true for railroad transport, which is particularly vulnerable to traffic disruptions compared to road transport due to its more complex infrastructure, rail-bound driving, relatively lower network density and thus fewer alternative routes [13]. However, it should be kept in mind that many railroad lines across Europe were constructed over 150 years ago [6]. Consequently, at that time infrastructure was not built in such a way that it is adapted to current climate change and furthermore does not meet the latest building standards. For instance, many railway embankments and slopes along railroad networks were constructed before modern design standard existed [6]. The used end tipping techniques with excessively steep slope angles makes them particularly vulnerable to slope failures during periods of prolonged or intense precipitation [14].
In this study, we examine the impact of the heavy precipitation event in July 2021 on the Ahr valley railroad in Rhineland-Palatinate, Germany. Large parts of the railroad were completely destroyed by the flood. In a first step, we provide a detailed overview of the climatological situation and the spatially highly resolved distribution of precipitation amounts in the catchment area and set up a simple hydrological model to estimate peak discharges. We place the event in a longer time frame and show differences and similarities to the flood events in the Ahr valley of 1910 and 2016. In a second step, we undertake a detailed mapping of the damage that occurred along the railroad line and address the question of the extent to which the railroad bridges contributed to the increase in the flood wave and the erosion potential.

2. Materials and Methods

2.1. Description of the Study Area

The Ahr, a tributary of the Rhine River, is a 85 km long river in the Rhenish Slate Mountains in Western Germany (Figure 1). The catchment area covers 897.5 km2 with its spring located in the High Eifel Mountains at an elevation of around 520 m asl and its confluence in the Rhine River in Sinzig at around 53 m asl. Although the average bottom slope of 0.4% at the middle and lower reaches is not very steep, parts of the catchment are above 600 m asl, so that the whole catchment area is pretty prone to surface runoff intensification [15]. The normal level of the gauge in Altenahr is 0.5 m [16]. Our study focusses on the lowest part between Ahrbrück and Sinzig, since a railroad line serves only this region (Figure 1). In this area, the Ahr valley can be divided into two different geomorphological units. The western part between Ahrbrück and Walporzheim is a canyon-like valley, as are most areas in the catchment upstream of the Ahr. The eastern part downstream of the village Walporzheim is formed as a wider flat river valley. A higher degree of settlement and sealing of the area can be observed in the eastern part. This is mainly due to the largest towns of the Ahr valley, Bad Neuenahr-Ahrweiler with approximately 25,000 residents and further downstream Sinzig with approximately 18,000 residents [17]. In the western part, there are considerably smaller towns with less than 2000 residents, namely Altenahr, Mayschoß (between bridges 6 and 7), Rech (downstream bridge 7), Dernau (upstream bridge 8) and Walporzheim.

2.1.1. Flood Events in the Ahr Valley

Due to the special topographic setting, flood events are common in the Ahr valley. Hence, regulation of the Ahr River started as early as 1880 and was completed before World War One [18]. Seel [18] listed historical flood events in the Ahr River and its tributaries for the time period 1348–1980. These total 75 flood events are equally distributed between summer half-year (May to October, 31 events) and winter half-year (November to April, 33 events) with 11 events missing a seasonal reference, suggesting that flood events in summer are a common phenomenon in the Ahr valley. Summer flood events are characterized by a rapid increase with high flow velocity and a fast decrease, while winter flood events swell more slowly and typically have a preliminary phase with high water levels and are of longer duration. Outstanding catastrophic events, based on the resulting damage, are those of 1601, 1804 and 1910, all of them summer floods finally triggered by thunderstorms. The Trierbach and the Adenauer Bach are usually the main drainage systems for the precipitation that triggers the floods. Roggenkamp and Herget [19] reconstructed peak discharges of historic floods and concluded that the flood events from July 1804 and June 1910 were larger than any recently gauged flood. The most recent flood event before 2021 occurred on 1–2 June 2016, with the highest gauge value measured to that date (3.71 m at Altenahr) [16]. This “century flood“ was caused by a sequence of violent storms with heavy precipitation. The extent of the damage reached historic dimensions, but people did not lose their lives [16]. The event from 14 July 2021 is unique in terms of its magnitude, as water levels reached their highest values since measurements began. The exact water levels are not known as all gauging stations along the Ahr River were damaged or destroyed by the flood wave; however, estimates showed water levels of about 7–8 m at gauge Altenahr [20]. The estimated discharge of 400–700 m3/s [20] is above the reconstructed discharge of the 1910 event (496 m3/s at gauge Altenahr) but below the 1804 event (1280 m3/s at gauge Dernau; value for gauge Altenahr not available) [19].

2.1.2. The Ahr Valley Railroad

The Ahr valley railroad connects the municipalities of the lower Ahr valley to the cities in the Middle Rhine valley. The Rheinische Eisenbahngesellschaft opened the first section of the line from Remagen to Ahrweiler on 18 September 1880 [21,22]. The line was continued to Altenahr on 1 December 1886 and to Adenau on 15 July 1888 [21]. Construction of a second track started in 1910. The flood event from 13 June 1910 swept away the scaffolding used to extend the line and, along with it and other flotsam, destroyed the construction worker’s canteens and numerous road bridges [18]. Thus, the expansion of the Ahr valley railway was delayed, but it was possible to resume operations from Remagen to Altenahr as early as 18 June 1910 [21,22]. The current line prior to the flood event in July 2021 is 29 km long and runs from Remagen to Ahrbrück. The route features five tunnels, and a total of 11 railway bridges cross the Ahr River. The railroad line is not electrified and is double-tracked only between Remagen and Walporzheim. The route of the former second railway track up the valley is used as a cycle path between Rech and Altenahr.
The railroad line between route kilometers 8 and 29 (i.e., between the stations Heimersheim and Ahrbrück) and seven of the bridges crossing the Ahr were completely destroyed by the flood event in July 2021, making a complete reconstruction necessary [23]. On 8 November 2021, the first part of the line between Remagen and Ahrweiler was reopened and extended to Walporzheim one month later [24]. However, the reconstruction of the section between Walporzheim and Ahrbrück will take several years [24].

2.2. Meteorological Description of Events

To place the July 2021 event in a larger context, meteorological and hydrological characteristics are compared to conditions during the flood events of June 1910 and June 2016. We focused on these two events because the June 2016 event was the largest event recorded by measuring systems and the June 1910 event is the largest reconstructed at a time when the railroad line already existed and for which meteorological and hydrological data are available. For a more detailed description of the hydrometeorological situation before and during the rainfall events, several data sources were investigated. For soil moisture, we used Germany-wide raster data of soil moisture under grass and sandy loam provided by Deutscher Wetterdienst (DWD) [25]. Soil moisture is determined and regionalized in the AMBAV model using multiple linear regression from meteorological parameters such as air temperature, total precipitation, wind and solar radiation [26]. The raster data have a spatial resolution of 1 × 1 km. Precipitation resources were hourly RADOLAN (Radar Online Adjustment) rasters of the radar based quantitative precipitation estimation with a resolution of 1 × 1 km for the 2016 and 2021 events. Area-wide, spatially and temporally evenly distributed radar measurements were combined with in situ precipitation measurements, taking advantage of both data sources [27,28]. For the 1910 event, daily precipitation values from stations were regionalized to a grid with a spatial resolution of 1 × 1 km using the HYRAS method [29]. The antecedent precipitation index (API) is a weighted summation of daily precipitation amounts over 21 days based on RADKLIM data [30], which could only be calculated for 2016 and 2021.
All three flood events are linked to a specific weather situation: Firstly, low air pressure dominates the upper troposphere. Secondly, a corresponding depression near the ground causes an increasingly unstable stratification of the troposphere. This situation is often connected with precipitation, especially in summer with severe thunderstorms and heavy rainfall. The situation is intensified by the inflow of warm and very humid air masses, usually from the Mediterranean region. A third important aspect is the topography. If the direction of the storm tracks is unfavorable, i.e., for the Eifel uplands from north (north-east) to south (south-west), then the air masses are additionally forced to rise because of the local orography (relief precipitation). In all three cases, a multiple of the precipitation amounts that would otherwise fall in an entire month (Figure 1) fell within a short period of time.
In the night of 12–13 June 1910, heavy thunderstorms in the upper Ahr catchment (i.e., the area between Hillesheim and Adenau including Nohner Bach, Trierbach and Adenauer Bach) led to high precipitation totals of up to 125 mm per day (Figure 2). Weather observers reported that most of the rainfall occurred within two and a half hours. Additionally, heavy rainfall with up to 30 mm in a few hours already affected the region the day before [31]. In the days from 27 May to 2 June 2016, recurring heavy rainfall in a similar region as in 1910 was the main cause of the flood (Figure 2). Although the single precipitation was not extreme, the weather situation persisted for six days. During this period, total precipitation amounts of up to 130 mm were measured. The flood’s trigger was then at least a single strong precipitation event. At the station Nürburg-Barweiler, more than 42 mm were recorded in just three hours on the evening of 1 June 2016 [32]. The period 12–15 July 2021 was characterized by a slow-moving depression, resulting in both recurrent and persistent heavy rainfall. This time, however, large parts of the Ahr catchment, especially the west and the north, were affected with precipitation totals of 70 to 100 mm per day [33] (Figure 2). In this case, an exceptionally warm Baltic Sea provided further energy and moisture supply, which led to exceptionally extreme precipitation. Models show a deviation of the sea surface temperature of Baltic Sea from the long-term mean of 4 to 7 K [34].
Figure 2 summarizes the moisture conditions and precipitation totals before the three flood events on different time scales. Soil moisture on the respective day prior to both the 2016 and 2021 events was very similar. High, but not exceptionally high soil moisture was observed, decreasing slightly from about 90–100% to 70–80% towards the northeastern part of the catchment. However, regarding the antecedent precipitation index (API) for the last 21 days and the precipitation totals for the last six days prior to both events, a larger amount of rain has fallen in 2016. In this year, the API reached partly values of 60 mm, and within the last six days before the event up to 100 mm of rainfall could be observed in parts of the catchment. In contrast, in 2021 the maximum value of the API was 40 mm and very isolated rainfall totals of 80 mm were reached within six days before the event. The largest amount of precipitation occurred in 2021 during the last 24 h before the event with up to 145 mm precipitation in some parts of the catchment. This is in some parts more than twice as much precipitation as in the same period before the 2016 event. Concerning the temporal evolution, the 1910 event was more similar to the 2021 event than the 2016 event, with less intense precipitation totals within six days before the event and high intensities during the last 24 h. In terms of spatial extent, it is notable that the flooding in 1910 was caused by one single extreme rainfall area covering two thirds of the Ahr catchment, located in the southern part over the catchment area of the Adenauer Bach. In parts of the area precipitation values of up to 125 mm within 24 h before the event were recorded. In June 2016, the triggering event was again concentrated in the southern part of the catchment but with considerably lower precipitation totals. The rainfall event in July 2021 covered almost the whole catchment area with highest values in the northern and western parts where the precipitation area moved parallel to the Ahr River.

2.3. Methods

2.3.1. Hydrological Investigations

To describe the hydrologic characteristics of the three flood events in 1910, 2016 and 2021, the accumulated potentially available runoff was derived from the particular distributed rainfall values in the catchment area. A digital surface model (DSM) based on laser scanning surveys provided by the Federal Agency for Cartography and Geodesy (Bundesamt für Kartographie und Geodäsie, BKG) with a resolution of 5 m was prepared and used for calculating flow direction and accumulation as well as the catchment boundaries and stream courses for the Ahr valley [35]. Distributed precipitation values were incorporated as weights in the flow accumulation to obtain the amount of potential runoff that had fallen in the catchment area above certain points in the valley. This allows the comparison of the determined accumulated precipitation values with the measured and reconstructed discharge values at the gauges and other relevant positions along the river course. The toolbox “Hydrology“ in ArcMap was used for the preparation of the DSM, while the pixel values were extracted and further analyzed with scripts in Python and R.
As input for the weighted flow accumulation, the same precipitation data was used as described in Section 2.2 and shown in Figure 2 [27,29]. The State Office for Environment Rhineland-Palatinate (Landesamt für Umwelt Rheinland-Pfalz, LfU RLP) operates several gauging stations on the Ahr River and its tributaries. Measured discharge values were available for the event in 2016 and as raw data values for the beginning of the event in 2021 [36]. During peak discharge in 2021, several gauging stations at the Ahr were destroyed and consecutive discharge values were reconstructed by the LfU RLP based on reported water levels and the nearest still measuring gauge stations [36]. Directly measured discharge values were not available for the 1910 event, but discharge values reconstructed from maximum water levels were obtained by Roggenkamp and Herget [19]. For better comparison with the maximum daily available data from 1910, mean daily averages were calculated for the events of 2016 and 2021 based on the data with higher temporal resolution when necessary.

2.3.2. Damage Mapping on the Railroad Line

The mapping of damages focused on the railroad infrastructure and fluvial morphological changes in the Ahr River in the lower part of the valley (Figure 1). Three aerial photographs taken at different times after the event were used for mapping (Figure 3): (1) aerial photograph from the German Aerospace Center (Deutsches Zentrum für Luft-und Raumfahrt, DLR), taken on 16 July 2021; hereafter referred to as “DLR_16.07.2021” [37]; (2) aerial photograph from the State Office for Surveying and Geographic Information Rhineland-Palatinate (Landesamt für Vermessung und Geobasisinformation Rheinland-Pfalz), taken on 24 July 2021; hereafter referred to as “RLP_24.07.2021” [38]; (3) aerial photograph from the Federal Agency for Cartography and Geodesy Bundesamt für Kartographie und Geodäsie), taken on 3 September 2021; hereafter referred to as “BKG_03.09.2021” [39]. Thus, damage and fluvial morphological changes could be derived for short and longer periods.
The mapping’s objective was to (1) record and classify the damage along the entire railroad line and (2) record the damage and river morphological changes at the 11 bridges in detail. The high-resolution data RLP_24.07.2021 served as the basis for the aerial photo analysis, whereas the other aerial photographs were additionally consulted for verification and possible change analysis. For the second question, a supplemental field survey was conducted on 23 March 2022 to verify the results of the aerial photography-based findings and document long-term changes in the riverbed. The mapped damages were compared to flood warning levels assigned to areas in the Ahr valley before the event. These include legally defined and reported floodplains as well as flood hazard maps issued and published by the Ministry for Protection, Environment, Energy and Mobility Rhineland-Palatinate [15]. These maps are calculated based on the return interval of flood events (usually for floods with a return period of 10, 100 or more years (extreme floods)) and discharge values that have been measured by gauging stations since recordings started. They are determined after specific examination and consideration by the responsible authorities, and serve to inform the public and show specific risks and hazards (e.g., expected water depths). Figure 4 gives an overview of the structure of the analysis and used datasets as well as intermediate results used for the conclusions.

3. Results

3.1. Hydrology of the Three Flood Events

The calculated accumulated precipitation values of the whole catchment above and the discharge values at the gauging station Altenahr are shown in Figure 5. In 1910, the highest precipitation values were reached on the day before peak discharge, leading to an average discharge value of 496 m3/s. Similar to 1910, in 2021 the largest proportion of the precipitation occurred one day before peak discharge causing discharge comparable to 1910 (991 m3/s, reconstructed by LfU [36]) and surpassing the discharge level of the 2016 event. The amount of precipitation one day before the event in 2016 was significantly less than the other two events but several precipitation events occurred within six days before the event. Peak discharge value in 2016 was 236 m3/s and hence was the highest value measured at the gauging station Altenahr up to that time. Supplementing Figure 5, Table 1 summarizes peak discharge and water levels derived from various sources. The estimated peak discharge between Rech and Dernau is much higher than that of Altenahr in 2021. In terms of water level, the 2021 event is more comparable to the 1804 event than to the 1910 event.
The time lag between the occurrence of the greatest amount of precipitation and the peak discharge value for the 2021 event for various gauging stations on the Ahr River and selected tributaries is shown in Figure 6 (for locations of gauging stations and tributaries see Figure 1). The increase in discharge first reached the gauging stations in the upper catchment area, Kirmutscheid, Kreuzberg and Müsch, due to the short distance between precipitation area and streams. In Kreuzberg and Müsch, the time lag between precipitation and flood event were especially short with 2.9 h and 4.4 h, respectively (Table 2). The gauging stations in Niederadenau and Denn, although equally located in the upper catchment area, received less discharge with a larger time difference between precipitation and discharge peak, because they are located on the southern part of the Ahr catchment that received significantly less rainfall. At the gauging stations of the lower Ahr, Altenahr and Bad Bodendorf, the peak discharge arrives around 8 and 10 h after the peak of the rainfall event and approximately 6 and 8.5 h after the first peak discharge was measured at the first gauging station in Kirmutscheid in the evening of 14 July 2021.

3.2. Damage Mapping

3.2.1. Entire Railroad Line
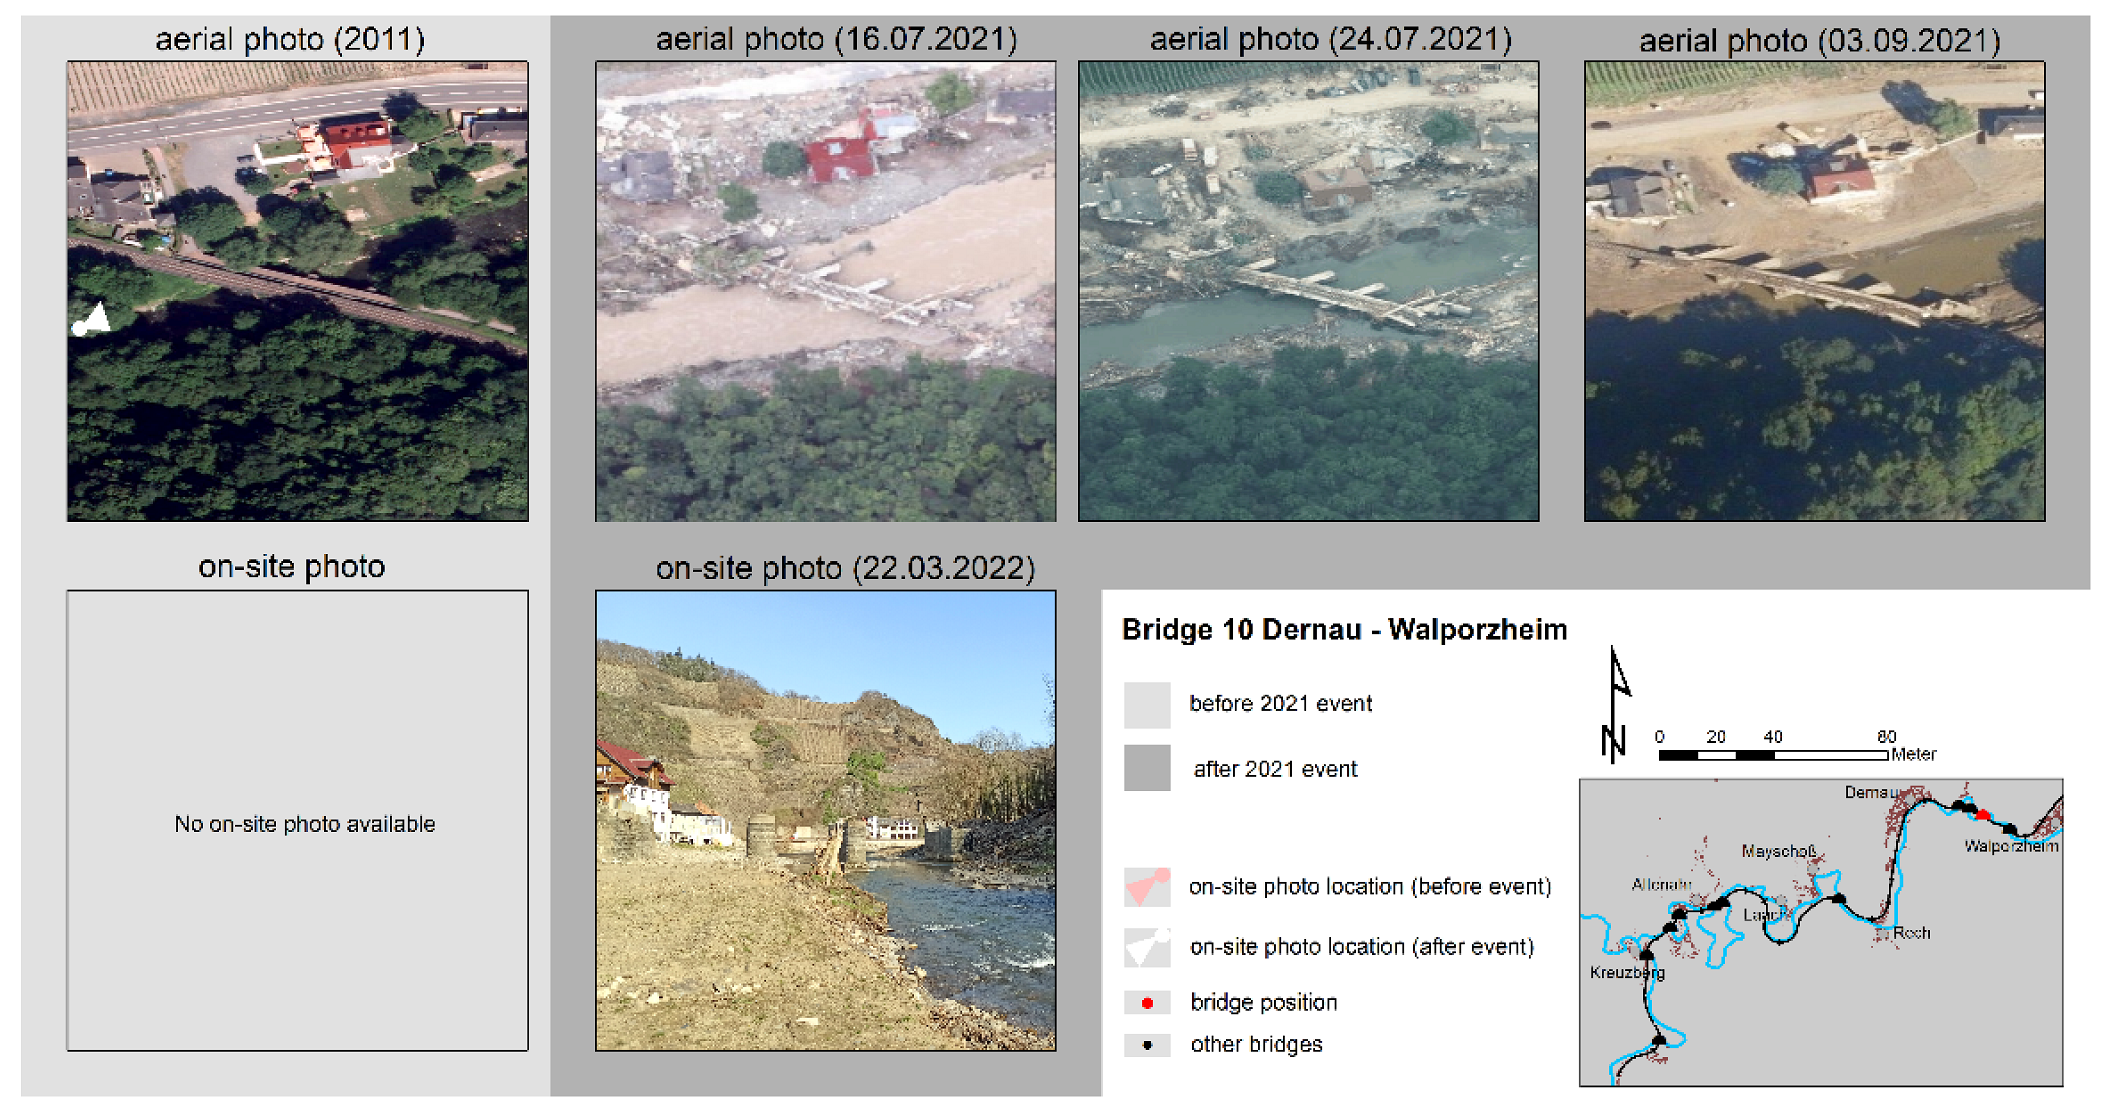
The damage mapping for the entire railroad line based on the aerial photograph RLP_24.07.2021 is shown in Figure 7. The extent of damage was divided into five categories based on the damage categories used by the Copernicus Emergence Mapping Services in their flood mapping monitoring. Since the aerial photographs were taken shortly after the event, some sections of the line were still buried, so the degree of damage could not be determined. This fact is reflected in the category “possibly damaged”, which represents 8.3% of the total track (Figure 7). The category “not determinable” includes the tunnel sections that comprise 2.1% of the total distance. In total, around one third of the total railroad line is damaged (categories “destroyed”, “damaged” and “possibly damaged”) with a concentration of damages in the western section between Ahrbrück and Walporzheim (64% of this section). Here, the railroad runs close to the river most of the time and through designated flood zones for several kilometers. All of the 11 railroad bridges crossing the Ahr River are located in this section, where the course of the Ahr River is strongly meandering. Downstream from Walporzheim the widening of the Ahr valley made it possible to construct the railroad line at greater distance from the river. Hence, the overlap of the railroad line with designated flood zones is smaller than upstream of Walporzheim. Only the station of Heimersheim is located close to the river and was completely destroyed by the flood. Track sections categorized as “destroyed” and “damaged” are mainly located between Ahrbrück and Walporzheim, especially nearby bridges. A particularly severely affected area is located southwest of Mayschoss in the so-called “Laacher Bogen”, where the railroad line runs directly along the cut bank of the meander bend (Figure 8g). Strong lateral erosion has taken place there, so that the base of the slope on which the railroad line ran has been completely eroded in places, and the slope edge has shifted several meters in a southwesterly direction.
A closer look at the rail sections that are located in designated floodplains and flood-prone areas shows that the majority have indeed been damaged or destroyed (Figure 7c). Only a small percentage of track sections in the warning areas has not been classified as damaged based on the aerial photographs, so the warning maps have been tragically confirmed in this regard. However, an even larger portion of damaged or destroyed tracks were in areas without warning levels, as the 2021 flood event exceeded the flood levels used to calculate warning areas.

3.2.2. Bridges

The Ahr valley railroad crosses the Ahr River a total of 11 times. Most of these bridges (seven) are arch bridges, two have concrete rolled girders, and one each is a truss and a steel bridge (Table 3; Appendix A). The oldest bridge dates back to 1907, the youngest are the two rolled girder bridges activated in 1951. The bridge lengths range from 52 to 91 m. With eight out of 11, a cycle path bridge accompanied the majority of the bridges.
Only for three bridges no damage was visible in the aerial photograph taken shortly after the event. The more detailed view during the field survey in March 2022, however, revealed that piers were damaged (bridge 8) and stone slabs were removed from the bridge (Figure 8d). Four of the bridges had been completely removed at the time of the field survey, and only the piers remained on two bridges. Verification of the track body’s condition derived from the aerial photographs could not be carried out in the field, because the tracks surrounding the bridges had already been removed over a large area at the time of the field survey.
The greatest destruction and bridge failures occurred mainly in the peripheral areas. Only one bridge (bridge 10) had a pier in the middle of the riverbed more severely affected than the edge areas, so this pier was removed while the other piers are still in place (Figure 8e). The piers of two other bridges (bridges 2 and 8) with visible damage upstream are currently located in the river bed, but this is due to the widening of the river bed as a result of the flood event (Figure 8d). Prior to the event, they were located on the riverbank. Seven of the bridges are constructed on meandering parts of the river. The greatest destruction is not on the cut bank of the meander loop, as one might expect, but on six out of these bridges on the slip-off slope. A special situation occurred at bridge 6. Discharge conditions near the bridge were altered during the flood event because parts of the discharge (according to personal communication with Michael Göller estimated to be about 10%) were rerouted through the road tunnel when water levels reached the road level and rejoined the river just upstream of the bridge (Figure 9). This changed the morphological situation, i.e., the “normal” slip-off slope became the cut bank and vice versa. Furthermore, it must be taken into account that the Ahr valley is a landscape strongly altered by humans in past and present, which in turn influences the fluvial processes. In addition to the railroad line, roads also run through the valley, leading to a further narrowing of the area available to the river. Narrow sections of the valley can be particularly susceptible to erosion processes during flooding events. A special situation exists at bridges 7, 9 and 11, where on the orographic left bank of the river, the railroad line meets the federal highway at an acute angle. It is precisely at this point that bridge failure and large-scale erosion of railroad embankments and, in some cases, the road’s retaining walls occurred (Figure 8f).
Visual analysis of the flow path of the Ahr River during the flood event showed that the water mostly found its way on both sides of the bridges, especially at the upstream bridges. At the bridges further downstream, the river bed was mostly shifted to one side. The widening of the river bed was still visible at five bridges on the day of the field survey. In the immediate vicinity of each bridge, traces of lateral erosion could be observed, mostly on both banks and in different material (gravel, meadow, retaining walls). The slope cuttings and torn out rock slabs prove the enormous erosion potential of the flood wave. Deep erosion of gravel areas downstream of the bridge occurred at two bridges (3 and 9). Detection of new accumulation areas during the field survey proved difficult due to extensive construction in and along the river bed. At two bridges, new gravel areas could be observed in the river bed downstream of the bridge. The accumulation of alternative material during the flood event (trees, cars, campers) was mainly a phenomenon at the bridges further upstream, especially at bridges 1, 2 and 4.

4. Discussion

4.1. Classification of the 2021 Event in Meteorological and Hydrological Terms

According to Kreienkamp et al. [1], a precipitation event like July 2021 is expected on average approximately every 400 years in the current climate for a given location within the studied larger region of middle or Western Europe. Of course, a single extreme event can never be caused by climate change, but attribution research shows that climate change likely amplified the event [1]. However, with further increases in greenhouse gas concentrations and earth surface temperatures such heavy precipitation events will probably occur more frequently. The event was characterized by a large area of precipitation with widespread high precipitation totals. Considering the extremity of an event on the basis of the methods of Müller and Kasper [42], it is to be assessed as one of the most extreme events observed in Germany so far.
Flood hazard maps are usually based on measured water level values. From these, the limit values for flood events with a certain probability of occurrence (HQ10, HQ100) and the definition of extreme flood events are derived. The June 2016 flood event was a flood of the century (HQ100) according to the gauge records, but the maximum values measured were significantly lower than the values of the July 2021 event. In case of the Ahr, therefore, the actual possible heights of flood waves were significantly underestimated. That the July 2021 flood event is not an isolated occurrence is shown by the reconstructions of water levels by Roggenkamp and Herget [41] with comparable values for the 1804 and 1910 events. For two other events in the last approximately 200 years (June 1888 and January 1918), the reconstructed discharges were also above the measured maximum of the 2016 event. Hydrological data that include historical data would therefore lead to different limits and show a different picture within the flood hazard maps. Of course, it must be taken into account that the reconstruction of historic events requires resources, reconstructed gauge values may only be available for individual rivers and individual events, and flood hazard maps at the federal state or state level are produced using a uniform methodology for all rivers and catchments. However, a reference to existing reconstructed data would be useful in order to better assess what is actually possible in terms of gauge values on specific rivers in order to be better prepared for such extreme events.
The hydrology of flash floods is different from those of river floods, because erosion and transport of floating debris cause substantial blocking and backwater effects and strongly alters flow properties. A detailed analysis of Korswagen et al. [43] on buildings in the Ahr valley found that structural failure due to hydrostatic flood pressure was observed in very few cases, while most severe structural damage was caused by erosion and damming of debris. However, only a few studies on the impact of large wood in rivers exist (e.g., [44,45]), and the feedback between large-scale debris of anthropogenic origin and fluvial geomorphology is still an open question. Hence, the modification of flood waves and flow properties by entrained material has been insufficiently considered in the preparation of flood hazard maps and protection measures [46]. With this background knowledge, the observation that many large objects such as trees, cars, and mobile homes were swept away by floodwaters during the 2021 event and the fact that the flood was an extremely rare event in terms of magnitude, it is not surprising that parts of the railroad line that were outside the flood-prone areas were also destroyed.

4.2. Damages on the Railroad Line and Interactions between Transport Infrastructure and the 2021 Flood Event

As discussed in Section 4.1, the event was meteorologically an extremely rare one with a return period of 400 years [1]. Railroad infrastructure cannot be prepared for all possible events and be completely resilient towards such extreme events. It is therefore necessary to define for events of which magnitude and with which probability of occurrence railroad lines should be designed. Especially in case of flood events, the situation is very complex because the railroad infrastructure company and the railroad operator are not responsible for the conditions in the catchment area outside the railroad premises. In this context, changes in the catchment area that reduce infiltration capacity play a crucial role in flood generation. Therefore, when flood events exceed expected or planned levels, the options available to rail operators are very limited. The Ahr valley is a strongly anthropogenically shaped landscape in which only few retention areas are available for the Ahr. Due to the flood event, old flow paths were reactivated, e.g., a former oxbow around a rock near Altenahr-Altenburg, and anthropogenically created structures were used as new flow paths, e.g., the road tunnel near Altenahr between bridges 5 and 6 (Figure 9) and a rock cut of the former line alignment near Laach (Figure 8h). These new flow paths changed the flow conditions in the downstream river and created new areas of deposition and erosion, which is particularly evident at bridge 6. Shortening the flow path cancels out the positive contribution of meanders to reducing peak discharge attenuation [47]. The choice of routing for a transport infrastructure can thus not only be affected by a flood event, but the transport route itself can contribute significantly to modifying the flood wave. Therefore, various aspects such as flood protection, spatial planning and railroad infrastructure planning must be considered as a whole. Some sections of the Ahr valley railroad run directly through flood-prone areas, where they are built on embankments. These artificial embankments as well as the track itself often consist of easily mobilizable material, so that they represent an easily erodible bedload potential in case of a flood event. Complete erosion of the railroad embankments could be observed at several locations. Since lateral erosion is an important process of solids mobilization (e.g., [46]), it is therefore of great importance to design structures for bank protection in such a way that the erosion potential is minimized as far as possible and that construction and dimensioning are adapted to a possible overflow.
Bridges generally reduce the cross-section available for flow and are therefore a very critical point during flood events. The Ahr valley has a high density of bridges. Additionally to the 11 railroad bridges studied, there are 20 other bridges located in the same section of the Ahr valley. Some of them are located in the immediate vicinity of the railroad bridges, so that it is not possible to assign the observed damage and river morphological changes exactly to one bridge as the causative factor. However, particularly noteworthy here is that only at the railroad bridges an extreme backwater of material could be observed, which is all the stronger the smaller the flow cross-section. As soon as the river flows over the bridge, a self-reinforcing effect occurs, since this drastically reduces the drag force in the culvert and thus the force is no longer sufficient to transport the accumulating bedload further [48]. We observed a particularly strong backwater effect at the arch bridges. The arch bridges of the Ahr valley railroad have a rough underside, which favors channel clogging [48]. Congestion then causes the river to seek new flow paths outside the riverbed, which can result in destruction within areas that are far from the riverbed under normal flow conditions. If the enlargement becomes dislodged, the flood wave can cause great destruction downstream with effects similar to those of a dam failure [49]. To reduce backwater effects during future flood events, the deposition of flotsam and debris should be considered when sizing culverts. However, larger bridge openings require long approach ramps for railroad tracks [46], which can lead to space problems in narrow valleys. Thus, when a new bridge is built, a first step could be to consider whether the bridge should be rebuilt at the same location or whether there may be more suitable locations. In addition, a detailed fluvial morphological and hydrological analysis can help to identify critical sites and select suitable locations for new structures. The special hydromorphodynamic conditions during flood waves must be taken into account when dimensioning structures, because, as shown in our study, normal flow conditions can be reversed by impoundment effects and the creation of new flow paths, i.e., the greatest erosion potential may be located on the slip-off slopes instead of on the cut banks. Another protective measure is the demolition of unused bridges if they contribute to the hazard. This happened, for example, in 2016 in the Ahr valley with a railroad bridge on the disused section upstream of Ahrbrück, where there was a strong backwater effect [50].
Among natural causes, extreme floods are one common reason for bridge collapse [51]. Of the total 112 bridges in the Ahr valley, only 35 were fully usable after the flood event and 17 were of limited use [52]. In our detailed analyses of the 11 railroad bridges, it was noticeable that in almost all cases the greatest damage to bridges occurred on the river banks through undercutting and scouring of the foundations, erosion of the abutments and bank failure. The edge areas of bridges are particularly susceptible to flood damage, and this should be taken into account during bridge construction. Similar observations were made by Koks et al. [53]. The authors stated that the interface stability between water, soil and foundation elements was found to be compromised at almost all bridge damage location visited.
In the Germany-wide rail network, the Ahr valley railroad is of secondary importance, as it does not connect any major centers, is not located on any important national or international transport corridor, and is geared only to local passenger transport. However, other parts of the Germany-wide route network also run through low mountain ranges and along rivers with similar topographic and hydrologic features, so they potentially can be affected as well by heavy precipitation-related flood events, which can occur anywhere in Germany [54]. An event with similar effects on the regional rail infrastructure occurred in August 2002 in the Erzgebirge [46]. Of course, the findings from the Ahr valley cannot be transferred 1:1 to other regions and routes due to the special topography and the intensity of the triggering event, but we would like to use this study to raise awareness of the impact of heavy precipitation events on railroad infrastructure. Reconstruction of destroyed rail lines, for example, offers the opportunity to design culverts and bridges differently to better withstand future extreme events. In addition, Koks et al. [53] emphasize the importance of local-scale studies as a complement to large-scale studies for better understanding of the real impacts on critical infrastructure.

4.3. Comparison of Damages on the Railroad for the 1910, 2016 and 2021 Flood Events

It is difficult to compare historic flood events with actual events, since the magnitude of a flood wave strongly depends on the conditions in the catchment area and along the river course, e.g., land use, degree of sealing, proportion of settled areas, river regulations. Roggenkamp and Herget [19] stated that it is a future challenge to investigate the likely modern level of an event such as 1804 or 1910, because the peak levels of historic flood events would, most likely, be higher with the current structure in the Ahr valley. However, some similarities exist between 1910 and 2021. Regulation of the Ahr river started as early as 1880 and was completed before World War One [18]. The Ahr valley railroad was finalized in 1888, and the route did correspond to today’s course in many places [55]. The two events are also comparable in meteorological and hydrological terms. Therefore, it makes sense to compare the damage to the railroad line for both events. There are no detailed mappings and aerial photographs of the 1910 event, but references and information about the event can be found in literature. For the 2021 event, the damming effect at bridges, among others by mobile homes, is mentioned as a factor that clearly contributed to the increase of the flood wave. In 1910, there were no campsites with caravans in the Ahr valley, but damming effects are also mentioned there, so material had to be available [22]. At the time of the June 1910 flood event, the double-track expansion of the Ahr valley railroad was in full swing. Workers’ shacks and construction cranes near the river were washed away by the Ahr and caused backups at bridges [18]. However, the reopening of the railroad line took place on 18 June 1910, only five days after the event [21,22], which means a much shorter recovery time than today. Only the resumption of work on the new line was delayed for a longer period [21].
Why the damage was so much greater in 2021 than in 1910 cannot be explained definitely by this study. However, one clue could be the different spatial distribution of precipitation events (see Figure 2). The focus in 2021 was on the northern catchment, accordingly the tributaries’ contribution to the north regarding the Ahr’s total runoff is larger than the contribution of those to the south (Figure 6). This is also confirmed by the runoff reconstructions of Roggenkamp and Herget [41]. In contrast, during the 1910 flood event, most of the total runoff was generated at the southern tributaries Adenauerbach and Trierbach [18]. Thus, different parts of the catchment were affected by the triggering event. In addition, properties throughout the catchment have changed significantly over the past 100 years. This relates to settlement area, proportion of forest land, and flood control measures. Büchs [56] also mentions changes in vineyard management as an important reason for the changed runoff behavior during precipitation. As part of land consolidation in the 1970s, very steep large terraces with high concreted walls were created, through which the water is drained away in steep drainage channels. The original small terraces enclosed by dry stone walls were much flatter and more graded, allowing surface water to drain much more slowly. However, in order to make accurate statements about the causes of the different damage potential of the two events, large-scale land use change mapping in the Ahr catchment is necessary. Interestingly, reconstructions of peak discharges by Roggenkamp and Herget [41] show that flood waves reached the magnitude of the July 2021 event before anthropogenic influences, more precisely during a flood event in July 1804 triggered by a heavy precipitation event after days of persistent precipitation [57]. From this, Roggenkamp and Herget [41] concluded that anthropogenic changes in the Ahr valley cannot be considered as causative for the extreme flood magnitude in July 2021, but may simply have caused a further amplification.
The flood event of June 2016 is more comparable with regards to the characteristics in the catchment area. Despite significantly lower discharge values than in 2021, considerable damage occurred in the municipalities of Altenahr and Adenau and the city of Bad Neuenahr-Ahrweiler [58]. In Altenahr, the Ahr River flowed through the road tunnel as observed for the 2021 event [16]. This shows that the measures implemented as part of a nature conservation project on the upper Ahr from 2007 (more space for the Ahr in the upper reaches, sturgeon stones and riperian planting in the estuary area of the tributaries for greater dynamics and flow diversity) have not been sufficient as protective measures against a flood of the century [56]. The 2016 flood event did not cause any damage to the Ahr valley railroad, so that operations did not have to be interrupted. Thus, the railroad line has been prepared for an event of this magnitude.

5. Conclusions

This paper investigated the impact of the heavy precipitation event of July 2021 on the railroad in the Ahr valley by combining hydrological methods and damage mapping based on aerial photographs. The study has shown that bridges are a weak point in case of a flood event. On the one hand, they contribute to an increase in the flood wave due to the backwater effect, and on the other hand, they are the most severely damaged parts of the railroad line in our case study. Due to the time-consuming reconstruction work, it takes several years for the Ahr valley railroad to be put back into operation.
Reconstruction of the destroyed railroad lines can be seen as an opportunity to make the entire railroad infrastructure more resilient to climate. It is particularly important to build bridges more resilient to flood events, e.g., by using slimmer bridge structures without center piers in the riverbed. The recommendations cannot be validated with this study, but can be addressed in further studies. Special attention should be given to how culverts and railroad embankments should be sized for events of what magnitude so that they can be enlarged or elevated if necessary. It would be of great benefit if the observations of this study regarding the different flood events initiate a technical regulatory discussion of this circumstance.
This study aims to inspire further investigations in appropriate flood warning levels and infrastructure design. A flood with a magnitude similar to the 2021 event has occurred on the Ahr about every 100 years over the past 200 years (1804, 1910, 2021), thus these events are not extremely rare. Based on the investigations of this study, it would be advisable to include those flood events in the designation of flood-prone zones and to develop corresponding recommendations for action for infrastructure and buildings located in these areas.

Author Contributions

Conceptualization, S.S., F.B. (Fabia Backendorf), F.B. (Frederick Bott) and K.F.; methodology, S.S. and K.F.; software, K.F., T.J. and E.W.; formal analysis, S.S., F.B. (Fabia Backendorf), F.B. (Frederick Bott), K.F., T.J. and E.W.; data curation, F.B. (Frederick Bott), K.F., T.J. and E.W.; writing—original draft preparation, S.S.; writing—review and editing, S.S., F.B. (Fabia Backendorf), F.B. (Frederick Bott), K.F., T.J. and E.W.; visualization, F.B. (Frederick Bott), K.F. and E.W. All authors have read and agreed to the published version of the manuscript.

Funding

This study was funded by the German Federal Ministry for Digital and Transport (BMDV) in the context of the BMDV Network of Experts.

Institutional Review Board Statement

Not applicable.

Informed Consent Statement

Not applicable.

Data Availability Statement

Publicy available datasets were analyzed in this study. This data can be found here: climate data: https://opendata.dwd.de, accessed on 30 May 2022; hydrological data: https://www.hochwasser-rlp.de, accessed on 4 May 2022; aerial photographs: https://gdz.bkg.bund.de/index.php/default/webdienste/digitale-orthophotos/wms-digitale-orthophotos-bodenauflosung-20-cm-wms-dop.html, accessed on 4 May 2022, https://arcgis.bbk.itzbund.de/arcgis/apps/sites/#/hochwasser2021, accessed on 18 October 2021, https://www.geoportal.rlp.de/map?WMS=73160, accessed on 7 October 2021.

Acknowledgments

The authors thank the Landesamt für Umwelt Rheinland-Pfalz and Michael Göller for the provision of gauge station data, helpful background information on flood events in the Ahr valley and a photograph of bridge 5, which was provided with kind permission, the citizens reporting the flood levels later used for reconstruction water discharge, and Michael Below (Deutsche Bahn AG) and Benjamin Schmitz (DB Netz AG) for background information on railroad issues.

Conflicts of Interest

The authors declare no conflict of interest.

Appendix A

Figure A1. Photo documentation of bridge 1. Data source of aerial photos: [37,38,39,40].
Atmosphere 13 01118 g0a1
Figure A2. Photo documentation of bridge 2. Data source of aerial photos: [37,38,39,40].
Atmosphere 13 01118 g0a2
Figure A3. Photo documentation of bridge 3. Data source of aerial photos: [37,38,39,40].
Atmosphere 13 01118 g0a3
Figure A4. Photo documentation of bridge 4. Data source of aerial photos: [37,38,39,40].
Atmosphere 13 01118 g0a4
Figure A5. Photo documentation of bridge 5. Data source of aerial photos: [37,38,39,40].
Atmosphere 13 01118 g0a5
Figure A6. Photo documentation of bridge 6. Data source of aerial photos: [37,38,39,40].
Atmosphere 13 01118 g0a6
Figure A7. Photo documentation of bridge 7. Data source of aerial photos: [37,38,39,40].
Atmosphere 13 01118 g0a7
Figure A8. Photo documentation of bridge 8. Data source of aerial photos: [37,38,39,40].
Atmosphere 13 01118 g0a8
Figure A9. Photo documentation of bridge 9. Data source of aerial photos: [37,38,39,40].
Atmosphere 13 01118 g0a9
Figure A10. Photo documentation of bridge 10. Data source of aerial photos: [37,38,39,40].
Atmosphere 13 01118 g0a10
Figure A11. Photo documentation of bridge 11. Data source of aerial photos: [37,38,39,40].
Atmosphere 13 01118 g0a11

References

  1. Kreienkamp, F.; Philip, S.Y.; Tradowsky, J.S.; Kew, S.F.; Lorenz, P.; Arrighi, J.; Belleflamme, A.; Bettmann, T.; Caluwaerts, S.; Chan, S.C.; et al. Rapid attribution of heavy rainfall events leading to the severe flooding in Western Europe during July 2021. World Weather Attrib. 2021, 54. Available online: https://www.worldweatherattribution.org/wp-content/uploads/Scientific-report-Western-Europe-floods-2021-attribution.pdf (accessed on 16 December 2021).
  2. Dietze, M.; Öztürk, U. A flood of disaster response challenges. Science 2021, 373, 1317–1318. [Google Scholar] [CrossRef] [PubMed]
  3. Aon. Global Catastrophe Recap: July 2021; Aon-Report: London, UK, 2021; 19p. [Google Scholar]
  4. Masson-Delmotte, V.; Zhai, P.; Pirani, A.; Connors, S.L.; Péan, C.; Berger, S.; Caud, N.; Chen, Y.; Goldfarb, L.; Gomis, M.I.; et al. (Eds.) IPCC. Climate Change 2021: The Physical Science Basis. Contribution of Working Group I to the Sixth Assessment Report of the Intergovernmental Panel on Climate Change; Cambridge University Press: Cambridge, UK, 2021; in press. [Google Scholar]
  5. Wang, W.; Zhou, K.; Jing, H.; Zuo, J.; Li, P.; Li, Z. Effects of Bridge Piers on Flood Hazards: A Case Study on the Jialing River in China. Water 2019, 11, 1181. [Google Scholar] [CrossRef] [Green Version]
  6. Palin, E.J.; Stipanovic Oslakovic, I.; Gavin, K.; Quinn, A. Implications of climate change for railway infrastructure. Wiley Interdiscip. Rev. Clim. Change 2021, 12, e728. [Google Scholar] [CrossRef]
  7. Gavin, K.; Prendergast, L.; Stipanovic, I.; Skaric-Palic, S. Recent developments and remaining challenges with the use of vibration based scour in determining unique scour performance indicators. Balt. J. Road Bridge Eng. 2018, 13, 291–300. [Google Scholar] [CrossRef]
  8. Vassallo, R.; Mishra, M.; Santarsiero, G.; Masi, A. Interaction of a railway tunnel with a deep slow landslide in clay shales. Procedia Earth Planet. Sci. 2016, 16, 15–24. [Google Scholar] [CrossRef] [Green Version]
  9. Rachoy, C.; Scheikl, M. Anthropogenic caused mass movements and their impact on railway lines in Austria. In Disaster Mitigation of Debris Flows, Slope Failures and Landslides; Marui, H., Mikoš, M., Eds.; Universal Academy Press: Tokyo, Japan, 2006; pp. 639–643. [Google Scholar]
  10. Fusco, E.J.; Abatzoglou, J.T.; Balch, J.K.; Finn, J.T.; Bradley, B.A. Quantifying the human influence on fire ignition across western USA. Ecol. Appl. 2016, 26, 2390–2401. [Google Scholar] [CrossRef] [Green Version]
  11. Zhang, Z.X.; Zhang, H.Y.; Zhou, D.W. Using GIS spatial anaylsis and logistic regression to predict the probabilities of human-caused grassland fires. J. Arid Environ. 2010, 74, 386–393. [Google Scholar] [CrossRef]
  12. Koks, E.; Rozenberg, J.; Zorn, C.; Tariverdi, M.; Vousdoukas, M.; Fraser, S.A.; Hall, J.W.; Hallegatte, S. A global multi-hazard risk analysis of road and railway infrastructure assets. Nat. Commun. 2019, 10, 2677. [Google Scholar] [CrossRef] [Green Version]
  13. Mattson, L.-G.; Jenelius, E. Vulnerability and resilience of transport systems—A discussion of recent research. Transp. Res. Part A Policy Pract. 2015, 81, 16–34. [Google Scholar] [CrossRef]
  14. Reale, C.; Gavin, K.; Martinovic, K. Analysing the effect of rainfall on railway embankments using fragility curves. In Proceedings of the 7th Transport Research Arena TRA 2018, Vienna, Austria, 16–19 April 2018. [Google Scholar]
  15. Ministerium für Klimaschutz, Umwelt, Energie und Mobilität Rheinland-Pfalz (MKUEM). Gefahrenkarten und Überflutungsflächen für HQ10, HQ100 und HQextrem (HQ200). 2021. Available online: https://hochwassermanagement.rlp-umwelt.de/servlet/is/200041/ (accessed on 4 May 2022).
  16. Kempenich, J. Verheerende Unwetter mit historischen Dimensionen. Heim. Des Kreises Ahrweiler 2017, 16–20. Available online: https://relaunch.kreis-ahrweiler.de/kvar/ (accessed on 10 December 2021).
  17. Statistisches Landesamt Rheinland-Pfalz. Datentabelle: Bevölkerungsstand 31.12.2020. 2022. Available online: http://geodaten.statistik.rlp.de/mapbender/stala/showdatasheet.php?lingo=deutsch&tab_id=258 (accessed on 31 May 2022).
  18. Seel, K.A. Die Ahr und ihre Hochwässer in alten Quellen. Heim. Des Kreises Ahrweiler 1983, 40, 91–102. [Google Scholar]
  19. Roggenkamp, T.; Herget, J. Reconstructing peak discharges of historic floods of the river Ahr, Germany. Erdkunde 2014, 68, 49–59. [Google Scholar] [CrossRef]
  20. Schäfer, A.; Mühr, B.; Daniell, J.; Ehret, U.; Ehmele, F.; Küpfer, K.; Brand, J.; Wisotzky, C.; Skapski, J.; Rentz, L.; et al. Hochwasser Mitteleuropa, Juli 2021 (Deutschland). CEDIM Forensic Disaster Analysis Group Bericht Nr. 1 “Nordrhein-Westfalen & Rheinland-Pfalz”; Karlsruher Institut für Technologie (KIT): Karlsruhe, Germany, 2021. [Google Scholar] [CrossRef]
  21. Kemp, K.E. Am 17. September 1880 fuhr die erste Eisenbahn von Remagen nach Ahrweiler—Der Bau der Ahrtalbahn. Heim. Des Kreises Ahrweiler 1980, 4–12. Available online: https://relaunch.kreis-ahrweiler.de/kvar/ (accessed on 6 January 2022).
  22. Schönewald, H. Die Geschichte der Ahrtalbahn; Gaasterland Verlag: Jünkerath, Germany, 2020; 128p. [Google Scholar]
  23. Eisenbahn Verkehrsnachrichten (EVN). Bundesverkehrsministerium: Kaputte Brücken und Gleise Schnell Wieder Instandsetzen. 2021. Available online: https://bahnblogstelle.net/2021/07/19/bundesverkehrsministerium-kaputte-bruecken-und-gleise-schnell-wieder-instandsetzen/ (accessed on 7 January 2022).
  24. Eisenbahn Verkehrsnachrichten (EVN). Nach Flutkatastrophe: Zugverkehr im Ahrtal Rollt Wieder. 2021. Available online: https://bahnblogstelle.net/2021/11/08/nach-flutkatastrophe-zugverkehr-im-ahrtal-rollt-wieder/ (accessed on 7 January 2022).
  25. DWD Climate Data Center (CDC). Daily Grids of Soil Moisture under Grass and Sandy Loam, Version 0.x. 2022. Available online: https://opendata.dwd.de/climate_environment/CDC/grids_germany/daily/soil_moist (accessed on 30 May 2022).
  26. Löpmeier, F.-J. Berechnung der Bodenfeuchte und Verdunstung mittels agrarmeteorologischer Modelle. Z. Für Bewässerungswirtschaft 1994, 29, 157–167. [Google Scholar]
  27. DWD Climate Data Center (CDC). Recent Hourly RADOLAN Grids of Precipitation Depth (binary), Version 2.5. 2022. Available online: https://opendata.dwd.de/climate_environment/CDC/grids_germany/hourly/radolan/historical/bin/ (accessed on 30 May 2022).
  28. Winterrath, T.; Rosenow, W.; Weigl, E. On the DWD quantitative precipitation analysis and nowcasting system for real-time application in German flood risk management. IAHS-AISH Publ. 2012, 351, 323–329. [Google Scholar]
  29. Rauthe, M.; Steiner, H.; Riediger, U.; Mazurkiewicz, A.; Gratzki, A. A Central European precipitation climatology—Part 1: Generation and validation of a high-resolution gridded daily data set (HYRAS). Meteorol. Z. 2013, 22, 235–256. [Google Scholar] [CrossRef]
  30. Winterrath, T.; Brendel, C.; Hafer, M.; Junghänel, T.; Klameth, A.; Lengfeld, K.; Walawender, E.; Weigl, E.; Becker, A. RADKLIM Version 2017.002: Reprocessed Gauge-Adjusted Radar Data, One Hour Precipitation Sums (RW); Radar-based Climatology Version 2017.002; Deutscher Wetterdienst: Offenbach, Germany, 2018. [Google Scholar] [CrossRef]
  31. Kafsner, C. Ergebnisse der Niederschlags-Beobachtungen im Jahre 1910. In Veröffentlichungen Des Königlich Preußischen Meteorologischen Instituts Nr. 249; Springer Verlag: Berlin, Germany, 1912; 154p. [Google Scholar]
  32. Ziese, M.; Junghänel, T.; Becker, A. 2016. Andauernde Großwetterlage Tief Mitteleuropa entfaltet Ihr Unwetterpotential mit starken Gewittern und massiven Schadensgeschehen in Deutschland; Report Deutscher Wetterdienst; Deutscher Wetterdienst: Offenbach, Germany, 2016. [Google Scholar]
  33. Junghänel, T.; Bissolli, P.; Daßler, J.; Fleckenstein, R.; Imbery, F.; Janssen, W.; Kaspar, F.; Lengfeld, K.; Leppelt, T.; Rauthe-Schöch, M.; et al. Hydro-klimatologische Einordnung der Stark-und Dauerniederschläge in Teilen Deutschlands im Zusammenhang mit dem Tiefdruckgebiet “Bernd” vom 12. bis 19. Juli 2021; Report Deutscher Wetterdienst; Deutscher Wetterdienst: Offenbach, Germany, 2021. [Google Scholar]
  34. Copernicus Climate Change Service. European State of the Climate 2021, Full Report. 2021. Available online: https://climate.copernicus.eu/ESOTC/2021 (accessed on 30 May 2022).
  35. Bundesamt für Kartographie und Geodäsie (BKG). Digitales Geländemodell Gitterweite 5 m (DGM5). 2022. Available online: https://gdz.bkg.bund.de/index.php/default/digitales-gelandemodell-gitterweite-5-m-dgm5.html (accessed on 4 May 2022).
  36. Landesamt für Umwelt Rheinland-Pfalz (LfU). Hochwassermeldedienst. 2021. Available online: https://www.hochwasser-rlp.de (accessed on 31 May 2022).
  37. Deutsches Zentrum für Luft- und Raumfahrt (DLR). Befliegung Ahrbrück, Pützfeld, Altenahr 16.07.2021. 2021. Available online: https://arcgis.bbk.itzbund.de/arcgis/apps/sites/#/hochwasser2021 (accessed on 18 October 2021).
  38. Landesamt für Vermessung Geobasisinformationen Rheinland-Pfalz (LVG). Sonderbefliegung Hochwasser Ahr 2021. 2021. Available online: https://www.geoportal.rlp.de/map?WMS=73160 (accessed on 7 October 2021).
  39. Bundesamt für Kartographie und Geodäsie (BKG). Digitale Orthophotos DOP20/DOP40. 2021. Available online: https://gdz.bkg.bund.de/index.php/default/webdienste/digitale-orthophotos/wms-digitale-orthophotos-bodenauflosung-20-cm-wms-dop.html (accessed on 7 October 2021).
  40. Bundesamt für Kartographie und Geodäsie (BKG). BKG WMS Digitale Orthophotos Historisch, ©GeoBasis-DE 2022, dl-de/by-2-0. 2022. Available online: www.lvermgeo.rlp.de (accessed on 4 May 2022).
  41. Roggenkamp, T.; Herget, J. Hochwasser der Ahr im Juli 2021—Abflussschätzung und Einordnung. HW 66 2022, H.1, 40–49. [Google Scholar]
  42. Müller, M.; Kaspar, M. Event-adjusted evaluation of weather and climate extremes. Nat. Hazards Earth Syst. Sci. 2014, 14, 473–483. [Google Scholar] [CrossRef] [Green Version]
  43. Korswagen, P.A.; Harish, S.; Oetjen, J.; Wüthrich, D. Post-Flood Field Survey of the Ahr Valley (Germany): Building Damages and Hydraulic Aspects; Technical Report 2022; Delft University of Technology: Delft, The Netherlands, 2022. [Google Scholar] [CrossRef]
  44. Ravazzolo, D.; Spreizter, G.; Friedrich, H.; Tunnicliffe, J. River Flow 2020, Chap. Flume Experiments on the Geomorphic Effects of Large Wood in Gravel-Bed Rivers; CRC Press: Boca Raton, FL, USA, 2020; pp. 1609–1615. [Google Scholar]
  45. Ruiz-Villanueva, V.; Mazzorana, B.; Bladé, E.; Bürkli, L.; Iribarren-Anacona, P.; Mao, L.; Nakamura, F.; Ravazzolo, D.; Rickenmann, D.; Sanz-Ramos, M.; et al. Characterization of wood-laden flows in rivers. Earth Surf. Process. Landf. 2019, 44, 1694–1709. [Google Scholar] [CrossRef]
  46. Sächsisches Landesamt für Umwelt und Geologie (LfUG). Ereignisanalyse Hochwasser August 2002 in den Osterzgebirgsflüssen. 2004, Materialien zur Wasserwirtschaft; p. 176. Available online: https://umwelt.sachsen.de/umwelt/infosysteme/lhwz/download/Ereignisanalyse_neu.pdf (accessed on 4 May 2022).
  47. Buffin-Bélanger, T.; Biron, P.M.; Laroque, M.; Demers, S.; Olsen, T.; Choné, G.; Ouellet, M.-A.; Cloutier, C.-A.; Desjarlais, C.; Eyquem, J. Freedom space for rivers: An economically viable river management concept in a changing climate. Geomorphology 2015, 251, 137–148. [Google Scholar] [CrossRef]
  48. Versuchsanstalt für Wasserbau, Hydrologie und Glaziologie (VAW). Schwemmholz: Probleme und Lösungsansätze. VAW-Mitt. 2006, 188, 135. [Google Scholar]
  49. Fekete, A.; Sandholz, S. Here comes the flood, but not failure? Lessons to learn after the heavy rain and pluvial floods in Germany 2021. Water 2021, 13, 3016. [Google Scholar] [CrossRef]
  50. AW-Wiki. Eisenbahnbrücke Ahrbrück. 2021. Available online: https://www.aw-wiki.de/index.php/Eisenbahnbrücke_Ahrbrück (accessed on 4 May 2022).
  51. Deng, L.; Wang, W.; Yu, Y. State-of-the-art review on the causes and mechanisms of bridge collapse. J. Perform. Constr. Facil. 2016, 30, 04015005. [Google Scholar] [CrossRef]
  52. AW-Wiki. Ahr-Hochwasser vom 14./15. Juli 2021. 2021. Available online: https://www.aw-wiki.de/index.php/Ahr-Hochwasser_vom_14./15._Juli_2021 (accessed on 4 May 2022).
  53. Koks, E.; Van Ginkel, K.; Van Marle, M.; Lemnitzer, A. Brief Communication: Critical Infrastructure impacts of the 2021 mid-July western European flood event. Nat. Hazards Earth Syst. Sci. Discuss. 2021. in review. [Google Scholar] [CrossRef]
  54. Lengfeld, K.; Walawender, E.; Winterrath, T.; Becker, A. CatRaRE: A Catalogue of radar-based heavy rainfall events in Germany derived from 20 years of data. Meteorol. Z. 2021, 30, 469–487. [Google Scholar] [CrossRef]
  55. Kemp, K. Die Ahrtalbahn von 1880/88—eine Spurensuche. Heim. Des Kreises Ahrweiler 2014, 185–192. Available online: https://relaunch.kreis-ahrweiler.de/kvar/ (accessed on 10 December 2021).
  56. Büchs, W. Hochwasserschutz im Ahrtal: “Hier ist Ingenieurskunst gefragt”. Interview mit dem Biologen Wolfgang Büchs. 2021. Available online: https://www.tagesschau.de/wirtschaft/technologie/hochwasserschutz-ahrtal-101.html (accessed on 4 May 2022).
  57. Janta, L.; Poppelreuter, H. “…Das Elend übersteigt jeden Begriff…” Ahr-Hochwasser am 12./13. Juni 1910 forderte 52 Menschenleben. Heim. Des Kreises Ahrweiler 2010, 188–197. Available online: https://relaunch.kreis-ahrweiler.de/kvar/ (accessed on 10 December 2021).
  58. Landesamt für Umwelt Rheinland-Pfalz (LfU). Starkregen und Hochwasser in Rheinland-Pfalz im Mai/Juni 2016. Bericht des Landesamt für Umwelt Rheinland-Pfalz 2016; Landesamt für Umwelt Rheinland-Pfalz: Mainz, Germany, 2016; 46p. [Google Scholar]
Figure 1. (a) Overview map of the Ahr river catchment indicating the locations of the mentioned towns, gauging stations and tributaries, and detailed maps of the distribution of sealed (b) and built-up areas (c), which only show the lower part of the catchment served by the Ahr valley railroad. The inserted table in the overview map (a) shows the precipitation sum per month and year, averaged over the entire catchment area of the Ahr River and over a 30-years period between 1991 and 2020.
Atmosphere 13 01118 g001
Figure 2. Comparison of hydrometeorological conditions before the precipitation event expressed as soil moisture (in usable field capacity (%)) from AMBAV model [25,26] and 21-days antecedent precipitation index (API) based on RADKLIM data [30] for the flood events in 2016 and 2021. Precipitation totals (mm) are presented for the events 1910, 2016 and 2021 for six days and one day before the event, based on RADOLAN data [27]. Note that the source of the precipitation values for 1910 is different, gridded station data instead of radar data, resulting in the coarser effective resolution.
Atmosphere 13 01118 g002
Figure 3. An example from the three different aerial photographs [37,38,39] showing bridge 3. The photograph from 2011 was taken as reference for the conditions before the 2021 event [40].
Atmosphere 13 01118 g003
Figure 4. Flowchart summarizing the methodology used in this study.
Atmosphere 13 01118 g004
Figure 5. Accumulated precipitation values in the catchment above and discharge values at the gauging station in Altenahr during five days before and after peak discharge for the three flood events in June 1910, June 2016 and July 2021. As for 1910 no discharge measurements are available, the peak discharge is presented as a point, derived from the reconstruction of Roggenkamp and Herget [19]. The reconstructed discharge values for 2021 are from LfU [36].
Atmosphere 13 01118 g005
Figure 6. Discharge and precipitation values for the 2021 event at different gauging stations on the Ahr River (a) and selected tributaries (b). Peak discharge values (Qmax) for the events in 1910 and 2016 are integrated as horizontal lines.
Atmosphere 13 01118 g006
Figure 7. (a) Damage mapping on the railroad line for the sections Ahrbrück–Walporzheim (west) and Walporzheim–Bad Bodendorf (east) based on the aerial photograph RLP_24.07.2021. Designated flood zones are registered along the Ahr River based on the legally defined and reported floodplains as well as flood hazard maps issued and published by the Ministry for Climate Protection, Environment, Energy and Mobility Rheinland-Pfalz [15]. The diagram shows the percentage of the different damage categories for the whole railroad line as well as separate for the western and the eastern section (b) and compares the classified damage categories with designated flood warning levels (c).
Atmosphere 13 01118 g007
Figure 8. Examples of observed damages and fluvial morphological changes along the railroad line. (a) Damages on bridge 2 through backwater effects. (b) A crack in the foundation of bridge 2. (c) Remains of the two-lane bridge 5. The cycling path went into the tunnel on the left, the railroad line into the tunnel in the middle. The tunnel on the right is the lower lying road tunnel, through which flowed parts of the discharge. (d) Damaged pier at bridge 8. The damaged pier was located on the river bank before the event; the course of the Ahr River ran only through the two front arches. (e) Remains of bridge 10 with a missing pier in the middle of the riverbed. (f) Location of the removed bridge 11 at the narrowest point of the Ahr valley. The road’s retaining wall (left) was eroded by the flood event. (g) The cut bank of the meander “Laacher Bogen” with strong lateral erosion, undercutting the railroad embankment. The route of the railroad line is indicated by the masts. (h) The meander neck at Laach, where parts of the flood wave shortened the meander bench, following the road (ancient railroad track). (i) Mini map providing an overview of the localization of the photos.
Atmosphere 13 01118 g008
Figure 9. Aerial views before (left, [40]) and after (right, [37]) the event and a photograph illustrating the special situation at bridges 5 and 6 where the drainage situation was partially reversed due to the lower road tunnel.
Atmosphere 13 01118 g009
Table 1. Comparison of water levels and peak discharges for different flood events in the Ahr valley. The mean comparative values are < 1 m for water level and 8 m3/s for discharge. Data sources: [18,19,20,36,41].
DateWater Level (m)Peak Discharge (m3/s)
21 July 1804ca. 7 (estimated, gauge Ahrweiler)1208 (reconstructed, gauge Dernau)
13 June 19105 (estimated, gauge Ahrweiler)496 (reconstructed, gauge Altenahr)
2 June 20163.71 (measured, gauge Altenahr)236 (measured, gauge Altenahr)
14 July 20217–8 (estimated, gauge Altenahr)400–700 (estimated, gauge Altenahr)
991 (reconstructed, gauge Altenahr)
1000–1200 (estimated, between Rech and Dernau)
Table 2. Time lag between the precipitation in the respective catchment areas above and discharge peaks at various gauging stations along the Ahr and some of its tributaries.
Gauging StationRiver kmDischarge PeakPrecipitation PeakTime Difference (h)
m3/sTimemmTime
Ahr
Müsch63.0496.014 July 2021 21:15 h92114 July 2021 16:50 h4.4
Altenahr31.7991.015 July 2021 01:00 h207714 July 2021 16:50 h8.2
Bad Bodendorf4.9898.015 July 2021 03:00 h229714 July 2021 16:50 h10.7
Tributaries
Kirmutscheid/Trierbach 127.014 July 2021 19:00 h25814 July 2021 11:50 h7.2
Niederadenau/Adenauer Bach 40.414 July 2021 21:45 h13814 July 2021 11:50 h9.9
Denn/Kesselinger Bach 69.214 July 2021 22:45 h20614 July 2021 12:50 h9.9
Kreuzberg/Sahrbach 158.014 July 2021 19:45 h20414 July 2021 16.50 h2.9
Table 3. Summary of damages and fluvial morphological changes on the 11 bridges of the Ahr valley railroad crossing the Ahr River.
Bridge 1Bridge 2Bridge 3Bridge 4
bridge typearch bridge with four archesarch bridge with five archesarch bridge with five archessteel bridge
combined with cycle path bridgenononoyes (railroad track upstream)
length (m)52607058
area (m2)458654588302
year of activation1912191219121907
status description (based on RLP_24.07.2021)track buried, no visible damage to the bridgetrack buried, damage to the bridge on orographic left banktrack buried, no visible damage to the bridgetrack buried, damage to the bridge on both banks
place of the greatest destruction of the bridge (orographic and morphologic)left; cut bankleftright; slip-off slopeleft; slip-off slope
status description (based on BKG_03.09.2021, post-event photographs and field survey)no external damage to the foundation visible, stone slabs on the bridge removedfoundation still in place, but partially destroyed on the orographic left bank, cracks present and arches sagged, one pier damaged upstreamno external damage to the foundation visible, stone slabs on the bridge removedbridge completely removed, only foundations left at the edges
flow path of the Ahr during the flood eventon both sides of the bridge, impoundment of material mainly on the left bank, widening of river bedon both sides of the bridge, mainly left through the road underpass, impoundment of material mainly on the right bankon both sides of the bridgeon both sides of the bridge, especially on the slip-off slope because of accumulated material on the cut bank
change of the river course post-eventsame river bed as pre-eventwidening of river bed to the left, river flows through three arches (pre-event: two arches)widening of river bed to the right, river flows through 3 arches (pre-event: 1 arch)widening of the river bed to the left
erosionlateral erosion on the right bank upstream, on both banks downstream of the bridgelateral erosion in meadow terrain on the left bank upstream and on stone wall on the right bank at the bridgelateral erosion of gravel and meadow areas on the right bank of the river, deep erosion of gravel area downstream of the bridgelateral erosion on the left bank downstream of the bridge
accumulationnew gravel area below the bridge on the right banknew gravel area downstream of the bridge
Bridge 5Bridge 6Bridge 7
bridge typearch bridge with three archesarch bridge with three archestruss bridge
combined with cycle path bridgeyes (railroad track downstream)yes (railroad track upstream)yes (railroad track downstream)
length (m)669187
area (m2)538538505
year of activation193819381936
status description (based on RLP_24.07.2021)track torn away, bridge destroyed, first pier on orographic right bank torn awaytrack buried, bridge destroyed on orographic right banktrack torn away, half of the bridge and embankment on orographic left bank destroyed and torn away
place of the greatest destruction of the bridge (orographic and morphologic)right; slip-off sloperight; slip-off slopeleft; slip-off slope
status description (based on BKG_03.09.2021, post-event photographs and field survey)bridge completely removedfoundation still in place, but partially destroyed on the orographic right bankbridge completely removed, only foundations left at the tunnel portal
flow path of the Ahr during the flood eventon both sides of the bridgechange of the flow conditions due to the new flow path of parts of the discharge through the road tunnel, confluence just upstream of the bridgeshifting the course of the river to the left
change of the river course post-eventwidening of the river bed to the left, same river bed as pre-event at time of field surveywidening of river bed to the right, river flows through 2 arches (pre-event: 1 arch)same river bed as pre-event
erosionlateral erosion on both bankslateral erosion on the right banklateral erosion on the left bank
accumulation debris fan at the tunnel portal upstream of the bridge, new gravel area on the left bank downstream of the bridge
Bridge 8Bridge 9Bridge 10Bridge 11
bridge typearch bridge with 4 archesconcrete rolled girdersconcrete rolled girdersarch bridge with 4 arches
combined with cycle path bridgeyes (railroad track upstream)yes (railroad track downstream)yes (railroad track upstream)yes (railroad track downstream)
length (m)65585875
area (m2)657281281645
year of activation1911195119511911
status description (based on RLP_24.07.2021)track buried, no visible damage to the bridgetrack torn away, bridge and embankment on orographic left bank destroyedtrack torn away, bridge destroyed on orographic right banktrack torn away, more than half of the bridge and embankment on orographic left bank destroyed
place of the greatest destruction of the bridge (orographic and morphologic)leftleft; slip-off sloperightleft
status description (based on BKG_03.09.2021, post-event photographs and field survey)foundation still in place, one pier damaged upstreamonly piers still in placeonly piers still in place, one pier completely removedbridge completely removed
flow path of the Ahr during the flood eventshifting the course of the river to the leftshifting the course of the river to the lefton both sides of the bridge, shifting the course of the river to the righton both sides of the bridge, especially on the left
change of the river course post-eventwidening of river bed to the left, river flows through three arches (pre-event: two arches)same river bed as pre-eventsame river bed as pre-eventsame river bed as pre-event
erosionlateral erosion on the left bankdeep erosion of gravel area downstream of the bridgelateral erosion on both banks, torn out rock slabs on right bank downstream of the bridgelateral erosion on both banks up- and downstream of the bridge
accumulation
Publisher’s Note: MDPI stays neutral with regard to jurisdictional claims in published maps and institutional affiliations.

