Article

Detection and Classification of Citrus Fruit Infestation by Bactrocera dorsalis (Hendel) Using a Multi-Path Vis/NIR Spectroscopy System

1
School of Mechanical and Electrical Engineering, Central South University of Forestry and Technology, Changsha 410004, China
2
College of Life Sciences, South China Normal University, Guangzhou 510630, China
3
Department of Chemical and Pharmaceutical Engineering, Nanchang University, Nanchang 330031, China
*
Author to whom correspondence should be addressed.
Agriculture 2023, 13(8), 1642; https://doi.org/10.3390/agriculture13081642
Submission received: 23 June 2023 / Revised: 9 August 2023 / Accepted: 17 August 2023 / Published: 21 August 2023
(This article belongs to the Special Issue Agricultural Machinery and Technology for Fruit Tree Management)

Abstract

:
In this study, a multi-path Vis/NIR spectroscopy system was developed to detect the presence of Bactrocera dorsalis (Hendel) infestations of citrus fruit. Spectra were acquired for 252 citrus fruit, 126 of which were infested. Two hundred and fifty-two spectra were acquired for modeling in their un-infested stage, slightly infested stage, and seriously infested stage. The location of the infestation is unclear, and considering the impact of the light path on the location of the infestation, each citrus fruit was tested in three orientations (i.e., fruit stalks facing upward (A), fruit stalks facing horizontally (B), and fruit stalks facing downward (C)). Classification models based on joint X-Y distance, multiple transmittance calibration, competitive adaptive reweighted sampling, and partial least squares discriminant analysis (SPXY-MSC-CARS-PLS-DA) were developed on the spectra of each light path, and the average spectra of the four light paths was calculated, to compare their performance in infestation classification. The results show the classification result changed with the light path and fruit orientation. The average spectra for each fruit orientation consistently gave better classification results, with overall accuracies of 92.9%, 89.3%, and 90.5% for orientations A, B, and C, respectively. Moreover, the best model had a Kappa value of 0.89, and gave 95.2%, 80.1%, and 100.0% accuracy for un-infested, slightly infested, and seriously infested citrus fruit. Furthermore, the classification results for infested citrus fruits were better when using the average spectra than using the spectrum of each single light path. Therefore, the multi-path Vis/NIR spectroscopy system is conducive to the detection of B. dorsalis infestation in citrus fruits.

1. Introduction

In 2020, China’s citrus production reached 5.12 million tons [1]. However, the annual economic loss of citrus fruit due to pests has been estimated to be approximately 10% to 20% [2]. Among these pests, Bactrocera dorsalis (Hendel) causes serious damage [3,4]. B. dorsalis causes damage to the outer skin of citrus fruits and lays eggs inside, leading to cell separation and tissue breakdown, rendering the fruit rotten and inedible. In general, citrus fruit are susceptible to a B. dorsalis infestation at maturity and harvest. The B. dorsalis infestation of citrus fruit can be divided into three stages: un-infested, slightly infested, and seriously infested [5]. In the slightly infested stage, adult females insert their eggs into the outer peel of the host citrus fruit, and the larvae eat and grow secretly in the pulp, so it is difficult to detect them. In the seriously infested stage, the disease includes substantive signs of deterioration visible to the human eye on the surface of citrus peel. To better detect the early infestation of citrus fruits, agricultural inspectors usually cut citrus fruits to find eggs and larvae in the pulp. Furthermore, because eggs and larvae are white and only 2 to 3 mm long [6], this results in inefficient manual detection. Therefore, it is necessary to design a non-destructive technical system to evaluate whether the citrus fruits are infested.
Many different non-destructive technical systems have been explored as possible tools for assessing the quality of various foods [7,8], including machine vision, X-ray, magnetic resonance imaging (MRI), imaging and spectroscopic techniques, and machine vision inspection of citrus epidermal damage [9,10]. However, it is still difficult to identify the infested part of the citrus because the color is very similar to the normal part of the fruit. X-ray technology identifies citrus fruits infested with insects [11]. MRI is used for pear disease evaluation [12]. Currently, instruments for X-ray imaging and magnetic resonance imaging are very expensive and require long scanning times, thus limiting their practical application in the examination of citrus fruits infested with B. dorsalis. Early detection of mechanical damage in mangoes using NIR hyperspectral images [13]. The amount of hyperspectral data is very large and is not suitable for rapid detection. Thermal imaging predicts citrus harvest [14]. However, thermography is not suitable for practical applications because it requires a long heating process and strict control of the temperature gradient between the citrus fruit surface and the surrounding air.
Visible and near-infrared (Vis/NIR) spectroscopy is one of the most commonly non-destructive technical systems used for detecting defects inside fruits, and Vis/NIR spectroscopy measurements are related to the composition and structure of the fruits. At the beginning of the infestation, the citrus fruit has no obvious symptoms on the outside, but the inner tissue is under double stress from the inner larvae and the outer bacteria. Approximately 3 d later, the citrus tissue is eaten, decays, and softens. This may lead to changes in the scattering and absorption of light at the infested parts. This offers the possibility of identifying citrus fruit infested with B. dorsalis in the Vis/NIR. Earlier studies detected insect infestation of stored food using NIR techniques [15]. Wang compared the abilities of the interactions, reflectance, and transmission modes of visible and near-infrared (Vis/NIR) spectroscopy in detecting internal insect-infested jujubes [16]. In cherries, the spectral information obtained when the fruit is healthy differs noticeably from that obtained during an infestation by larvae, which is caused by the fruit flesh damage, resulting in noticeable changes in Vis/NIR spectral information [17]. Vis/NIR spectroscopy has also been used to identify internal defects in citrus fruit [18]. Even citrus peel oils can be classified and analyzed using Vis/NIR [19]. Online Vis/NIR spectroscopy systems were also used to determine the internal lesions and soluble contents of pears [20]. Moreover, the possibility of assessing damage to other agro-products, such as jujubes [16], tomatoes [21], wine grapes [22], and olives [23], has also been proposed using Vis/NIR technology. These examples further show that Vis/NIR technology has great potential for detecting B. dorsalis infestations.
However, the application of Vis/NIR in citrus postharvest pest detection has not been fully evaluated. Previously, most applications used a single-path detection method [24]. Since the locations of B. dorsalis that is infesting citrus fruits are unknown, the use of just a single light path is likely to miss the relevant spectral information, resulting in a decrease in the classification accuracy. In addition, it was reported that fruit orientation affected fruit spectra [25]. Hence, the influence of fruit orientation should be considered when performing spectral detection. The single-path detection method may not be suitable for the early classification of citrus infested by B. dorsalis, while the spectra collected by a multi-path method may be more suitable. For example, to detect apple mold, the classification results of models established using a fiber receiver with multiple angles are better than those of an optical fiber receiver with a single angle [26]. It is necessary to implement multi-path experiments on citrus fruit.
This study is dedicated to the classification of citrus samples for applications, such as quality testing and origin tracing. Spectral data is our main sample feature that provides information about sample components and characteristics. Due to the relatively small number of samples collected and the large number of spectral data features, it is necessary to choose a classification method that is suitable for both high-dimensional and low-sample situations. When examining different classification methods, it can be observed that Support Vector Machines (SVMs) [27,28] show good classification capabilities in the case of few samples. However, its applicability may be limited when there are more features involved in the visible/near-infrared spectrum. On the contrary, Partial Least Squares Discriminant Analysis (PLS-DA) [29,30], a good, supervised learning method, excels in handling small sample data. This makes it ideal for solving classification challenges in visible/near-infrared spectra in high-dimensionality and low-sample cases.
In this study, a new multi-path spectral system was assembled in diffuse transmittance mode to collect more comprehensive spectral information from the sample. Vis/NIR spectra of un-infested and infested citrus can be collected from three different fruit orientations. Finally, an infestation classification model was established using joint X-Y distance, multiplicative scatter correction, competitive adaptive reweighted sampling, and partial least squares discriminant analysis (SPXY-MSC-CARS-PLS-DA) for the average spectra collected by both a single and multiple light paths, and we compared the results of fruit orientation on their infestation detection abilities.

2. Materials and Methods

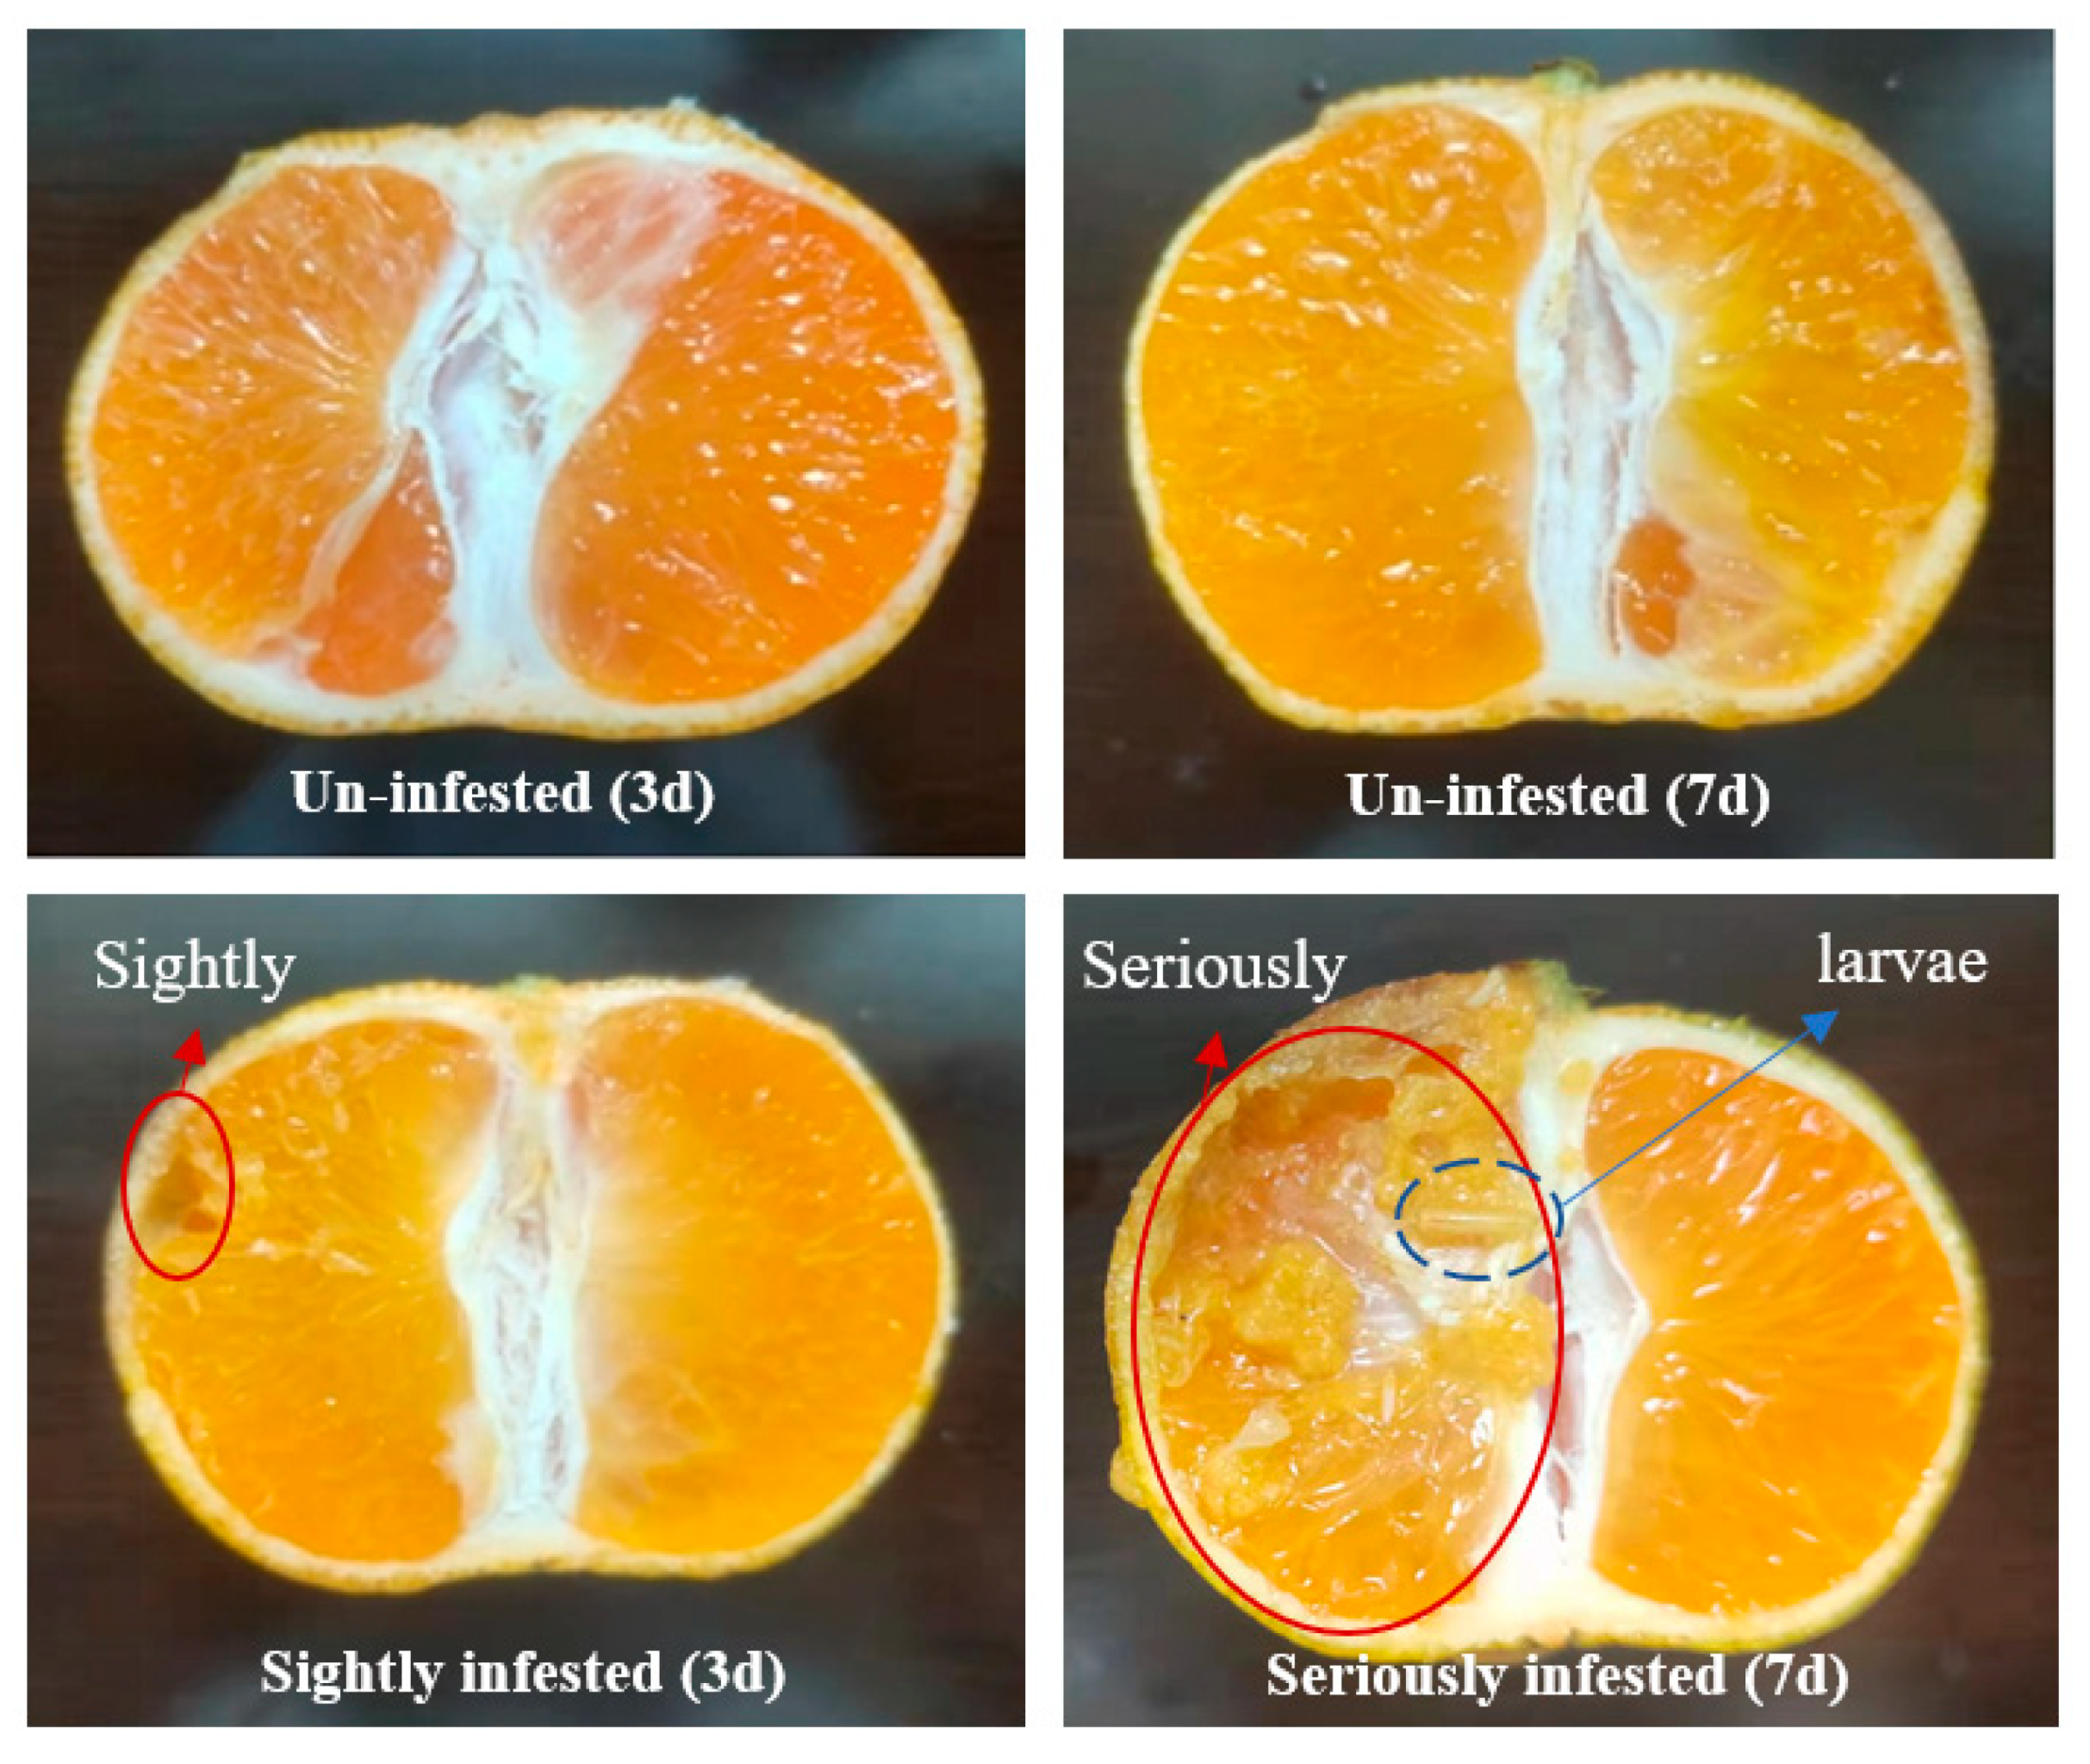
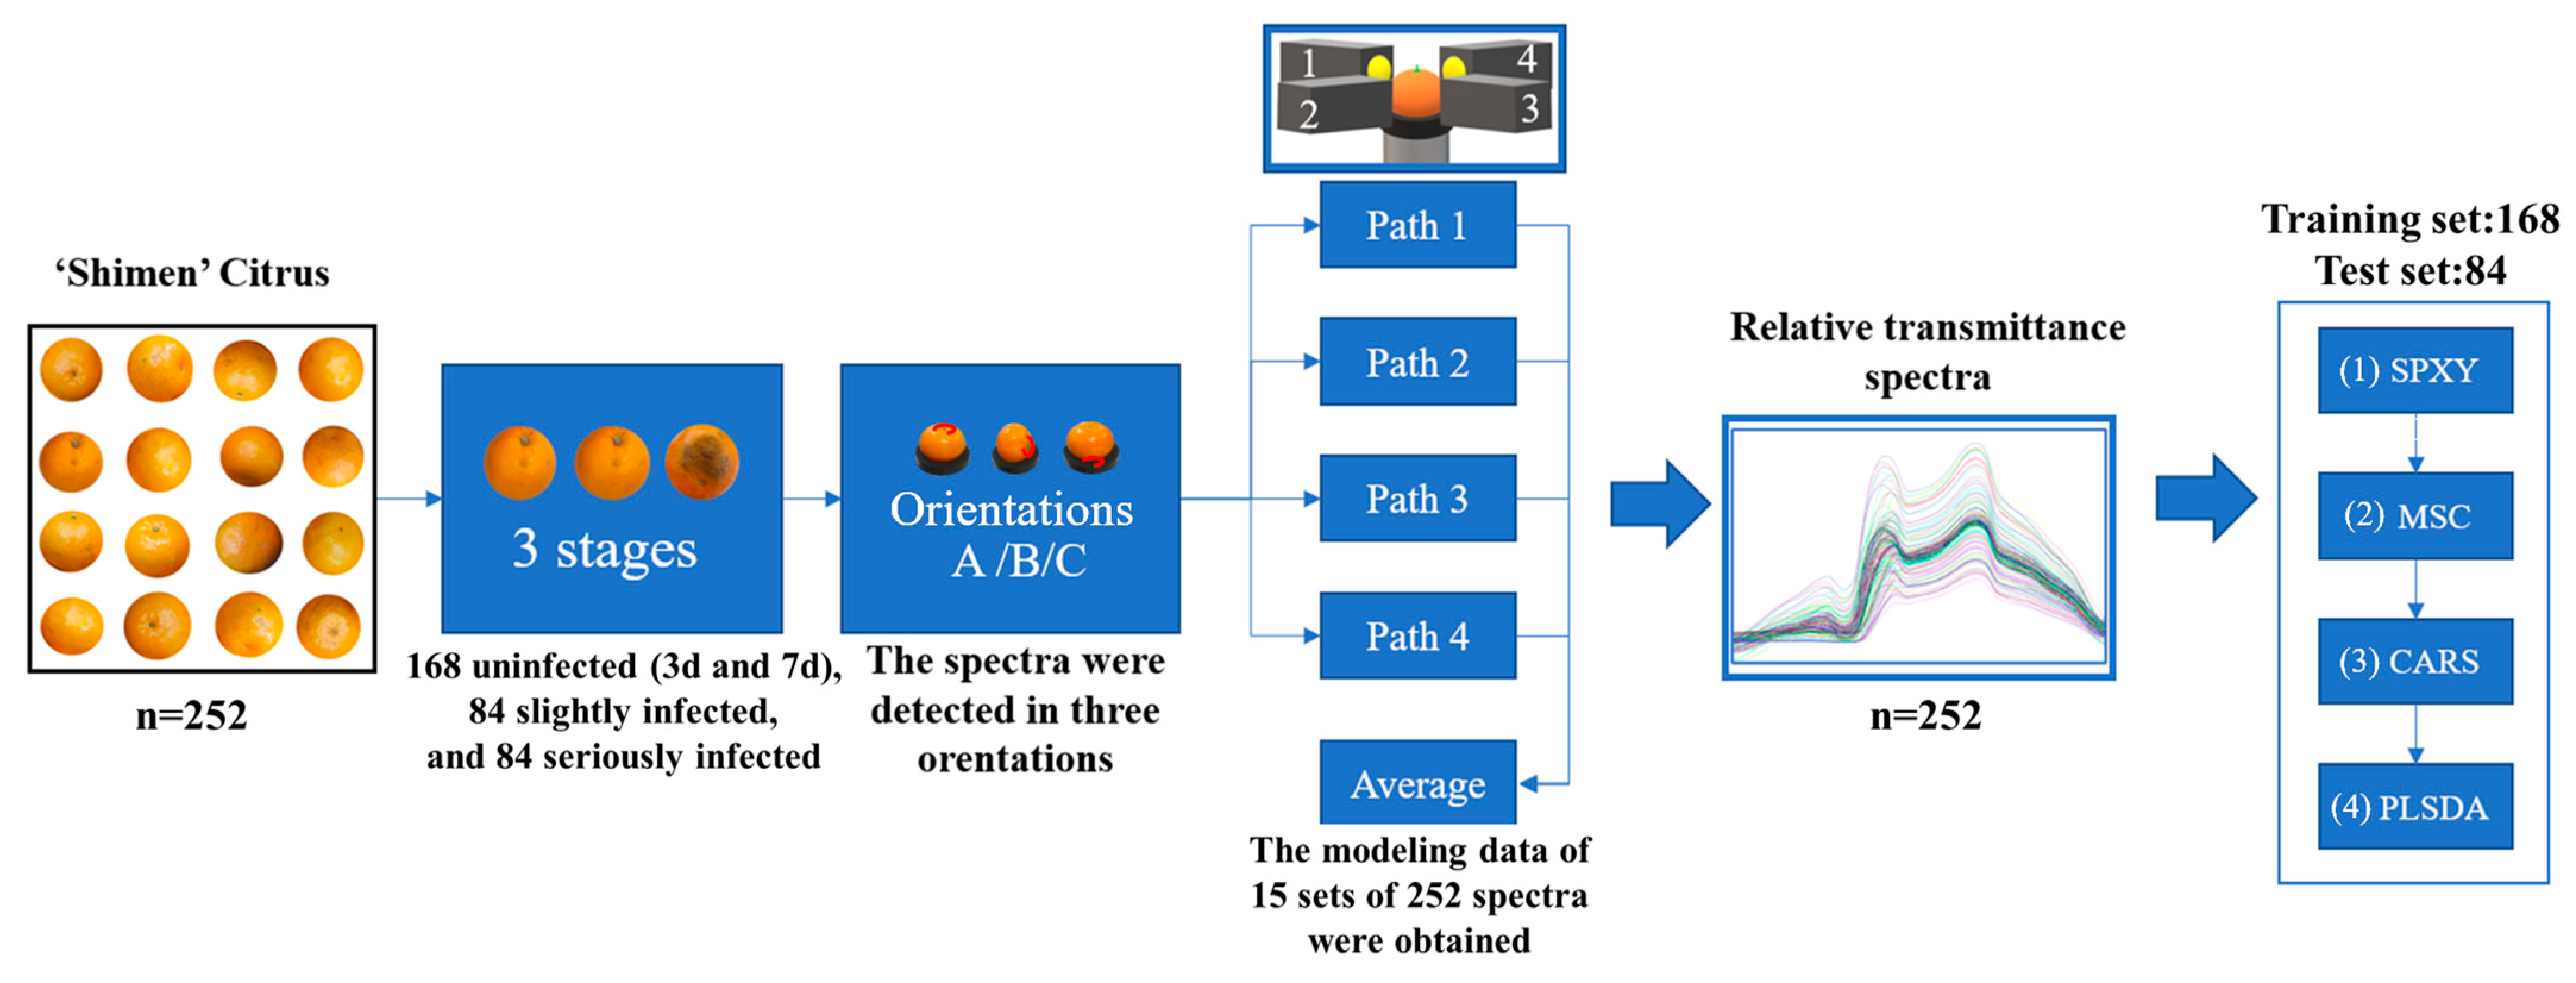
2.1. Sample Preparation

In October 2021 and October 2022, 252 un-infested and mature ‘Shimen’ citrus fruits were purchased from a local supermarket (Changsha, Hunan) as a citrus fruit sample. After cleaning, the samples with similar size and weight were stored in a constant temperature and humidity chamber (CT-HC) at 29 °C and 70% relative humidity.
In total, 200 B. dorsalis (1:1.2 male: female ratio) were obtained from the Agricultural Insect Laboratory (Institute of Entomology, South China Normal University). Bactrocera dorsalis was reared in insect cages (size: 35 cm × 35 cm × 35 cm) and maintained at 29 °C with 70% relative humidity and a 14 h light: 10 h dark photo stage [31,32]. They were reared in accordance with a previous method, as follows [33]: water and feed were updated every 2 d, and the cage was replaced every 7 d for disinfestation. Under these conditions, the egg and larval average period were 1.54 and 8.25 d, respectively [3]. The larvae of the infested citrus samples incubated up to 3 d grew internally for a period of time, at which time the disease had not yet shown any obvious symptoms, and damage of about 5–10% was observed after cutting across the infested area. The larvae continued to grow internally in the citrus samples incubated up to 7 d, resulting in noticeable decay of the internal tissues of the citrus and visible disease on the surface, at which point around 30–50% damage was observed after cutting across the infested area and larval activity was detected. Therefore, un-infested citrus samples were defined as healthy samples based on the degree of infestation, citrus samples incubated up to 3 d after infestation were defined as slightly infested (SI-3), and citrus samples incubated up to 7 d were defined as severely infested (SI-7). The control un-infested citrus fruit was divided into un-infested citrus fruit stored up to 3 d (UI-3) and un-infested citrus fruit stored up to 7 d (UI-7). Two un-infested citrus fruit (control group) and two infested citrus fruit (infested group) samples having different degrees of internal conditions are shown in Figure 1.
As shown in Figure 2, the infested group: 126 un-infested samples were placed in insect rearing cages. The successful infestation was determined by the spawning marks (needle size and gray/brown spots) on the surface of the sample. After invasion, all samples were transferred to the CT-HC (29 °C and 70%) for further storage for 7 d. The control group: 126 un-infested samples were stored in CT-HC (29 °C and 70%) for 7 d without infestation. Sample spectra were obtained at 3 d, and 7 d in two groups. After the experiment, all citrus fruit in the infested group were cut open to confirm the internal existence of larvae. Therefore, 126 citrus samples were selected correspondingly for the control group, and a total of 252 citrus samples were selected for modeling classification in both groups.

2.2. Multi-Path Vis/NIR Spectroscopy System

A multi-path Vis/NIR spectroscopy system was independently developed at Central South University of Forestry and Technology, which mainly consists of a spectrometer, a detection cup, four light paths, and an operation control system, as shown in Figure 3. The spectrometer has a wavelength detection range of 350–1100 nm and a spectral resolution of about 2.8 nm (Maya 2000 from OceanInsight, Orlando, FL, USA). The detection cup has a mat of black light-absorbing material to prevent stray light interference and is equipped with a collimating mirror inside and a fiber connected to the spectrometer. Four light paths are installed with a quartz tungsten halogen lamp (Model: Philips Essential, 12 V, 50 W) with a concentrating lens in the lamp housing to adjust the light spot size. The light paths 1, 2, 3, and 4 are arranged 90 degrees apart at the same height to cover the sample at 360 degrees to ensure that light almost covers the sample (the light is directed through the light path to the sample, transmitted through the sample to the collimating mirror with fiber to the spectrometer). Operation control systems were independently developed with a DAQ data acquisition card (PCIe-6353 from National Instruments, Austin, TX, USA) to control the system, which has a transfer module and a lift module. The lift module adjusts the angle of the light path irradiation by driving the screw mechanism, and the transfer module transports the sample placed on the detection cup to the detection location by double synchronous motors.

2.3. Spectral Acquisition and Correction

Before collecting the visible/near-infrared spectra of the samples, the lights of the four optical paths were turned on and preheated for 30 min. Based on the comparison of preliminary experiments, the spot size was adjusted to 35 mm, the integration time was set to 500 ms, and the sliding average and scanning average were set to 5. First, the illumination angles of the four optical paths were adjusted to a horizontal position using the lifting module, and the detection cups were conveyed to the central detection position of the system through the transmission module. After adjusting the illumination angles and the detection cups to the specified positions, the samples were placed on the detection cups. Reference spectra were acquired from the reference ball (PTFE ball), and then the light source was turned off to collect background spectra in darkness. A total of 2068 wavelengths of spectra were collected for each citrus sample. However, the signal-to-noise ratio at both ends of the collected spectra was poor, so only 917 pixels of spectra in the 550–950 nm wavelength range were retained. A total of 252 spectral data were obtained from citrus samples at three time periods. To comprehensively evaluate the spectral information of citrus infestation by B. dorsalis, spectral data from the four detection optical paths were collected sequentially to obtain complete information about the sample surface. The spectral data of each citrus sample were measured using the multi-path spectral system, with spectra acquired in the A/B/C (stem up (A), stem horizontal (B), and stem down (C)) directions, following the order of optical paths 1, 2, 3, and 4. Each citrus sample collected 2068 pixels of spectra, but only 917 pixels in the 550–950 nm wavelength range were retained due to the poor signal-to-noise ratio at both ends of the collected spectra.
Due to non-uniform light source intensity distribution, stray light, and noise caused by system current, each sampling required calibration using bright and dark spectra to reduce the interference from stray light and other factors. The calculation formula is as follows [34]:
I λ = S λ D λ R λ D λ
where S λ = Sample spectra at wavelength, D λ = Background spectra at wavelength, and R λ = Reference spectra at wavelength.

2.4. Development of Classification Models

As shown in Figure 4, the infestation group and control group were as follows: for 252 samples, the spectra of 4 light paths were collected under 3 orientations. A total of 12 groups (3 orientations × 4 light paths) of 252 spectra were acquired. The average spectra (spectra of 4 light paths) under 3 orientations were acquired to compare the best orientations of the spectral measurements and to evaluate whether the average spectra of multiple light paths would improve the performance of the classification model. Thus, a total of 15 databases (252 spectra per database) were used to calibrate and validate the model.
In this study, PLS-DA models were created using MATLAB R2020a (Math Works Co., Ltd., Natik, MA, USA) and the Partial Least Squares Discriminant Analysis (PLS-DA) aid 9.0.4 [35]. The pre-processing method and spectrum reduction method were selected through pre-experimentation, and the final process of modeling visible/near-infrared spectra and citrus infestation stage classification was as follows:
(1) In order to maximize the training set to characterize the uniform distribution of samples, the joint X-Y distance (SPXY) [36,37] was used to divide the training and test sets (Table 1), and we selected 168 samples as the training set and 84 samples as the test set (21 UI-3, 21 UI-7, 21 SI-3 and 21 SI-7).
(2) In order to reduce or eliminate the interference of background noise, stray light, and other unwanted information in the raw spectral data and to enhance the spectral characterization, multiplicative scatter correction (MSC) [38,39] preprocessing was performed on the spectral data of the original training set and test set samples to reduce or eliminate the interference of background noise, stray light, and other useless information in the original spectral data.
(3) Competitive adaptive reweighted sampling (CARS) [40,41] is an effective wavelength selection algorithm based on Monte Carlo sampling and PLS regression coefficients for extracting the characteristic wavelengths of the spectral data in order to eliminate the redundant information of the spectra and further improve the classification accuracy of the model. Monte Carlo sampling was set to 50 times and cross-validation was set to 10 times to select the best variable for infection detection.
(4) A classification model between spectral characteristic wavelengths and citrus pest stages was developed using PLS-DA [42,43,44], a multivariate inverse least squares method that calculates the probability that each sample belongs to each of the possible categories. PLS-DA has a dataset X containing spectral data of UI-3, UI-7, SI-3, and SI-7 samples. These samples are assigned to different groups, so the model automatically adds another implicit dataset Y after grouping with the number of variables equal to the number of groups and labels the spectral data of the UI-3 sample as 0, the UI-7 sample as 1, the SI-3 sample as 2, and the SI-7 sample as 3. The maximum number of principal components is set to 12, and the number of different principal components is compared with the maximum number of principal components through ten-fold. The maximum number of principal components was set to 12, and the model performance under different numbers of principal components was compared by cross validation to select the optimal number of principal components. Finally, the classification model established in the training set was applied to the data in the test set for classification testing.

2.5. Model Evaluation

In this study, the model’s characteristics were evaluated using the classification precision (overall accuracy) of the training and testing sample sets. To comprehensively assess the model’s predictive performance, the Kappa statistical method [45,46] was also employed. The Kappa statistic considers the random agreement between the model’s predicted results and the actual observed outcomes and provides a corrective measure for accuracy.
A training model was established and used to predict the infection degree of citrus fruits (UI-3, UI-7, SI-3, and SI-7) in the testing set, distinguishing between infected and non-infected citrus. Subsequently, the performance of these models was compared and evaluated. By utilizing the Kappa statistical method, more accurate and reliable assessments of predictive capabilities were obtained.
Furthermore, an evaluation of spectral variations and model recognition was conducted to determine whether storage time had any impact on the sample spectra. The spectral data from four different paths and three fruit orientations were analyzed separately. Additionally, an observation and analysis of the spectral data from these four paths was conducted without considering the influence of fruit orientation (only selecting the best four paths for comparative analysis).
During the recording of the best model’s predictive accuracy level, the corrective effect of the Kappa statistical method on accuracy was taken into account. The best predictive accuracy of the average spectra from the four paths was also recorded. By comparing the best model from a single path with the average spectra, it was possible to determine that higher predictive accuracy indicates a better detection method. The application of the Kappa statistical method provided more reliable evaluation results, enabling a more comprehensive understanding of the model’s predictive capabilities.
The formula for predicting accuracy is as follows:
A = T P + T N T P + T N + F P + F N
The formula for random agreement probability is as follows:
P R = T P + F P × T P + F N + F N + T N × F P + T N T P + T N + F P + F N 2
The formula for the Kappa statistic is as follows:
K a p p a = A P R 1 P R
where TP = number of samples correctly classified and identified for un-infested citrus, TN = number of samples correctly classified and identified for infested citrus, FP = number of samples identified by misclassification for un-infested citrus, and FN = number of samples identified by misclassification for infested citrus. Generally, the higher the prediction rate of the model, the better the corresponding detection method, and the more suitable for detecting citrus fruit infested by B. dorsalis. The Kappa statistic takes values in the range [−1, 1], with values closer to 1 indicating higher consistency between the predicted results and the actual classification, values closer to −1 indicating lower consistency, and values closer to 0 indicating that the accuracy of the predicted results is about the same as a random guess.

3. Results and Discussion

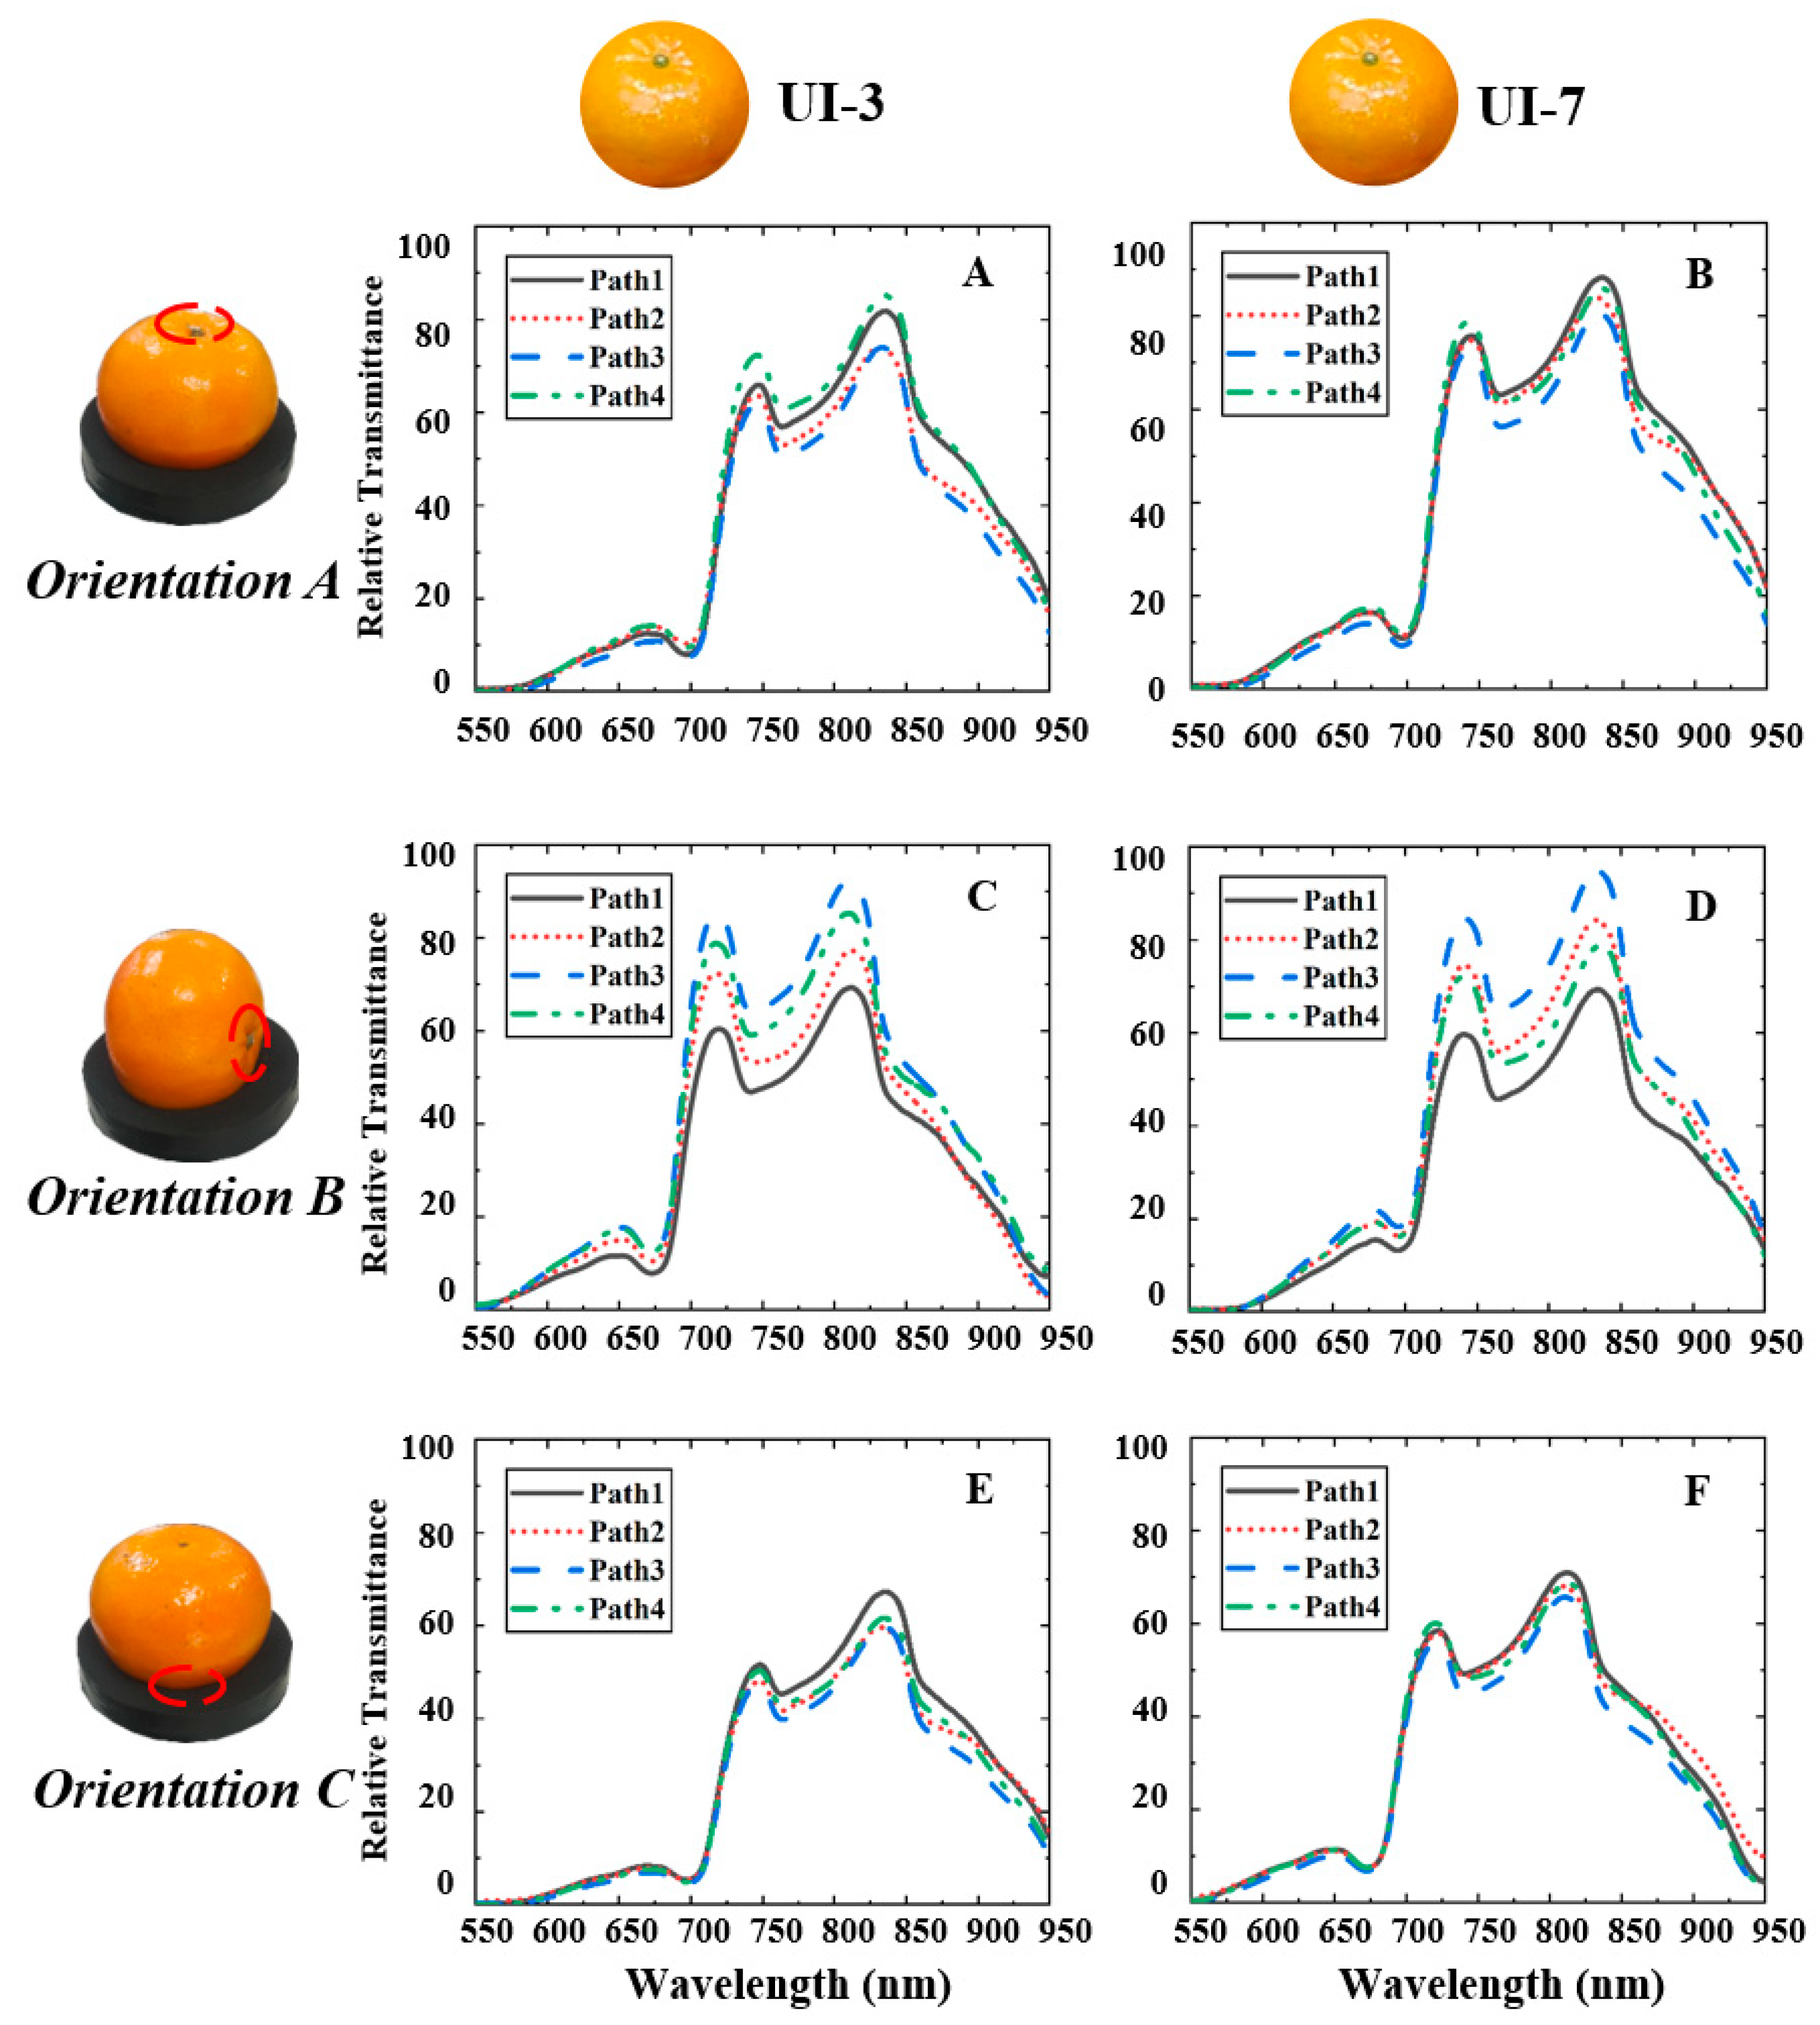
3.1. Result of Single Path on Spectral Characteristics of Infested Citrus

The four relative spectra of citrus fruit in the four stages and three orientations during UI-3 and UI-7 are presented in Figure 5A–F, while the spectra for SI-3 and SI-7 stages are illustrated in Figure 6A–F. To elucidate the changes observed in the VIS region versus the NIR region, an in-depth analysis of the acquired data is provided.
Initially, a scrutiny of the single-path spectra for the three stages in orientation A was conducted (Figure 5A,B and Figure 6A,B). A discernible trend emerged as the spectrum of un-infested citrus fruit (Figure 5A,B) appeared more consistent across the four pathways compared to that of infested citrus fruit (Figure 6A,B). This discrepancy might be attributed to the relatively uniform and intact tissue structure of un-infested citrus fruit in contrast to the disrupted and non-uniform nature of infested citrus tissue. Alongside this, minor variations were observed within the spectra of the four pathways, potentially arising from nuanced differences in the internal tissue structures of citrus, varying across the distinct paths.
For the slightly infested stage (Figure 6A), a subtle deviation was evident when compared to the un-infested citrus fruit (Figure 5A,B). While the spectral peak remained unchanged, the relative transmittance across the four paths displayed greater discreteness. Intriguingly, paths 3 and 4 exhibited resemblance to their un-infested counterparts, while paths 1 and 2 displayed pronounced alterations. This discrepancy suggests that path 2 may have failed to capture localized infestation information. These findings underscore the limitations of conventional single-path detection methodologies in identifying infestation localized to specific areas within the fruit tissue [47].
Progressing to the seriously infested stage (Figure 6B), the spectral peak exhibited consistency, yet the relative transmittance across the four light paths appeared more divergent. This phenomenon likely stems from disparities between the infested and un-infested segments of the citrus fruit, possibly linked to differential scattering and light absorption characteristics. As depicted in Figure 6A,B and Figure 7C, the spectral distinctiveness between infested and un-infested citrus fruit was more pronounced across the four paths (attributable to variations in internal pulp tissues), accompanied by an increased relative transmittance (caused by pulp degradation) [47,48]. With prolonged infestation, the spectra’s discreteness along the four paths intensified, likely due to an exacerbated deterioration of the fruit tissue following infestation, leading to reduced light absorption and subsequently a higher relative transmittance in the infested regions.
Shifting focus to orientation B, an analysis of the single-path spectra for the three stages was conducted (Figure 5C,D and Figure 6C,D). In comparison to the overall spectra of orientations A and C, the spectra within this orientation exhibited greater disparity. This outcome might arise from the uneven distribution of citrus pulp tissue under the four paths in this orientation. The preeminence of fruit flesh in these paths could potentially contribute to diminished classification accuracy.
Finally, an examination of single-path spectra for the three stages in orientation C was performed (Figure 5E,F and Figure 6E,F). Orientation C yielded spectra akin to those in orientation A, albeit with a lesser increase in relative transmittance. Consequently, the modeling outcome in orientation A is deemed optimal.
In summation, the outcomes underscore the substantial influence of B. dorsalis infestation location on spectral detection. The interplay between detection paths and infestation locations directly impacts spectral variations and warrants meticulous consideration in analysis.

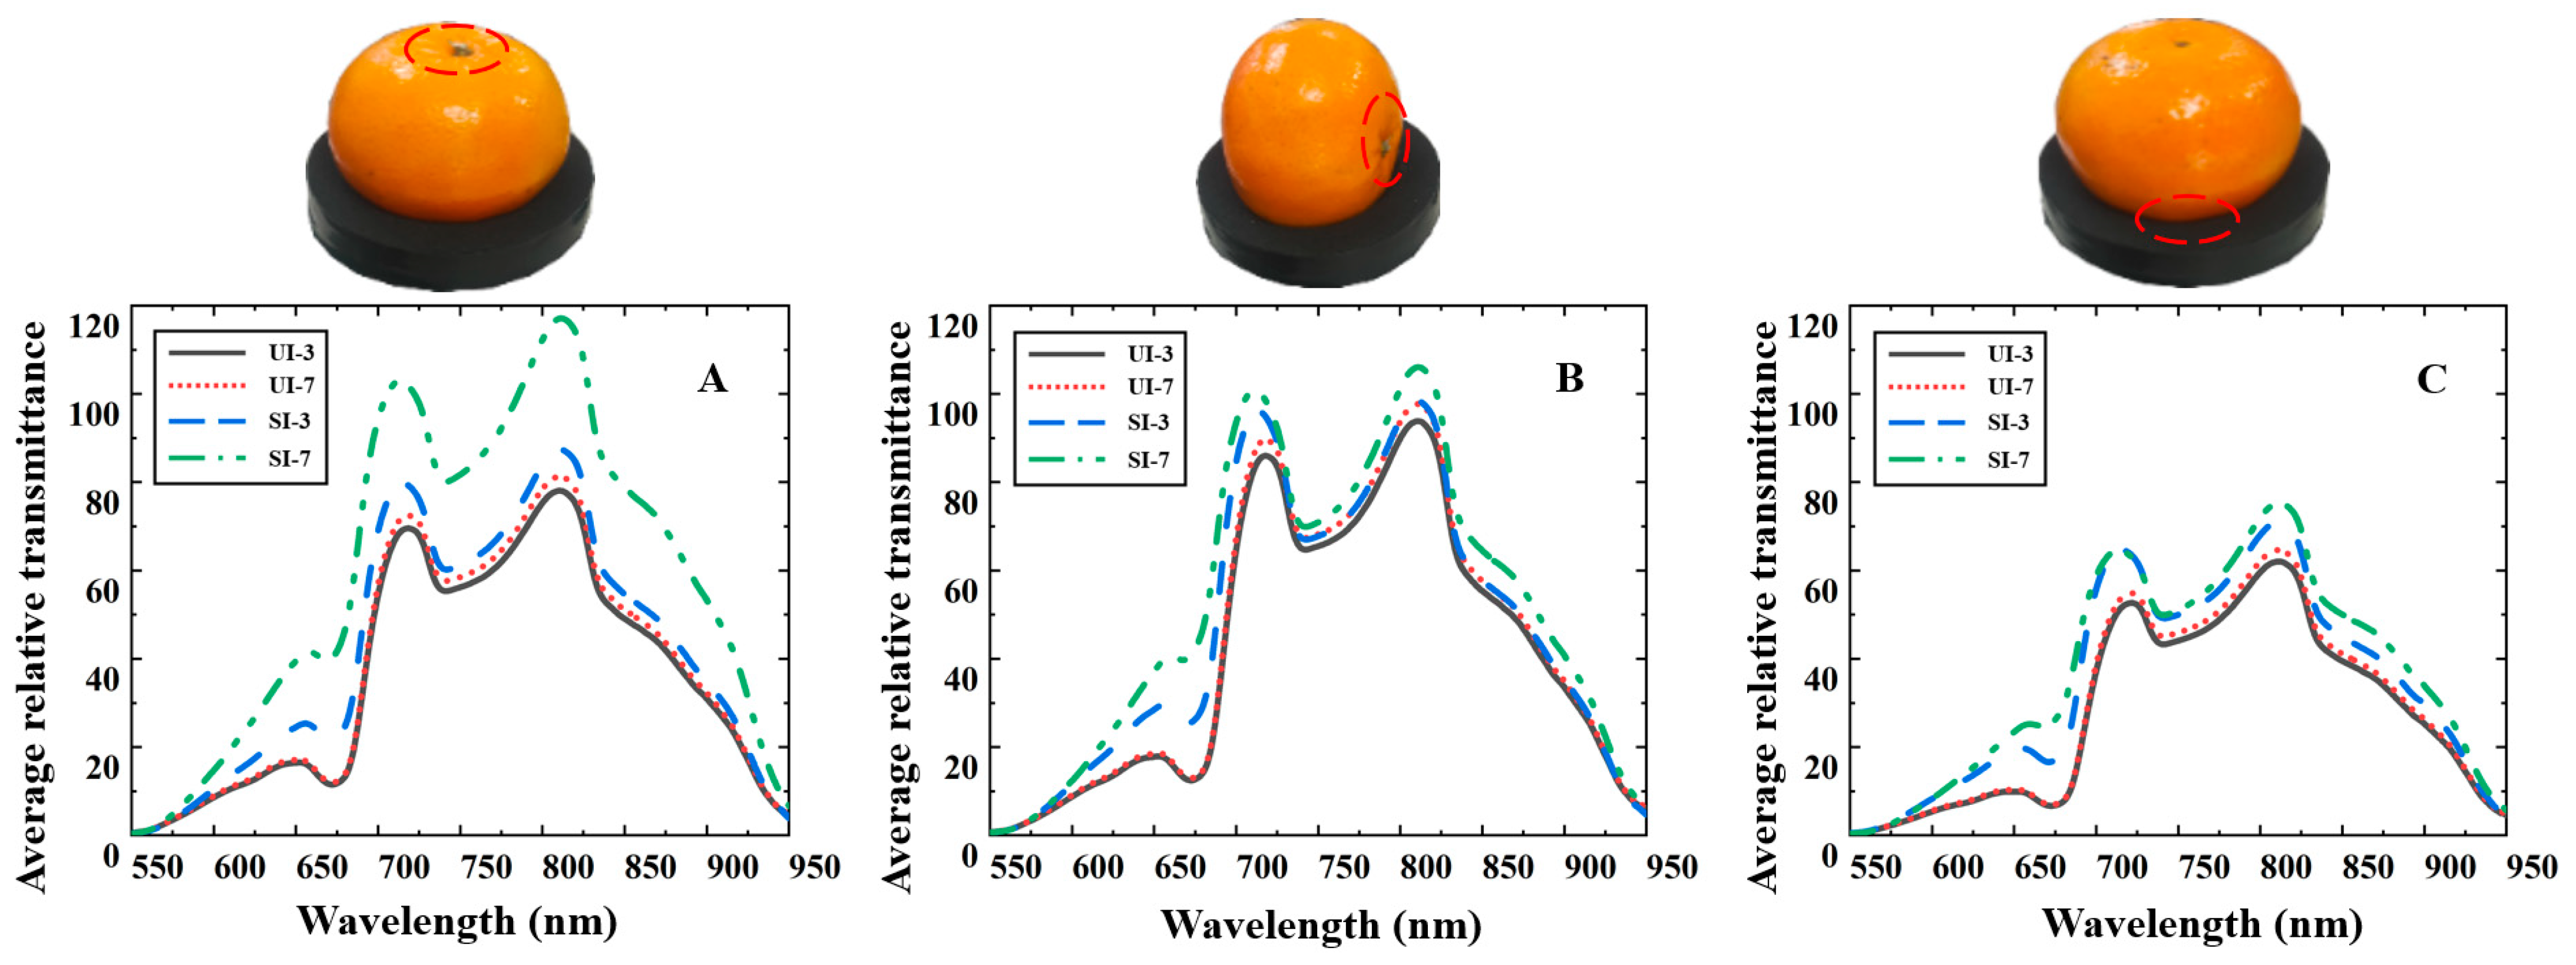
3.2. Result of Multi-Path on Spectral Characteristics of Infested Citrus

Figure 7 displays the average spectra of un-infested and infested citrus across four paths in three orientations. These spectra reveal distinct absorption peaks at 650 nm, associated with chlorophyll, and at 710 nm and 830 nm, corresponding to water or C-H functional groups [49]. Notably, the average relative transmittance of citrus increases as the severity of infestation escalates. This phenomenon stems from discrepancies in flesh integrity between un-infested and infested sections. When B. dorsalis infests citrus, internal larvae growth and external bacterial invasion trigger the release of cell wall degrading enzymes, mycotoxins, and organic acids. Consequently, decay symptoms manifest, leading to compromised tissue integrity characterized by flesh decay and mutilation. This structural alteration renders the infested tissue less compact and intact, resulting in diminished light absorption and light scattering capabilities.
Consequently, transmittance tends to be higher in the infested tissue and lower in un-infested regions. This intricate interplay between flesh mutilation, larvae presence, and decay symptoms culminates in elevated transmittance in infested sections compared to their un-infested counterparts. Furthermore, it is worth noting that Vis/NIR light interacts robustly with hydrogen bonds in fruits, thereby inducing modifications in light scattering and absorptive traits of fruit tissues.
Distinct discrepancies between un-infested and infested citrus fruits are apparent in Figure 7A,C, especially for transmittance peaks at 660 nm, 760 nm, and 830 nm. However, at 830 nm, Figure 7B showcases minimal disparity in transmittance between un-infested citrus and infested stage citrus. This could be attributed to poor light transmittance through the infested parts in this specific orientation for the “Shimen” citrus variety.
There was a greater difference in the average relative transmittance between un-infested and infested citrus detected in orientation A (Figure 7A), underscoring its potential suitability for identifying B. dorsalis infestations. Moreover, discernible differences surface in the relative transmittance of the three stages of the multi-path compared to that of the single-path. While marginal distinctions exist in the relative transmittance of the three stages in certain instances (e.g., path 1 of orientation B, Figure 5C,D and Figure 6C,D), this suggests that analyzing most samples using a solitary light path might overlook vital infestation site data.
Hence, the multi-path spectral detection approach emerges as better suited for evaluating B. dorsalis infestation in citrus fruits. In conclusion, the conducted analysis underscores the complex interplay between tissue integrity, decay symptoms, and light interaction in infested citrus fruits, validating the efficacy of the multi-path spectral method for robustly assessing B. dorsalis infestations.

3.3. Single-Path Detection Model Identification and Classification of Infested Citrus

The results obtained from the modeling of four single-path spectra across three orientations are depicted in Figures S6–S8. Through the application of the PLS-DA model, a clear distinction emerged between samples exhibiting slight and significant infestations. It was observed that, with escalating levels of infestation, the central distances within the sample aggregation areas for both un-infested and infested citrus specimens displayed irregular patterns. This irregularity signified varying infestation conditions along different paths, consequently impacting the predictive accuracy. Furthermore, instances of overlap were noted between the clustered regions of UI-3 and UI-7 samples in certain paths. This overlapping indicated that distinct detection sites of citrus, as illuminated by diverse light paths, exerted an influence on the spectral analysis.
In Figure 8, the comprehensive classification accuracy of the four-path citrus test set, utilizing the sample set partitioning algorithm in conjunction with the PLS-DA model, is showcased. The outcomes of the classification for the four paths across the three orientations (A, B, and C) are illustrated in Figures S9–S11. These results revealed variations in the classification outcomes among different paths and orientations.
Specifically, in orientation A, the accuracy levels across the four paths ranged from 84.5% to 90.5%, yielding an average accuracy of 87.5%. Path 1 exhibited the highest accuracy, while path 2 displayed the lowest. As for orientation B, the accuracy of the four paths ranged from 79.7% to 84.5%, with an average accuracy of 80.7%. Path 2 showcased the highest accuracy, while path 4 exhibited the lowest. In orientation C, the accuracy across the four paths spanned from 81.0% to 85.7%, with an average accuracy of 83.3%. Path 2 boasted the highest accuracy, while path 3 demonstrated the lowest.
The variation in the optimal detection path across different orientations became evident. Path 1 emerged as the most effective detection path in orientation A, boasting a high accuracy of 90.5%. Conversely, in orientations B and C, path 2 emerged as the most reliable, with accuracies of 84.5% and 85.7%, respectively. This discrepancy could be attributed to the substantial collection of spectral data from the infested part of citrus under the optimal detection path for each orientation. Consequently, the accuracy of the best detection path was notably elevated.
The diverse accuracy levels of the different paths further validated the conclusions drawn from the analysis of the spectral characteristics. The varied infestation locations of B. dorsalis within citrus specimens led to distinct detection patterns under different pathways. Table 2 provides an overview of the classification accuracy ranges for the four paths across the three fruit orientations.
Overall, orientation A exhibited superior outcomes for both the training and test sets. Comparatively, orientations B and C experienced average enhancement rates of 8.4% and 5.0%, respectively, in the test set. These findings aligned with the hypothesis based on transmittance data, suggesting that orientation A might be optimal for detection. Hence, the modeling results strongly advocated for the suitability of orientation A as the preferred direction for detecting B. dorsalis infestations in citrus samples.

3.4. Multi-Path Detection Model Identification and Classification of Infested Citrus

The presented study investigated the modeling outcomes of four-path average spectra across three orientations, as depicted in Figure S11. Notably, the scores of Principal Components (PCs) for the PLS-DA models UI-3 and UI-7 exhibited minimal distinctions, implying that the influence of storage time on classification was limited. Additionally, the employment of the average spectrum appeared to mitigate the impact of diverse detection sites on citrus spectra, promoting more consistent classification outcomes.
The data unveiled a discernible stratification among un-infested, slightly infested, and severely infested citrus stages. Importantly, these classifications displayed a lack of overlap, reinforcing the substantial impact of B. dorsalis infestation on citrus classification. When juxtaposed with single-path spectral modeling, the classification regions based on the average spectrum showcased enhanced regularity and a lack of intersection. This underscored the advantages of the multi-path approach in maintaining clearer boundaries between classifications.
A noteworthy trend emerged as the infestation duration increased—namely, the central distance between the cluster regions of un-infested and infested citrus fruit grew gradually, further underscoring the discriminatory potential of the methodology.
Turning our attention to the PLS-DA model’s overall classification accuracy for training and test sets across three orientations, Figure 9 demonstrated the outcomes. Remarkably, the test set’s average spectral classification accuracy reached 92.9%, 89.3%, and 90.5% for the three orientations, respectively. These figures represented improvements of 2.7%, 5.7%, and 5.6% compared to the classification accuracies of the best single-path spectra. The rationale behind these gains could be attributed to the distinct behavior of light absorption and scattering on infested areas in each path and orientation, leading to variable and less stable detection results, as evident in Figure 8. In contrast, the employment of multiple paths enabled a steadier transmission of light to the infested portions, culminating in more comprehensive information acquisition and consequently yielding superior and more stable classification outcomes.
Comparing the average spectrum’s performance between the training and test sets, the observed discrepancy was smaller than that seen with the single-path spectrum. These findings robustly underscored the comparable efficacy of the four-path average spectra relative to the single-path spectrum for detecting B. dorsalis infestation in citrus. Consequently, the test results based on the average spectra of the four paths consistently outperformed those relying solely on the best individual path.
The classification results of both un-infested and infested citrus, based on the PLS-DA model utilizing the average spectrum, have been further subdivided and presented in Table 3. Notably, when analyzing the accuracy of classification between un-infested and infested citrus fruit across different fruit orientations, it becomes evident that the accuracy for un-infested citrus fruit consistently outperformed that of infested citrus fruit.
This discrepancy in accuracy can be attributed to inherent differences in the composition of un-infested and infested citrus fruit. Specifically, un-infested citrus pulp tends to exhibit a higher degree of uniformity and structural integrity, which facilitates more accurate and reliable classification. In contrast, infested citrus fruit displays a varying degree of infestation, ranging from mild to severe, owing to potential disparities in the physiological defenses of individual citrus fruits. This variance in infestation severity introduces complexity to the classification process, leading to comparatively lower accuracy rates for infested citrus fruit.
A closer examination of the test set outcomes, as depicted in Figure 10, provides additional insights. The classification accuracy for orientation A stands out as the highest among the orientations, achieving an accuracy of 92.1% with a Kappa value of 0.89. This outcome is noteworthy because it underscores the effectiveness of utilizing the average spectrum for orientation A in accurately distinguishing between un-infested citrus fruit (95.2% accuracy), slightly infested citrus fruit (81.0% accuracy), and seriously infested citrus fruit (100.0% accuracy). Similar trends in accuracy are observed for orientations B and C, further affirming the robustness of the approach.
In comparing the findings of this study with prior research endeavors aimed at detecting agricultural product irregularities, it becomes evident that the developed multi-light Vis/NIR system exhibits good performance. For instance, in the context of fruit pest and internal defect detection, the achieved recognition accuracy of 92.9% using the MSC-CARS-PLS-DA method surpasses the recognition accuracies of other methods applied to different fruits. Notable examples include mango pest detection using single optical path spectral reflectance spectroscopy and the FLD method, yielding an accuracy of 84.5% [50]. Similarly, cherry defect detection employing single-optical path spectroscopy and the CDA method demonstrated an accuracy of 85.0% [17]. The pericarp hardening detection in mangosteen fruit, carried out through single-optical path absorption spectroscopy and the PLS-DA method, yielded an identification accuracy of 91.0% [51]. Meanwhile, the PLS-DA method applied to multispectral semi-transmission detection of apple moldy heart achieved an impressive identification accuracy of 93.1% [26].
Given the intricate nature of citrus pest detection, the multi-path spectroscopy coupled with the MSC-CARS-PLS-DA method emerges as a dependable approach, offering a recognition accuracy of 92.9% and a Kappa value of 0.89. This level of accuracy underscores the system’s reliability in identifying citrus infestations caused by B. dorsalis. Hence, it is recommended to employ the average spectrum derived from the four paths corresponding to fruit orientation A.
The application of the developed multi-path visible/near-infrared spectroscopy system in packaging facilities or orchards holds significant potential. This technology efficiently detects the B. dorsalis pest, enhancing detection reliability through multi-path spectroscopic analysis, aiding growers in timely citrus infestation management and reducing pest impact. The system enables detection across different pest stages, facilitating precise formulation of control strategies. Economically, the system application enables early pest detection, minimizing losses, enhancing yield and quality, reducing pesticide usage costs, and driving sustainable development. Nevertheless, careful consideration of equipment and operational costs is essential, requiring economic analysis for assessing investment returns and feasibility. Proper training for users in operation and result interpretation is equally crucial. In conclusion, the multi-path spectroscopy system offers novel possibilities for citrus pest detection, despite challenges that need to be overcome, with the potential for maximizing benefits.

4. Conclusions

In conclusion, a multipath visible/near-infrared system for diffuse transmission was constructed and successfully used to detect B. dorsalis infestation in citrus fruits. Spectral data of different infestation stages of citrus fruits were collected and modeled for prediction using the SPXY-MSC-CARS-PLS-DA method. Experiments on “Shimen” citrus fruits showed that the average spectra of the four detection paths resulted in a good agreement of the classification model for each fruit orientation, and that the spectral characteristics of healthy and infested citrus were significantly different, which was affected by the relative positions of the detection paths and the fruit orientation. The classification accuracy of PLSDA varied with the position of the detection paths. The average spectral model accuracies for orientations A, B and C were 92.9%, 89.3%, and 90.5%, respectively, improving the classification accuracy by 2.7%, 5.7%, and 5.6% compared to the best performing single path PLS-DA model. Orientation A (i.e., stalk facing up) obtained the best classification from the PLSDA model.
The study’s limitations include a focus on B. dorsalis infestation in citrus fruits. Future research could extend the multi-path Vis/NIR spectroscopy system to other pests and fruit types. The study’s lab-based approach highlights the need for field trials to validate its performance under real conditions. To advance this research, optimizing the spectroscopy system and gathering diverse datasets are crucial for accuracy and robustness across citrus species and fruits. Field trials are essential for practical validation, considering environmental variations. The multi-path Vis/NIR spectroscopy system shows promise in pest detection, requiring ongoing development and rigorous field testing for effective agricultural pest management.

Supplementary Materials

The following supporting information can be downloaded at: https://www.mdpi.com/article/10.3390/agriculture13081642/s1, Figure S1, Original spectra and MSC processed spectra under orientation A; Figure S2, Original spectra and MSC processed spectra under orientation B; Figure S3, Original spectra and MSC processed spectra under orientation C; Figure S4, Original spectra and MSC processed spectra of the average spectra; Figure S5, PLS-DA analysis results of four paths in orientation A. A Path 1, B Path 2, C Path 3, and D Path 4; Figure S6, PLS-DA analysis results of four paths in orientation B. A Path 1, B Path 2, C Path 3, and D Path 4; Figure S7, PLS-DA analysis results of four paths in orientation C. A Path 1, B Path 2, C Path 3, and D Path 4; Figure S8, Classification of citrus fruit according to the stages of infestation in test set: confusion matrix of four light path spectra in orientation A; Figure S9, Classification of citrus fruit according to the stages of infestation in test set: confusion matrix of four light path spectra in orientation B; Figure S10, Classification of citrus fruit according to the stages of infestation in test set: confusion matrix of four light path spectra in orientation C; Figure S11, PLS-DA test set results for average spectra of four paths in three fruit orientations. (A) orientation A, (B) orientation B, (C) orientation C; Figure S12, The interface of the developed multi-path NIR spectroscopic system; Figure S13, Scheme of the multi-path NIR spectroscopic system; Figure S14, The developed multi-path NIR spectroscopic system control logic.

Author Contributions

Data curation, Z.G.; Formal analysis, Z.T.; Funding acquisition, D.L. and T.W.; Investigation, D.L. and L.H.; Methodology, D.L. and J.L.; Project administration, H.P. and T.W.; Resources, L.W. and T.W.; Supervision, H.P. and T.W.; Writing—original draft, D.L. and J.L. All authors have read and agreed to the published version of the manuscript.

Funding

This research was funded by the Natural Science Foundation for Distinguished Young Scholars of Hunan Province (2023JJ10099), the National Natural Science Foundation of China (32060577), the Natural Science Foundation of Hunan Province, China (2020JJ4142), the Hunan Forestry Science and Technology Project for Distinguished Young Scholars (XLK202108-7), the Key Scientific Research Project of Education Department of Hunan Province, China (20A515, 220187), the Key Research and Development Program of Hunan Province, China (2022NK2048), and the Hunan Provincial Innovation Foundation for Postgraduate (CX20200734).

Institutional Review Board Statement

Not applicable.

Data Availability Statement

The data presented in this study are available on request from the corresponding author.

Conflicts of Interest

The authors declared that they have no known competing financial interests or personal relationships that could have appeared to influence the work reported in this paper.

References

  1. USDA-GAIN, United States Department of Agriculture Foreign Agricultural Service. Global Agricultural Information Network. China: Citrus Annual. Available online: https://fas.usda.gov/data/china-citrus-annual-4 (accessed on 20 December 2021).
  2. Zhu, L.; Wang, X.; Huang, F.; Zhang, J.; Li, H.; Ding, D.; Hyde, K.D. A Destructive New Disease of Citrus in China Caused by Cryptosporiopsis citricarpa sp. nov. Plant Dis. 2012, 96, 804–812. [Google Scholar] [CrossRef]
  3. Mutamiswa, R.; Nyamukondiwa, C.; Chikowore, G.; Chidawanyika, F. Overview of oriental fruit fly, Bactrocera dorsalis (Hendel) (Diptera: Tephritidae) in Africa: From invasion, bio-ecology to sustainable management. Crop Protect. 2021, 141, 105492. [Google Scholar] [CrossRef]
  4. Liu, H.; Zhang, D.-J.; Xu, Y.-J.; Wang, L.; Cheng, D.-F.; Qi, Y.-X.; Zeng, L.; Lu, Y. Invasion, expansion, and control of Bactrocera dorsalis (Hendel) in China. J. Integr. Agric. 2019, 18, 771–787. [Google Scholar] [CrossRef]
  5. Bradley, F.M.; Ellis, B.W.; Martin, D.L. The Organic Gardener’s Handbook of Natural Pest and Disease Control: A Complete Guide to Maintaining a Healthy Garden and Yard the Earth-Friendly Way; Rodale Books: Emmaus, PA, USA, 2010. [Google Scholar]
  6. Mas, F.; Manning, L.-A.; Alavi, M.; Osborne, T.; Reynolds, O.; Kralicek, A. Early detection of fruit infested with Bactrocera tryoni. Postharvest Biol. Technol. 2021, 175, 111496. [Google Scholar] [CrossRef]
  7. Magwaza, L.S.; Opara, U.L.; Terry, L.A.; Landahl, S.; Cronje, P.J.; Nieuwoudt, H.; Mouazen, A.M.; Saeys, W.; Nicolaï, B.M. Prediction of ‘Nules Clementine’ mandarin susceptibility to rind breakdown disorder using Vis/NIR spectroscopy. Postharvest Biol. Technol. 2012, 74, 1–10. [Google Scholar] [CrossRef]
  8. Bobelyn, E.; Serban, A.-S.; Nicu, M.; Lammertyn, J.; Nicolai, B.M.; Saeys, W. Postharvest quality of apple predicted by NIR-spectroscopy: Study of the effect of biological variability on spectra and model performance. Postharvest Biol. Technol. 2010, 55, 133–143. [Google Scholar] [CrossRef]
  9. Da-Wen, S. (Ed.) Computer Vision Technology for Food Quality Evaluation; Academic Press: Cambridge, MA, USA, 2016. [Google Scholar]
  10. Momin, M.A.; Kondo, N.; Ogawa, Y.; Ido, K.; Ninomiya, K. Patterns of Fluorescence Associated with Citrus Peel Defects. Engineering in Agriculture. Environ. Food. 2013, 6, 54–60. [Google Scholar]
  11. Kim, T.; Lee, J.; Sun, G.-M.; Park, B.-G.; Park, H.-J.; Choi, D.-S.; Ye, S.-J. Comparison of X-ray computed tomography and magnetic resonance imaging to detect pest-infested fruits: A pilot study. Nucl. Eng. Technol. 2022, 54, 514–522. [Google Scholar] [CrossRef]
  12. Suchanek, M.; Kordulska, M.; Olejniczak, Z.; Figiel, H.; Turek, K. Application of low-field MRI for quality assessment of ‘Conference’ pears stored under controlled atmosphere conditions. Postharvest Biol. Technol. 2017, 124, 100–106. [Google Scholar] [CrossRef]
  13. Vélez Rivera, N.; Gómez-Sanchis, J.; Chanona-Pérez, J.; Carrasco, J.J.; Millán-Giraldo, M.; Lorente, D.; Cubero, S.; Blasco, J. Early detection of mechanical damage in mango using NIR hyperspectral images and machine learning. Biosys. Eng. 2014, 122, 91–98. [Google Scholar] [CrossRef]
  14. Bulanon, D.M.; Burks, T.F.; Alchanatis, V. Study on temporal variation in citrus canopy using thermal imaging for citrus fruit detection. Biosys. Eng. 2008, 101, 161–171. [Google Scholar] [CrossRef]
  15. Rajendran, S. Detection of Insect Infestation in Stored Foods. In Advances in Food and Nutrition Research; Academic Press: Cambridge, MA, USA, 2005; Volume 49, pp. 163–232. [Google Scholar]
  16. Wang, J.; Nakano, K.; Ohashi, S.; Takizawa, K.; He, J.G. Comparison of different modes of visible and near-infrared spectroscopy for detecting internal insect infestation in jujubes. J. Food Eng. 2010, 101, 78–84. [Google Scholar] [CrossRef]
  17. Xing, J.; Guyer, D. Comparison of transmittance and reflectance to detect insect infestation in Montmorency tart cherry. Comput. Electron. Agric. 2008, 64, 194–201. [Google Scholar] [CrossRef]
  18. Magwaza, L.S.; Landahl, S.; Cronje, P.J.R.; Nieuwoudt, H.H.; Mouazen, A.M.; Nicolaï, B.M.; Terry, L.A.; Opara, U.L. The use of Vis/NIRS and chemometric analysis to predict fruit defects and postharvest behaviour of ‘Nules Clementine’ mandarin fruit. Food Chem. 2014, 163, 267–274. [Google Scholar] [CrossRef]
  19. Zhang, Y.; Lee, W.S.; Li, M.; Zheng, L.; Ritenour, M.A. Non-destructive recognition and classification of citrus fruit blemishes based on ant colony optimized spectral information. Postharvest Biol. Technol. 2018, 143, 119–128. [Google Scholar] [CrossRef]
  20. Wang, J.; Wang, J.; Chen, Z.; Han, D. Development of multi-cultivar models for predicting the soluble solid content and firmness of European pear (Pyrus communis L.) using portable vis–NIR spectroscopy. Postharvest Biol. Technol. 2017, 129, 143–151. [Google Scholar] [CrossRef]
  21. Tilahun, S.; Park, D.S.; Seo, M.H.; Hwang, I.G.; Kim, S.H.; Choi, H.R.; Jeong, C.S. Prediction of lycopene and β-carotene in tomatoes by portable chroma-meter and VIS/NIR spectra. Postharvest Biol. Technol. 2018, 136, 50–56. [Google Scholar] [CrossRef]
  22. Dos Santos Costa, D.; Oliveros Mesa, N.F.; Santos Freire, M.; Pereira Ramos, R.; Teruel Mederos, B.J. Development of predictive models for quality and maturation stage attributes of wine grapes using vis-nir reflectance spectroscopy. Postharvest Biol. Technol. 2019, 150, 166–178. [Google Scholar] [CrossRef]
  23. Casson, A.; Beghi, R.; Giovenzana, V.; Fiorindo, I.; Tugnolo, A.; Guidetti, R. Environmental advantages of visible and near infrared spectroscopy for the prediction of intact olive ripeness. Biosyst. Eng. 2020, 189, 1–10. [Google Scholar] [CrossRef]
  24. Tian, S.; Wang, S.; Xu, H. Early detection of freezing damage in oranges by online Vis/NIR transmission coupled with diameter correction method and deep 1D-CNN. Comput. Electron. Agric. 2022, 193, 106638. [Google Scholar] [CrossRef]
  25. Tian, X.; Wang, Q.; Huang, W.; Fan, S.; Li, J. Online detection of apples with moldy core using the Vis/NIR full-transmittance spectra. Postharvest Biol. Technol. 2020, 168, 111269. [Google Scholar] [CrossRef]
  26. Huang, Y.; Lu, R.; Chen, K. Detection of internal defect of apples by a multichannel Vis/NIR spectroscopic system. Postharvest Biol. Technol. 2020, 161, 111065. [Google Scholar] [CrossRef]
  27. Javeed, A.; Dallora, A.L.; Berglund, J.S.; Idrisoglu, A.; Ali, L.; Rauf, H.T.; Anderberg, P. Early Prediction of Dementia Using Feature Extraction Battery (FEB) and Optimized Support Vector Machine (SVM) for Classification. Biomedicines 2023, 11, 439. [Google Scholar] [CrossRef]
  28. Tanveer, M.; Rajani, T.; Rastogi, R.; Shao, Y.H.; Ganaie, M.A. Comprehensive review on twin support vector machines. Ann. Oper. Res. 2022, 5, 1–46. [Google Scholar] [CrossRef]
  29. Lee, L.C.; Liong, C.Y.; Jemain, A.A. Partial least squares-discriminant analysis (PLS-DA) for classification of high-dimensional (HD) data: A review of contemporary practice strategies and knowledge gaps. Analyst 2018, 143, 3526–3539. [Google Scholar] [CrossRef]
  30. Quan, N.M.; Phung, H.M.; Uyen, L.; Dat, L.Q.; Ngoc, L.G.; Hoang, N.M.; Ai, C.T.D.; Trinh, D.N.T. Species and geographical origin authenticity of green coffee beans using UV–VIS spectroscopy and PLS–DA prediction model. Food Chem. Adv. 2023, 2, 100281. [Google Scholar] [CrossRef]
  31. Baratella, V.; Pucci, C.; Paparatti, B.; Speranza, S. Response of Bactrocera oleae to different photoperiods and temperatures using a novel method for continuous laboratory rearing. Biol. Control 2017, 110, 79–88. [Google Scholar] [CrossRef]
  32. Saeed, M.; Ahmad, T.; Alam, M.; Al-Shuraym, L.A.; Ahmed, N.; Ali Alshehri, M.; Ullah, H.; Sayed, S.M. Preference and performance of peach fruit fly (Bactrocera zonata) and Melon fruit fly (Bactrocera cucurbitae) under laboratory conditions. Saudi J. Biol. Sci. 2022, 29, 2402–2408. [Google Scholar] [CrossRef] [PubMed]
  33. Kim, S.B.; Kim, D.-S. A tentative evaluation for population establishment of Bactrocera dorsalis (Diptera: Tephritidae) by its population modeling: Considering the temporal distribution of host plants in a selected area in Jeju, Korea. J. Asia-Pacif. Entomol. 2018, 21, 451–465. [Google Scholar] [CrossRef]
  34. Tian, S.; Zhang, M.; Li, B.; Zhang, Z.; Zhao, J.; Zhang, Z.; Zhang, H.; Hu, J. Measurement orientation compensation and comparison of transmission spectroscopy for online detection of moldy apple core. Infrared Phys. Technol. 2020, 111, 103510. [Google Scholar] [CrossRef]
  35. Zontov, Y.V.; Rodionova, O.Y.; Kucheryavskiy, S.V.; Pomerantsev, A.L. PLS-DA–A MATLAB GUI tool for hard and soft approaches to partial least squares discriminant analysis. Chemom. Intellig. Lab. Syst. 2020, 203, 104064. [Google Scholar] [CrossRef]
  36. Qin, Y.; Song, K.; Zhang, N.; Wang, M.; Zhang, M.; Peng, B. Robust NIR quantitative model using MIC-SPA variable selection and GA-ELM. Infrared Phys. Technol. 2023, 128, 104534. [Google Scholar] [CrossRef]
  37. Galvão, R.K.H.; Araujo, M.C.U.; José, G.E.; Pontes, M.J.C.; Silva, E.C.; Saldanha, T.C.B. A method for calibration and validation subset partitioning. Talanta 2005, 67, 736–740. [Google Scholar] [CrossRef] [PubMed]
  38. Phatak, A. A User-Friendly Guide to Multivariate Calibration and Classificationtion, T. Næs, T. Isaksson, T. Fearn, T. Davies: Chichester: NIR Publications. Chemom. Intellig. Lab. Syst. 2004, 71, 79–81. [Google Scholar] [CrossRef]
  39. Maleki, M.R.; Mouazen, A.M.; Ramon, H.; De Baerdemaeker, J. Multiplicative Scatter Correction during On-line Measurement with Near Infrared Spectroscopy. Biosys. Eng. 2007, 96, 427–433. [Google Scholar] [CrossRef]
  40. Li, H.; Liang, Y.; Xu, Q.; Cao, D. Key wavelengths screening using competitive adaptive reweighted sampling method for multivariate calibration. Anal. Chim. Acta 2009, 648, 77–84. [Google Scholar] [CrossRef]
  41. Li, Y.; Yang, X. Quantitative analysis of near infrared spectroscopic data based on dual-band transformation and competitive adaptive reweighted sampling. Spectrochim. Acta Part A Mol. Biomol. Spectrosc. 2023, 285, 121924. [Google Scholar] [CrossRef]
  42. Sampaio, P.S.; Castanho, A.; Almeida, A.S.; Oliveira, J.; Brites, C. Identification of rice flour types with near-infrared spectroscopy associated with PLS-DA and SVM methods. Eur. Food Res. Technol. 2020, 246, 527–537. [Google Scholar] [CrossRef]
  43. Brereton, R.G.; Lloyd, G.R. Partial least squares discriminant analysis: Taking the magic away. J. Chemom. 2014, 28, 213–225. [Google Scholar] [CrossRef]
  44. Bylesjö, M.; Rantalainen, M.; Cloarec, O.; Nicholson, J.K.; Holmes, E.; Trygg, J. OPLS discriminant analysis: Combining the strengths of PLS-DA and SIMCA classification. J. Chemom. A J. Chemom. Soc. 2006, 20, 341–351. [Google Scholar] [CrossRef]
  45. Isinkaralar, O.; Varol, C. A cellular automata-based approach for spatio-temporal modeling of the city center as a complex system: The case of Kastamonu, Türkiye. Cities 2023, 132, 104073. [Google Scholar] [CrossRef]
  46. Sim, J.; Wright, C.C. The kappa statistic in reliability studies: Use, interpretation, and sample size requirements. Phys. Ther. 2005, 85, 257–268. [Google Scholar] [CrossRef]
  47. Tadeo, F.R.; Terol, J.; Rodrigo, M.J.; Licciardello, C.; Sadka, A. Chapter 12—Fruit growth and development. In The Genus Citrus; Talon, M., Caruso, M., Gmitter, F.G., Eds.; Woodhead Publishing: Sawston, UK, 2020; pp. 245–269. [Google Scholar]
  48. Liu, N.; Yang, W.; Li, X.; Zhao, P.; Liu, Y.; Guo, L.; Huang, L.; Gao, W. Comparison of characterization and antioxidant activity of different citrus peel pectins. Food Chem. 2022, 8, 132683. [Google Scholar] [CrossRef]
  49. Weyer, L. Practical Guide to Interpretive Near-Infrared Spectroscopy; CRC Press: Boca Raton, FL, USA, 2007. [Google Scholar]
  50. Raghavendra, A.; Guru, D.S.; Rao, M.K. Mango internal defect detection based on optimal wavelength selection method using NIR spectroscopy. Artif. Intell. Agric. 2021, 5, 43–51. [Google Scholar] [CrossRef]
  51. Teerachaichayut, S.; Terdwongworakul, A.; Thanapase, W.; Kiji, K. Non-destructive prediction of hardening pericarp disorder in intact mangosteen by near infrared transmittance spectroscopy. J. Food Eng. 2011, 106, 206–211. [Google Scholar] [CrossRef]
Figure 1. Un-infested and infested ‘Shimen’ citrus at different stages of internal infestation (from small, isolated tissues to the entire region, including larvae in the pulp), with red perimeter marks.
Agriculture 13 01642 g001
Figure 2. ‘Shimen’ citrus samples of control and infested groups were used in the study.
Agriculture 13 01642 g002
Figure 3. Schematic diagram of the VIS-NIR spectral acquisition system.
Agriculture 13 01642 g003
Figure 4. Diagram showing the data collection process and the process of developing a classification model.
Agriculture 13 01642 g004
Figure 5. Control group: Spectra acquired from the four paths in orientation A (A,B), B (C,D), and C (E,F).
Agriculture 13 01642 g005
Figure 6. Infested group: Spectra acquired from the four paths in orientation A (A,B), B (C,D), and C (E,F).
Agriculture 13 01642 g006
Figure 7. Total classification accuracies based on the average relative transmittance spectra acquired for the four paths and the three fruit orientations for the test set of citruses using a partial least squares discriminant analysis (PLS-DA). (A) refers to the average relative spectrograms with fruit stalks facing up, (B) refers to the average relative spectrograms with fruit stalks at the level of the fruit stalks, and (C) refers to the average relative spectrograms with fruit stalks facing down.
Agriculture 13 01642 g007
Figure 8. The results of three sample orientations on the average spectrum of SPXY-MSC-CARS-PLS-DA in four paths. (A) Orientation A, (B) Orientation B, (C) Orientation C.
Agriculture 13 01642 g008
Figure 9. Overall classification accuracies for three fruit orientations (A, B and C) of average spectra from the four detection fibers for the training set and the test set using PLS-DA.
Agriculture 13 01642 g009
Figure 10. PLS-DA test set results for average spectra of four paths in three fruit orientations. (A) Orientation A, (B) Orientation B, and (C) Orientation C.
Agriculture 13 01642 g010
Table 1. Training set and test set of samples.
Samples SetTotalUn-Infested (3d)Un-Infested (7d)Slightly Infested (3d)Seriously Infested (7d)
Training set16842424242
Test set8421212121
Table 2. Ranges and averages of classification accuracies (%) for ‘Shimen’ citrus, using a partial least squares discriminant analysis (PLS-DA) of the four detection paths and the three fruit orientations.
Orientation *Training (%)Test (%)
RangeAverageRangeAverage
A88.1–90.588.784.5–90.587.5
B80.3–85.782.679.7–84.580.7
C83.3–88.185.981.0–85.783.3
* A: fruit stalks facing upward, B: fruit stalks facing horizontally, and C: fruit stalks facing downward.
Table 3. Un-infested and infested ‘Shimen’ citrus fruits were classified using a partial least squares discriminant analysis of the average spectra from four paths in three orientations.
Orientation *ClassificationTraining SetTest Set
Un-Infested
(84)
Slightly
(42)
Seriously
(42)
Accuracy
(%)
Un-Infested
(42)
Slightly
(21)
Seriously
(21)
Kappa
Parameters
AUn-infested822097.64020A = 0.93
Slightly038490.50174PR = 0.37
Seriously00421000021Kappa = 0.89
BUn-infested768090.53741A = 0.89
Slightly136585.71191PR = 0.50
Seriously043890.50219Kappa = 0.79
CUn-infested786092.93840A = 0.91
Slightly136585.70183PR = 0.37
Seriously024095.20120Kappa = 0.85
* A: fruit stalks facing upward, B: fruit stalks facing horizontally, and C: fruit stalks facing downward.
Disclaimer/Publisher’s Note: The statements, opinions and data contained in all publications are solely those of the individual author(s) and contributor(s) and not of MDPI and/or the editor(s). MDPI and/or the editor(s) disclaim responsibility for any injury to people or property resulting from any ideas, methods, instructions or products referred to in the content.

