
What Mars Maps Got Right (and Wrong) Through Time
From the first map of Mars in 1831 to a new gravity map released in March, cartography has shaped how we understand the red planet.
Tracing the history of Mars maps is like taking a visual tour of how our thinking about the red planet has changed. Each new telescope and space mission brought about a leap in understanding that is reflected in the maps that followed.
These days our knowledge about Earth's second closest neighbor in the solar system grows by the hour, as the Curiosity and Opportunity rovers explore the Martian surface with five active satellites orbiting above them. And on October 19, the fleet grew by at least one with the successful arrival of the ExoMars Trace Gas Orbiter—although it's not yet clear whether the mission's lander made it safely to the surface.
This month, National Geographic magazine published a beautifully detailed new map of Mars based on the latest imagery and data from these missions. “In many ways Mars is better mapped than Earth, as no features are hidden from study,” says National Geographic’s planetary cartographer Matt Chwastyk.
Scientists and cartographers had far less to go on before there were so many robots studying Mars on humans’ behalf, but that didn’t stop them from making maps. The maps reflected their evolving ideas about the planet—what it was made of, whether it was habitable, who might be living there. And sometimes it was the maps themselves that shaped people’s view of Mars.
From our earliest sketches of blobs and shadows, to the suspicion of Martian-made canals, to our fine-tuned understanding of the planet’s gravity, maps of Mars have both informed us and inspired our imaginations.
1600s to the 1880s: Light and Dark Become Land and Sea

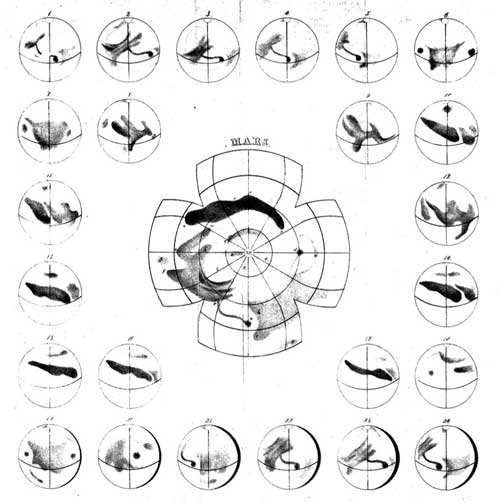
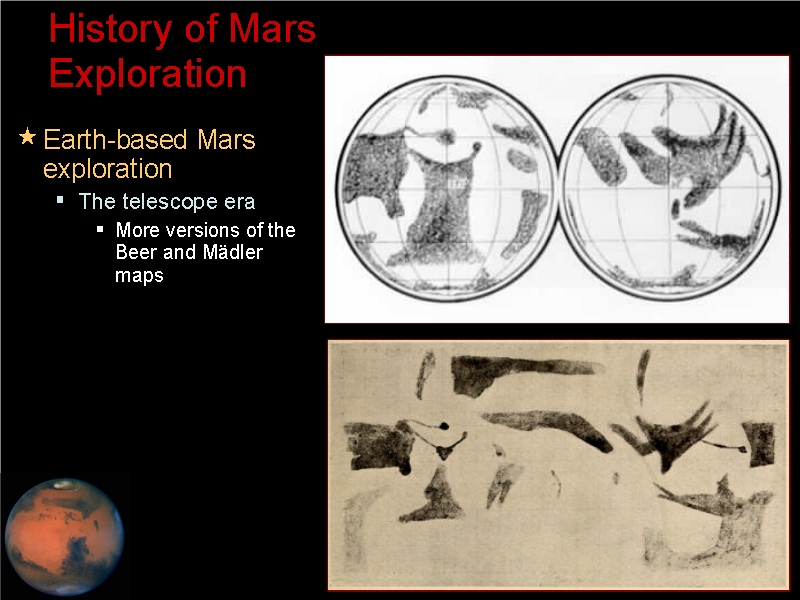
Galileo Galilei was the first to look at Mars through a telescope in 1610, but he couldn’t see any detail. As telescopes improved and the planet’s surface began slowly coming into focus, scientists started sketching what they saw. Giovanni Cassini, William Herschel, Robert Hooke, and Christiaan Huygens all tried their hand at drawing the planet’s basic features in the 17th and 18th centuries. But German astronomers Johann Mädler and Wilhelm Beer made the first true map of Mars.
In 1831 they began putting what they thought might be permanent geologic features onto a geographic grid, and they established a global coordinate system for Mars. Their prime meridian is still used today and is where the Meridiani Planum region of Mars gets its name. In the following years they made several maps of Mars, including the one above from 1840. All of Mädler and Beer’s maps, which were based on their own telescope observations of the planet, basically consisted of dark splotches on a white background. But many of the features are identifiable today, such as the large, bright impact crater Hellas Planitia and the dark Solis Lacus, the “Eye of Mars.”

In the ensuing decades, many more scientists tried observing and sketching the features of Mars, and they argued over whether the dark areas were seas. Some of the best sketches from this period came from Reverend W. R. Dawes, who had a reputation for being eagle-eyed. The British astronomer Richard Proctor based his maps on Dawes’ drawings, including the one above published in his 1870 book Other Worlds Than Ours.
Proctor interpreted Mars's light and dark spots as continents and seas, with ice caps at each planetary pole. And he was the first to label these features, honoring famous astronomers who had contributed observations of Mars with names like Cassini Land, Dawes Ocean, J. Herschel Strait, and Beer Sea.
It was around this time that speculation about the habitability of Mars picked up steam, spurred by the vision of continents and seas similar to those on Earth. In his book, Proctor wrote: “Processes are at work out yonder in space which appear utterly useless, a real waste of Nature’s energies, unless, like their correlatives on earth, they subserve the wants of organized beings.”

Proctor continued to produce more maps, and other areographers, or Mars geographers, followed in his style. French astronomer Camille Flammarion’s maps, such as the example above, bear a strong resemblance to Proctor’s. And Flammarion similarly believed the planet could support life.
In 1873, he wrote in La Nature (and translated by Popular Science Monthly): “On earth the smallest drop of water is peopled with myriads of animalcules, and earth and sea are filled with countless species of animals and plants; and it is not easy to conceive how, under similar conditions, another planet should be simply a vast and useless desert.”
1880s to Early 1900s: When Mars Had Canals

All the speculation about life influenced how subsequent maps of Mars were interpreted. In the late 1870s Italian astronomer Giovanni Schiaparelli began making maps of Mars based on his observations at the Brera Observatory in Milan. At first, his maps looked very similar to Flammarion’s, but with time the linear features on his maps became much straighter and more prominent, such as in the map above from 1884. People couldn’t resist interpreting the lines as the work of intelligent beings.
Though he didn’t completely rule out the possibility that the lines could be unnatural, Schiaparelli was skeptical. But he inadvertently fanned speculation about life on Mars when he called the straight lines canali, which was translated into English as canals, further tempting people to see them as artificial. In Italian, however, the word is also commonly used to mean natural channels, and this is the sense that Schiaparelli had in mind. He wrote in 1893, “It is not necessary to suppose them the work of intelligent beings, and, notwithstanding the almost geometric appearance of all of their system, we are now inclined to believe them to be produced by the evolution of the planet, just as on earth we have the English Channel and the channel of Mozambique.”

Schiaparelli’s impact on our understanding and study of Mars was long-lasting. The names he gave locations on Mars largely survive today. But the legacy that stands out most is the canali, thanks in part to American astronomer Percival Lowell, who embraced and popularized the idea that the straight lines on Schiaparelli’s maps were water conduits built by Martians.
In a lecture to the Boston Scientific Society in 1894, Lowell said, “The most self-evident explanation from the markings themselves is probably the true one; namely, that in them we are looking upon the result ot the work of intelligent beings.” Lowell published the map above in 1895 in his book, Mars, along with the names of 184 canals, 64 oases, and 40 regions (indicated by numbers on the map).
Lowell correctly anticipated that his scientific colleagues would be reluctant “to admit the possibility of peers” inhabiting other planets. But the public loved the idea, and his lectures were often packed. Lowell himself was so taken with the idea that he built an entire observatory in Flagstaff, Arizona, and spent years observing Mars and sketching its surface. Soon, however, the canals hypothesis began facing increasing criticism as scientists learned more about Mars, such as prohibitively cold surface temperatures that would rule out running water. And scientists also demonstrated that the lines could be merely the result of an optical illusion.

Lowell continued to write popular science books, culminating with Mars, the Abode of Life in 1908. His ideas persisted in the popular imagination for decades and inspired countless works of science fiction, notably Orson Welles’ 1938 radio broadcast of War of the Worlds. But the canals hung around on maps as well, including the one above from 1962 by Earl Slipher, an American astronomer who had joined Lowell Observatory in 1908.
Slipher made the map, which looks an awful lot like some of Lowell’s and Schiaparelli’s renderings, for the U.S. Air Force to use in the planning of the first Mariner flyby missions. It was these missions that would finally put to rest any lingering doubts about the canals.
1965 to 1974: A Dynamic Planet With a Giant Volcano

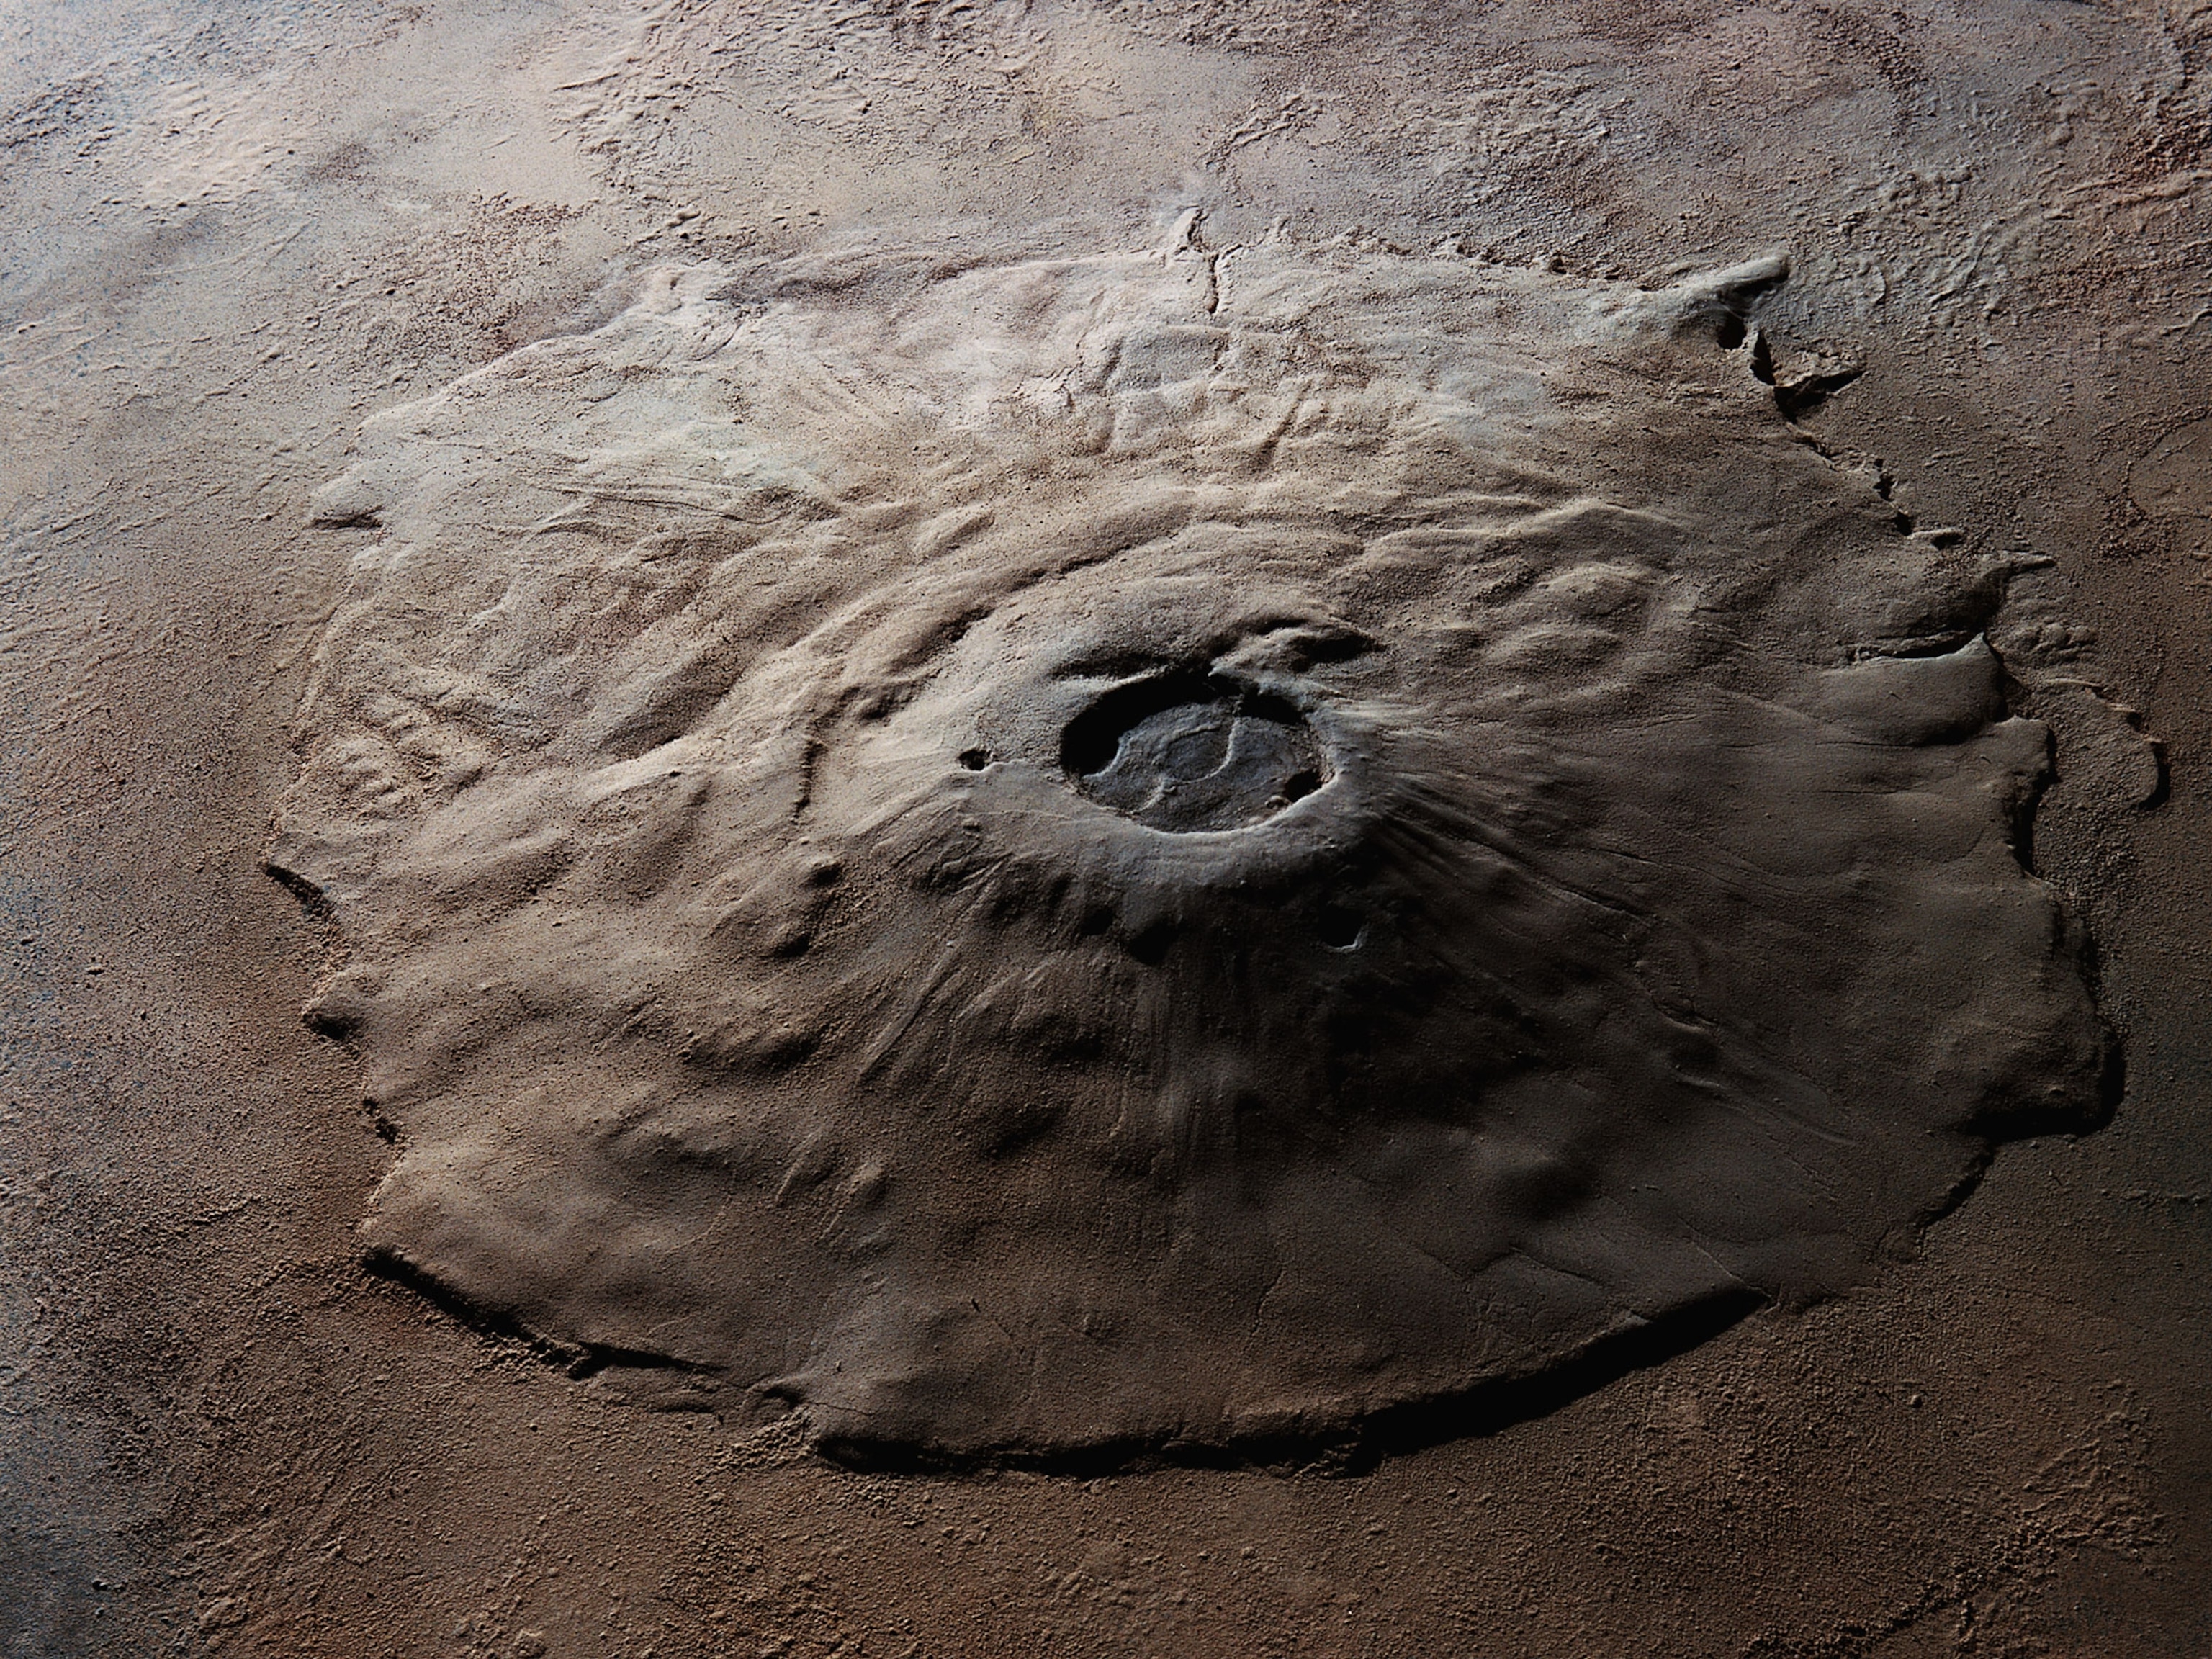
The Mariner missions resulted in the first flybys of the red planet in 1965 and 1969. Mariners 4, 6, and 7 took more than 200 images of Mars, proving that there were no oddly straight lines that could be artificial canals on the planet. Mariner 9 entered orbit around Mars in 1971 and took more than 7,000 images of the planet with a television camera. The images covered the entire surface and captured the first shots of the Martian moons Phobos and Deimos. The U.S. Geological Survey shaded relief map above is a “preliminary Mars chart” based on the Mariner 9 images.
This new view of Mars changed everything. You could see giant volcanoes, lava flows, a huge canyon, sinuous channels, landslide scars, impact craters, faults, polar ice caps, and dust storms. As USGS scientist Harold Masursky put it in his geological overview paper in 1973, the Mariner images “indicate that Mars is more varied and dynamic than previously inferred.” The volcano Nix Olympica, later renamed Olympus Mons, was discovered to be the biggest mountain in the solar system, more than twice as tall as Mount Everest.

The level of detail from the Mariner images was good enough to support the first geologic map of Mars (above). Published in 1978, it was the first geologic map of any planetary surface beyond Earth and the moon. The map’s colors represent different types of terrain. For example, the pervasive purple areas are described as hilly and cratered, while the light yellow represents smooth plains and the brighter yellow shows cratered plains. The pink colors are volcanic material, and the darker purple indicates mountains.
As Martian geology came into focus, scientists began piecing together the planet’s history. The volcanoes and mountains showed that the planet was once geologically active like Earth. But the number of craters is an indicator of the age of the surface, and they show that some Martian terrain is extraordinarily old. An updated version of the USGS map from 1986 is available for upload into modern digital mapping programs.
1975 to 2000: The Robot Invasion of Mars

In the meantime, NASA’s Viking program sent two orbiter-lander combinations to Mars. The landers safely arrived on the surface in 1975 and 1976, and the first images taken from the surface of the planet were transmitted to Earth in 1976. The orbiters continued to add to our understanding of the planet, and in particular added credence to the idea that liquid water had once flowed on the surface and formed gullies and channels that resembled those on Earth. Whether the channels were the result of rain or of ice melting caused by asteroid impacts or volcanic activity was up for debate.
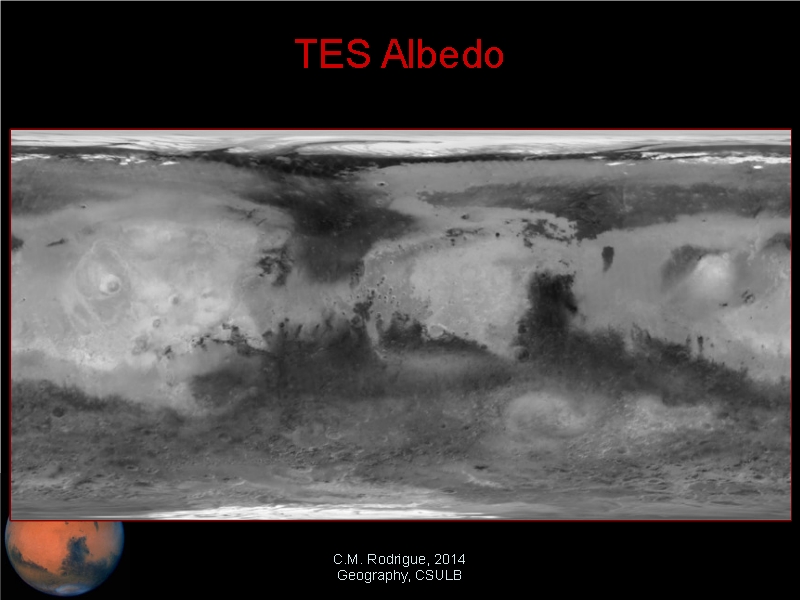
Our knowledge of Mars would take another dramatic leap when the Mars Global Surveyor reached orbit in 1997. This spacecraft carried an incredible suite of instruments that enabled more detailed image mosaics (including this interactive mosaic map that allows you to click on sections to see close-up images), as well as new kinds of maps. A thermal emissions detector produced a map of the planet’s albedo, or the brightness of the light reflected from its surface, which is basically what early astronomers were mapping with their telescopes.

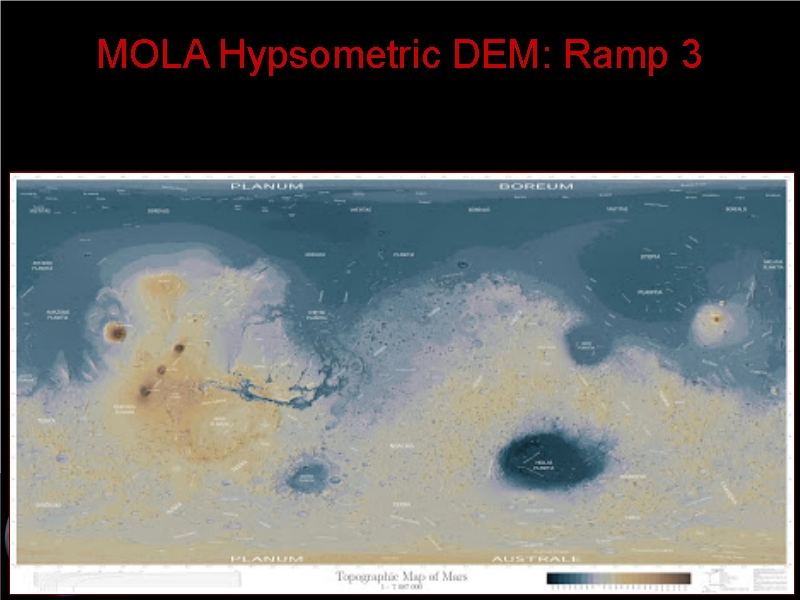
Perhaps the most interesting new view to come from the Mars Global Surveyor was the incredibly detailed elevation map of the planet’s surface, seen above. This high-resolution shaded relief map was made with data from the spacecraft’s laser altimeter, known as MOLA, which sent more than a half billion laser pulses down to the surface and then measured them as they were reflected back. In this image, Hellas Crater appears as a large, dark-blue oval because of its depth.


This relief map has also been reproduced in grayscale and in more user-friendly shades that make understanding what is high and what is low much easier, as well as a color scheme that invokes continents and oceans.

In 2001, National Geographic teamed up with NASA to produce this gorgeous “Destination Mars” reference map of the red planet. The underlying image is based on millions of laser-altimeter measurements from the MOLA instrument and almost a thousand realistic-color wide-angle images from the Mars Global Surveyor’s cameras.
The map uses a projection known as the Winkel tripel, which replaced the Robinson projection as National Geographic’s standard projection for global maps in 1995. The Winkel tripel projection is one of the most accurate ways to flatten a globe to two dimensions. “It was chosen by National Geographic as the primary world projection because it minimizes distortion,” says Ted Sickley, director of cartographic databases at National Geographic.
2001 to 2016: Mars Is Both Older and Younger Than Thought

During the next decade, our understanding of Mars would grow tremendously, thanks to missions that successfully delivered three more orbiters with even more advanced instruments on board. The USGS combined data from these new orbiters along with the Mars Global Surveyor to make the new geologic map of the planet seen above in 2014.
The orbiters are carrying instruments that can detect water vapor in the atmosphere, minerals on the surface, and even the structure of the uppermost part the crust. Scientists learned that a lot of the surface of Mars is older than they previously thought. The area on the map in dark brown, which is between 3.7 billion and 4.1 billion years old, covers three times more ground than on previous maps. But the map also reflects new research that suggests the planet has been geologically active until the present day, with evidence for water erosion, glacial activity, and even so-called Marsquakes.
The new orbiters—Mars Odyssey (2001), Mars Express (2003), and the Mars Reconnaissance Orbiter (2006)—also returned evidence of water on Mars, both frozen beneath the carbon dioxide ice caps and in liquid form at some point in the past. Images and data from the surface added critical evidence for water. The Spirit and Opportunity rovers began their treks in 2003, and the Phoenix lander arrived in 2008. Together, these missions have found gullies carved by flooding, dry river and lake beds, traces of glacial movement, and certain types of rocks and minerals that form in the presence of liquid water.
Though there is no solid evidence that there is or has ever been life on Mars, the presence of liquid water suggests that the planet could have been habitable in the past—not for anything capable of building a giant network of canals, but possibly for microorganisms.

Scientists are still using data from the orbiters to make new kinds of maps of the red planet today, such as the high-resolution gravity map of Mars above, published earlier this year. The research for this map confirmed that Mars has a molten outer core, and scientists were able to estimate how much carbon dioxide freezes out of the atmosphere onto the ice caps in winter.
To make the map, scientists took advantage of the fact that as spacecraft circle the planet, their trajectory is affected by the uneven gravity of Mars. The gravitational pull on an orbiter while it is passing over a mountainous region is very slightly stronger than when it is over plains, and the pull is weaker over a canyon.
There are lots of ways for you to further explore some of the existing maps of Mars, including a website created by Google and Arizona State University that includes data from Mars Global Surveyor’s laser altimeter and cameras, and infrared images from the thermal imager on Mars Odyssey. You can look at Mars in Google Earth, and NASA’s Mars Trek site has lots of different data and layers as well as a few rudimentary mapping and measuring tools. You can check out all the various landing sites, and it will show you exactly where NASA’s three orbiters are at the moment. I also highly recommend browsing the incredible images of the Martian surface from the HiRISE camera on the Mars Reconnaissance Orbiter.
2016 to 2020 and Beyond: More Robots (and Humans?) Will Land on Mars
There will be more maps to come that will undoubtedly reveal more about Mars. NASA has several future missions planned, including Mars InSight, which will send a lander to the planet in 2018 to study the interior of the planet by measuring things like seismic activity and heat flow. A new rover based on NASA’s Curiosity will head to Mars in 2020, and Obama recently set a goal of sending humans to the planet by the 2030s.
Today another mission is arriving at the red planet. The first of several joint Mars missions by the European and Russian space agencies, the ExoMars Trace Gas Orbiter is set to arrive on October 19. The mission will put a spacecraft into orbit that will map the planet’s atmosphere and will send a small lander to the surface to test the Russian descent system and take some measurements that could help scientists understand how Mars’ epic dust storms are started. Fittingly, the lander’s name is Schiaparelli.

You May Also Like


Go Further
Animals
- How scientists are piecing together a sperm whale ‘alphabet’How scientists are piecing together a sperm whale ‘alphabet’
- Orangutan seen using plants to heal wound for first timeOrangutan seen using plants to heal wound for first time
- What La Palma's 'lava tubes' tell us about life on other planetsWhat La Palma's 'lava tubes' tell us about life on other planets
- This fungus turns cicadas into zombies who procreate—then dieThis fungus turns cicadas into zombies who procreate—then die
Environment
- This floating flower is beautiful—but it's wreaking havoc on NigeriaThis floating flower is beautiful—but it's wreaking havoc on Nigeria
- What the Aral Sea might teach us about life after disasterWhat the Aral Sea might teach us about life after disaster
- What La Palma's 'lava tubes' tell us about life on other planetsWhat La Palma's 'lava tubes' tell us about life on other planets
- How fungi form ‘fairy rings’ and inspire superstitionsHow fungi form ‘fairy rings’ and inspire superstitions
- Your favorite foods may not taste the same in the future. Here's why.Your favorite foods may not taste the same in the future. Here's why.
- Are the Great Lakes the key to solving America’s emissions conundrum?Are the Great Lakes the key to solving America’s emissions conundrum?
History & Culture
- These were the real rules of courtship in the ‘Bridgerton’ eraThese were the real rules of courtship in the ‘Bridgerton’ era
- A short history of the Met Gala and its iconic looksA short history of the Met Gala and its iconic looks
- Meet the ruthless king who unified the Kingdom of Hawai'iMeet the ruthless king who unified the Kingdom of Hawai'i
- Hawaii's Lei Day is about so much more than flowersHawaii's Lei Day is about so much more than flowers
Science
- Why ovaries are so crucial to women’s health and longevityWhy ovaries are so crucial to women’s health and longevity
- Orangutan seen using plants to heal wound for first timeOrangutan seen using plants to heal wound for first time
Travel
- Why this unlikely UK destination should be on your radarWhy this unlikely UK destination should be on your radar
