65th IHC Booklet/Program (pdf - 4.9MB) - Office of the Federal ...
65th IHC Booklet/Program (pdf - 4.9MB) - Office of the Federal ...
65th IHC Booklet/Program (pdf - 4.9MB) - Office of the Federal ...

Create successful ePaper yourself
Turn your PDF publications into a flip-book with our unique Google optimized e-Paper software.
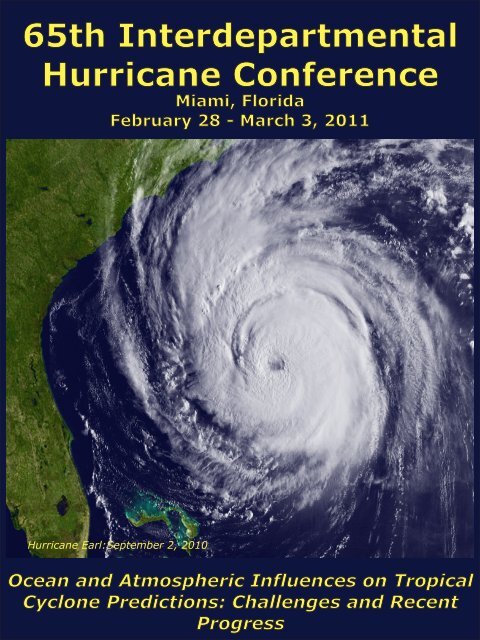
<strong>65th</strong> Interdepartmental<br />
Hurricane Conference<br />
Miami, Florida<br />
February 28 - March 3, 2011<br />
Hurricane Earl:September 2, 2010<br />
Ocean and Atmospheric Influences on Tropical<br />
Cyclone Predictions: Challenges and Recent<br />
Progress
S<br />
E<br />
S<br />
S<br />
Session 2<br />
The 2010 Tropical Cyclone<br />
Season in Review<br />
I<br />
O<br />
N<br />
2
The 2010 Atlantic Hurricane Season:<br />
Extremely Active but no U.S. Hurricane Landfalls<br />
Eric Blake and John L. Beven II<br />
(Eric.S.Blake@noaa.gov)<br />
NOAA/NWS/National Hurricane Center<br />
The 2010 Atlantic hurricane season was quite active, with 19 named storms, 12 <strong>of</strong> which<br />
became hurricanes and 5 <strong>of</strong> which reached major hurricane intensity. These totals are well above<br />
<strong>the</strong> long-term normals <strong>of</strong> about 11 named storms, 6 hurricanes, and 2 major hurricanes.<br />
Although <strong>the</strong> 2010 season was considerably busier than normal, no hurricanes struck <strong>the</strong> United<br />
States. This was <strong>the</strong> most active season on record in <strong>the</strong> Atlantic that did not have a U.S.<br />
landfalling hurricane, and was also <strong>the</strong> second year in a row without a hurricane striking <strong>the</strong> U.S.<br />
coastline. A persistent trough along <strong>the</strong> east coast <strong>of</strong> <strong>the</strong> United States steered many <strong>of</strong> <strong>the</strong><br />
hurricanes out to sea, while ridging over <strong>the</strong> central United States kept any hurricanes over <strong>the</strong><br />
western part <strong>of</strong> <strong>the</strong> Caribbean Sea and Gulf <strong>of</strong> Mexico far<strong>the</strong>r south over Central America and<br />
Mexico.<br />
The most significant U.S. impacts occurred with Tropical Storm Hermine, which brought<br />
hurricane-force wind gusts to south Texas along with extremely heavy rain, six fatalities, and<br />
about $240 million dollars <strong>of</strong> damage. Hurricane Earl was responsible for four deaths along <strong>the</strong><br />
east coast <strong>of</strong> <strong>the</strong> United States due to very large swells, although <strong>the</strong> center <strong>of</strong> <strong>the</strong> hurricane<br />
stayed <strong>of</strong>fshore.<br />
Session 2 – Page 1
Overview <strong>of</strong> <strong>the</strong> 2010 Eastern North Pacific Hurricane Season<br />
John P. Cangialosi and Stacy R. Stewart<br />
(John.P.Cangialosi@noaa.gov and Stacy.R.Stewart@noaa.gov )<br />
NOAA/NWS Tropical Prediction Center/National Hurricane Center<br />
The 2010 eastern North Pacific hurricane season was historically <strong>the</strong> least active on record. Only<br />
seven tropical storms developed, three <strong>of</strong> which became hurricanes. This is <strong>the</strong> lowest number<br />
<strong>of</strong> tropical storms and hurricanes observed since routine satellite reconnaissance <strong>of</strong> <strong>the</strong> basin<br />
began in 1971. Five tropical depressions formed this season that did not streng<strong>the</strong>n into tropical<br />
storms. The Accumulated Cyclone Energy (ACE) index for 2010 was 46% <strong>of</strong> <strong>the</strong> long-term<br />
median. This is <strong>the</strong> third lowest ACE value, ahead <strong>of</strong> only <strong>the</strong> 2007 and 1997 seasons.<br />
Although <strong>the</strong> season was inactive, Tropical Storm Agatha was a high impact event causing 160<br />
deaths and significant damage to portions <strong>of</strong> Central America and Mexico. This, along with<br />
o<strong>the</strong>r season highlights will be presented. In addition, some <strong>of</strong> <strong>the</strong> operational challenges<br />
encountered during <strong>the</strong> season will also be discussed.<br />
Session 2 – Page 2
2010 Atlantic and Eastern North Pacific<br />
Forecast Verification<br />
James L. Franklin<br />
(james.franklin@noaa.gov)<br />
NOAA/NWS/National Hurricane Center<br />
A verification <strong>of</strong> <strong>of</strong>ficial track, intensity, and genesis forecasts from <strong>the</strong> National<br />
Hurricane Center during <strong>the</strong> 2010 season will be presented, along with a discussion <strong>of</strong> <strong>the</strong><br />
performance <strong>of</strong> <strong>the</strong> guidance models.<br />
Session 2 – Page 3
Review <strong>of</strong> <strong>the</strong> 2010 Central Pacific Tropical Cyclone Season and Preliminary Verification<br />
Raymond Tanabe<br />
(raymond.tanabe@noaa.gov)<br />
Deputy Director, Central Pacific Hurricane Center (CPHC)<br />
In 2010, <strong>the</strong>re was one tropical cyclone to have formed in or moved into <strong>the</strong> central Pacific.<br />
Tropical Storm Omeka originated as a subtropical storm west <strong>of</strong> <strong>the</strong> dateline and transitioned<br />
into a tropical cyclone just east <strong>of</strong> <strong>the</strong> dateline on 20 December 2010. CPHC will present an<br />
overview <strong>of</strong> Tropical Storm Omeka, <strong>the</strong> preliminary verification, changes for <strong>the</strong> 2011 season,<br />
and recent staff changes.<br />
Session 2 – Page 4
A Review <strong>of</strong> <strong>the</strong> Joint Typhoon Warning Center<br />
2010 Tropical Cyclone Season<br />
Mr. Robert J. Falvey<br />
(robert.falvey@navy.mil)<br />
Joint Typhoon Warning Center<br />
A review <strong>of</strong> <strong>the</strong> 2010 tropical cyclone activity with discussion <strong>of</strong> significant events for <strong>the</strong> JTWC<br />
Pacific and Indian Ocean forecast areas <strong>of</strong> responsibility will be presented.<br />
Session 2 – Page 5
53d Wea<strong>the</strong>r Reconnaissance Review <strong>of</strong> <strong>the</strong> 2010 Hurricane Season<br />
Capt Douglas Gautrau<br />
(Douglas.Gautrau.1@us.af.mil)<br />
53d Wea<strong>the</strong>r Reconnaissance Squadron<br />
The 2010 hurricane season was a slightly below average year for <strong>the</strong> 53d Wea<strong>the</strong>r<br />
Reconnaissance Squadron with 981.4 total flying hours (compared to 1062 average flying hours<br />
per season over <strong>the</strong> previous 10 years). Although <strong>the</strong> storm season seemed relatively slow due to<br />
<strong>the</strong> lack <strong>of</strong> storms in <strong>the</strong> Gulf <strong>of</strong> Mexico, we stayed very busy flying <strong>the</strong> majority <strong>of</strong> our flights in<br />
<strong>the</strong> Caribbean Sea and Atlantic Ocean. We flew a total <strong>of</strong> 100 tasked missions meeting 97% <strong>of</strong><br />
our requirements.<br />
Overall, <strong>the</strong> Stepped Frequency Microwave Radiometer once again performed<br />
reasonably well on ten WC-130J aircraft, providing critical surface wind speed and rainfall rate<br />
data to <strong>the</strong> customer. Operator experience increased with <strong>the</strong> instrument and valuable inputs and<br />
improvements to instrument performance were accomplished.<br />
Session 2 – Page 6
NOAA Aircraft Operations Center (AOC)<br />
2010 Seasonal Summary and Future Plans<br />
Jim McFadden, Nancy Ash, Jack Parrish, Paul Flaherty, A. Barry Damiano, Ian Sears,<br />
Jessica Williams, Richard Henning<br />
(Jim.d.mcfadden@noaa.gov)<br />
NOAA Aircraft Operations Center<br />
After a relatively slow season in 2009, during which NOAA aircraft flew a total <strong>of</strong> 62 flights and<br />
326 hrs, <strong>the</strong> 2010 season was a bit more active with its three hurricane aircraft, two WP-3Ds and<br />
<strong>the</strong> Gulfstream G-IV, flying 71 flights for 453 hours. These flights, in addition to storm flights,<br />
included trips for public awareness, such as <strong>the</strong> Gulf Coast Hurricane Awareness Tour and <strong>the</strong><br />
Governor’s Hurricane Conference, test and calibration flights as well as several transit flights.<br />
Of significance during <strong>the</strong> 2010 season was <strong>the</strong> joint NASA, NOAA and NSF operation that<br />
utilized a number <strong>of</strong> aircraft from each <strong>of</strong> <strong>the</strong> Agencies in a study <strong>of</strong> tropical storm genesis and<br />
rapid intensification. In addition to NOAA’s three aircraft, NASA provided its DC-8, aWB-57<br />
and Global Hawk. The NSF provided <strong>the</strong> Gulfstream G-V. These aircraft <strong>of</strong>ten flew<br />
coordinated patterns associated with tropical systems in <strong>the</strong> Atlantic and Caribbean. The three<br />
NOAA aircraft also obtained <strong>the</strong> most comprehensive data set on <strong>the</strong> development and decay <strong>of</strong><br />
a tropical system when <strong>the</strong>y flew Hurricane Earl practically from <strong>the</strong> cradle to <strong>the</strong> grave – from<br />
genesis to extra-tropical transition.<br />
AOC continues to upgrade its aircraft and instrumentation, and in 2011 expects to accomplish<br />
<strong>the</strong> following:<br />
• Complete <strong>the</strong> acceptance tests <strong>of</strong> <strong>the</strong> tail Doppler radar on <strong>the</strong> NOAA G-IV<br />
• Continue developing strategies for use <strong>of</strong> <strong>the</strong> new G-IV TDR in storm environment<br />
• Complete <strong>the</strong> avionics upgrade on N44RF, NOAA’s 3 rd P-3<br />
• Complete integration <strong>of</strong> new aircraft data system (AAMPS) on <strong>the</strong> NOAA P-3s<br />
• Complete installation <strong>of</strong> new AXBT receivers on both P-3s<br />
Session 2 – Page 7
S<br />
E<br />
S<br />
Session 3<br />
Observations and<br />
Observing Strategies for<br />
Tropical Cyclones and<br />
<strong>the</strong>ir Environment, Part 1<br />
S<br />
I<br />
O<br />
N<br />
3
Microwave sounder observations during GRIP: Preliminary results<br />
Bjorn Lambrigtsen, Shannon Brown<br />
(lambrigtsen@jpl.nasa.gov)<br />
Jet Propulsion Laboratory, California Institute <strong>of</strong> Technology<br />
The High Altitude MMIC Sounding Radiometer (HAMSR), a microwave sounder similar to but<br />
more advanced than <strong>the</strong> AMSU sounders now operating on multiple satellites, was deployed on<br />
<strong>the</strong> Global Hawk unmanned aircraft during <strong>the</strong> Genesis and Rapid Intensification Processes<br />
(GRIP) hurricane field campaign during August and September 2010. HAMSR was developed at<br />
<strong>the</strong> Jet Propulsion Laboratory more than ten years ago and has been flown in several hurricane<br />
field campaigns. It was recently upgraded with <strong>the</strong> latest technology and is now <strong>the</strong> most<br />
sensitive and accurate sensor <strong>of</strong> its kind. Using observations from previous field campaigns, a<br />
new algorithm has been developed that makes it possible to emulate a radar and derive<br />
reflectivity pr<strong>of</strong>iles from <strong>the</strong> observed brightness temperatures. We present preliminary results<br />
from GRIP, including close-up views <strong>of</strong> <strong>the</strong> convective structure <strong>of</strong> Hurricane Karl as it<br />
intensified to category 3. The Global Hawk flew over Karl for 13 hours and passed over <strong>the</strong> eye<br />
20 times during this period, and with HAMSR it is possible to analyze <strong>the</strong> three-dimensional<br />
convective structure <strong>of</strong> <strong>the</strong> inner core as it evolves. And since HAMSR is a sounder, it is also<br />
possible to analyze <strong>the</strong> <strong>the</strong>rmodynamic structure in areas surrounding <strong>the</strong> core. GRIP was<br />
operated in coordination with NOAA and <strong>the</strong> NSF, and observations were collected from<br />
numerous sensors on multiple aircraft platforms. The analysis <strong>of</strong> this rich data set is just<br />
beginning.<br />
Copyright 2011 California Institute <strong>of</strong> Technology. Government sponsorship acknowledged.<br />
Session 3 – Page 1
NPP Microwave-sounder Based Tropical Cyclone Products<br />
Andrea Schumacher 1 , Mark DeMaria 2 , John A. Knaff 2 , Limin Zhao 3 , Tom Schott 4<br />
(schumacher@cira.colostate.edu)<br />
1 Cooperative Institute for Research in <strong>the</strong> Atmosphere, Fort Collins, CO;<br />
2 NOAA/NESDIS/STAR, Fort Collins, CO; 3 NOAA/NESDIS/OSPO/SPSD, Camp Springs, MD;<br />
4 NOAA/NESDIS/OSD, Suitland, MD<br />
NESDIS provides several Advanced Microwave Sounding Unit (AMSU)-based operational<br />
tropical cyclone (TC) intensity and structure guidance products. Using temperature retrievals<br />
corrected for scattering and attenuation a number <strong>of</strong> tropical cyclone products are generated.<br />
These products include storm-centered radius vs. pressure pr<strong>of</strong>iles <strong>of</strong> temperature and gradient<br />
winds, objective estimates <strong>of</strong> 1-min maximum sustained surface winds, minimum sea level<br />
pressure, <strong>the</strong> radii <strong>of</strong> 34-, 50-, and 64-kt winds in <strong>the</strong> nor<strong>the</strong>ast, sou<strong>the</strong>ast, southwest, and<br />
northwest quadrants, and balanced horizontal winds on standard pressure levels from 1000 hPa<br />
to 100 hPa within 600 km <strong>of</strong> tropical cyclones. Product algorithms use statistical methods to<br />
remove temperature biases due to scattering and attenuation, and by using NCEP boundary<br />
conditions and hydrostatic balance heights fields can be estimated. Statistical analysis is <strong>the</strong>n<br />
used to estimate intensity and wind radii from storm-centered azimuthally averaged fields and<br />
gradient wind estimates. The 2-dimensional winds are estimated on standard pressure levels by<br />
solving <strong>the</strong> non-linear balance equations.<br />
With <strong>the</strong> launch <strong>of</strong> <strong>the</strong> National Polar-Orbiting Operational Environmental Satellite System<br />
(NPOESS) Preparatory Project (NPP) satellite, data from a new microwave sensor, <strong>the</strong> Advanced<br />
Technology Microwave Sounder (ATMS) which has ~35% smaller footprint than AMSU, will<br />
be available. This presentation will discuss <strong>the</strong> procedure and timeline for updating <strong>the</strong> AMSUbased<br />
TC intensity and structure products to use ATMS data and <strong>the</strong> potential product quality<br />
improvements that may result from <strong>the</strong> updates.<br />
DISCLAIMER: The views, opinions, and findings in this report are those <strong>of</strong> <strong>the</strong> authors and<br />
should not be construed as an <strong>of</strong>ficial NOAA and/or U.S. Government position, policy, or<br />
decision<br />
Session 4 – Page 2
The 2010 GOES-R Proving Ground at <strong>the</strong> National Hurricane Center<br />
Jack Beven 1 , Michael Brennan 1 , Mark DeMaria 2 , John Knaff 2 , Christopher Velden 3 and Jason<br />
Dunion 4<br />
(John.L.Beven@noaa.gov)<br />
1 NOAA/NWS/NCEP National Hurricane Center, Miami, FL; 2 NOAA/NESDIS/STAR, Fort<br />
Collins, CO; 3 CIMSS/UW, Madison, WI; 4 University <strong>of</strong> Miami/CIMAS-NOAA/AOML/HRD,<br />
Miami, FL<br />
GOES-R is scheduled for launch in late 2015 and will contain a number <strong>of</strong> new instruments,<br />
including <strong>the</strong> 16-channel Advanced Baseline Imager (ABI) and <strong>the</strong> Geostationary Lightning<br />
Mapper (GLM). The GOES-R Proving Ground was established to provide forecasters with<br />
advance looks at GOES-R data and products using proxy information, and to obtain user<br />
feedback for <strong>the</strong> product developers. Six products were chosen for demonstration at NHC during<br />
most <strong>of</strong> <strong>the</strong> 2010 Hurricane Season (1 Aug to 30 Nov). Five <strong>of</strong> <strong>the</strong> six were ABI products, which<br />
included <strong>the</strong> Hurricane Intensity Estimate (HIE), two Red-Green-Blue (RBG) products designed<br />
to provide forecasters experience with image combinations, split window (10.8 and 12.0 µm)<br />
infrared imagery for tracking low to mid-level dry air, and super-rapid scan operations imagery.<br />
The sixth was a combined GLM and ABI product to predict rapid intensification using global<br />
model fields, infrared imagery and lightning input. SEVIRI data from Meteosat and <strong>the</strong> imager<br />
from <strong>the</strong> current GOES were used as proxies for <strong>the</strong> ABI and <strong>the</strong> ground-based Global Lightning<br />
Dataset 360 (GLD-360) was used as a proxy for <strong>the</strong> GLM. Results from 2010 will be<br />
summarized along with plans for a follow-on experiment during <strong>the</strong> 2011 Hurricane Season.<br />
DISCLAIMER: The views, opinions, and findings in this report are those <strong>of</strong> <strong>the</strong> authors and<br />
should not be construed as an <strong>of</strong>ficial NOAA and/or U.S. Government position, policy, or<br />
decision.<br />
Session 3 – Page 3
Development and validation <strong>of</strong> a capability for wide-swath storm observations <strong>of</strong> ocean<br />
surface wind speed<br />
Timothy L. Miller 1 M. W. James 1 , W. L. Jones 2 , C. S. Ruf 3 , E. W. Uhlhorn 4 , C. D. Buckley 5 , S.<br />
Biswas 2 , G. Shah 2 , and R. E. Hood 6<br />
(tim.miller@nasa.gov)<br />
1 NASA Marshall Space Flight Center, Huntsville, AL; 2 University <strong>of</strong> Central Florida;<br />
3 University <strong>of</strong> Michigan; 4 NOAA/AOML/HRD; 5 Universities Space Research Association;<br />
6 NOAA/UAS <strong>Program</strong><br />
HIRAD (Hurricane Imaging Radiometer) flew on <strong>the</strong> WB-57 during NASA’s GRIP (Genesis<br />
and Rapid Intensification Processes) campaign in September <strong>of</strong> 2010. HIRAD is a new C-band<br />
radiometer using a syn<strong>the</strong>tic thinned array radiometer (STAR) technology to obtain cross-track<br />
resolution <strong>of</strong> approximately 3 degrees, out to approximately 60 degrees to each side <strong>of</strong> nadir. By<br />
obtaining measurements <strong>of</strong> emissions at 4, 5, 6, and 6.6 GHz, observations <strong>of</strong> ocean surface wind<br />
speed and rain rate can be inferred. This technique has been used for many years by precursor<br />
instruments, including <strong>the</strong> Stepped Frequency Microwave Radiometer (SFMR), which has been<br />
flying on <strong>the</strong> NOAA and USAF hurricane reconnaissance aircraft for several years. The<br />
advantage <strong>of</strong> HIRAD over SFMR is that HIRAD can observe a +/- 60-degree swath, ra<strong>the</strong>r than<br />
a single footprint at nadir angle.<br />
Results from <strong>the</strong> flights during <strong>the</strong> GRIP campaign will be shown, including comparison with<br />
SFMR <strong>of</strong> preliminary images <strong>of</strong> brightness temperatures, and possibly wind speed and rain rate.<br />
If available, comparisons will be made with observations from o<strong>the</strong>r instruments on <strong>the</strong> GRIP<br />
campaign, for which HIRAD observations are ei<strong>the</strong>r directly comparable or are complementary.<br />
Potential impacts on operational ocean surface wind analyses and on numerical wea<strong>the</strong>r forecasts<br />
will also be discussed.<br />
Session 4 – Page 4
Developments in 2010 in in-flight real-time reporting <strong>of</strong> <strong>the</strong> directional ocean wave spectra<br />
using Wide Swath Radar Altimeter (WSRA) from <strong>the</strong> NOAA WP-3D Hurricane<br />
Reconnaissance Aircraft<br />
Ivan PopStefanija 1 , Edward J. Walsh 2<br />
(popstefanija@prosensing.com)<br />
1 ProSensing, Amherst, MA; 2 NOAA/ESRL/PSD, Boulder, CO<br />
This JHT project focuses on developing <strong>the</strong> processing algorithms and real-time s<strong>of</strong>tware needed<br />
to perform in-flight data processing for <strong>the</strong> newly-developed Wide Swath Radar Altimeter<br />
(WSRA). The WSRA is a novel digital beamforming radar altimeter developed with funding<br />
from <strong>the</strong> NOAA SBIR program, with additional support from <strong>the</strong> University <strong>of</strong> Massachusetts<br />
and DARPA.<br />
In March <strong>of</strong> 2010, we had a partially-successful test flight. It was only a partial success because<br />
<strong>the</strong> WSRA's power amplifier worked only intermittently during <strong>the</strong> flight. The WSRA hardware<br />
was fixed by June 2010. Throughout <strong>the</strong> summer <strong>of</strong> 2010, ProSensing engineers worked on <strong>the</strong><br />
implementation <strong>of</strong> <strong>the</strong> real-time processing code for <strong>the</strong> unattended operation <strong>of</strong> <strong>the</strong> WSRA<br />
system. This effort included optimization <strong>of</strong> <strong>the</strong> WSRA digital beamforming and range centroid<br />
tracking algorithms, conversion <strong>of</strong> <strong>the</strong> processing algorithms into a multi-threaded C application,<br />
and deployment <strong>of</strong> a multi-core PC processor to execute in-flight processing. In <strong>the</strong> new code we<br />
also implemented several WSRA algorithm improvements: (1) antenna beam pointing angle<br />
adjustment factor calculated based on <strong>the</strong> estimation <strong>of</strong> <strong>the</strong> antenna array width distortion caused<br />
by <strong>the</strong> lateral movement <strong>of</strong> <strong>the</strong> aircraft during <strong>the</strong> data integration time (2) incremental (looped)<br />
estimation <strong>of</strong> <strong>the</strong> range-to-surface in each beam weighed by <strong>the</strong> range estimates in <strong>the</strong><br />
neighbouring beams, (3) automatic adjustment <strong>of</strong> <strong>the</strong> WSRA radar parameters as <strong>the</strong> auxiliaryreported<br />
aircraft’s altitude changes, (4) streamlining and automating <strong>the</strong> backend processing<br />
which estimates <strong>the</strong> ocean wave directional spectra from <strong>the</strong> surface elevations, and (5)<br />
developing <strong>the</strong> script that would format <strong>the</strong> data products and transmit in-flight <strong>the</strong> WSRA<br />
output data file from <strong>the</strong> aircraft to <strong>the</strong> archiving and displaying computers at AOC in Tampa and<br />
NHC in Miami. Upon completion <strong>of</strong> <strong>the</strong> s<strong>of</strong>tware development, <strong>the</strong> WSRA was shipped to AOC<br />
for <strong>the</strong> installation on WP-3D.<br />
The WSRA was installed on <strong>the</strong> WP-3D aircraft mid-September, <strong>the</strong>reby missing <strong>the</strong> opportunity<br />
to fly on several reconnaissance flights in hurricane Earl. For <strong>the</strong> rest <strong>of</strong> <strong>the</strong> season <strong>the</strong> WSRA<br />
operated during one flight into a tropical disturbance south <strong>of</strong> Haiti and one reconnaissance flight<br />
into CAT-1 hurricane Karl. The second half <strong>of</strong> <strong>the</strong> hurricane season did not provide any<br />
additional opportunities to operate WSRA. All parts <strong>of</strong> <strong>the</strong> WSRA s<strong>of</strong>tware were successfully<br />
tested, including <strong>the</strong> transmitting <strong>of</strong> <strong>the</strong> data to AOC. S<strong>of</strong>tware and hardware performance during<br />
flights have shown <strong>the</strong> feasibility <strong>of</strong> a fully-automated unattended operational WSRA. The two<br />
flights we’ve conducted illuminated some problems in <strong>the</strong> WSRA code which have been since<br />
corrected and tested. Currently, <strong>the</strong> WSRA is at AOC ready for operation during <strong>the</strong> 2011<br />
hurricane season.<br />
Session 3 – Page 5
NOAA Pro<strong>of</strong> <strong>of</strong> Concept Demonstrations <strong>of</strong> Hurricane Observing Strategies using<br />
Unmanned Aircraft Systems<br />
Robbie Hood 1 , Robert Atlas 2 , Frank Marks 2 , Steve Koch 4 , Robert Rogers 2 , Joseph Cione 2 ,<br />
Michael Black 2 , Eric Uhlhorn 2 , Christopher Landsea 3 , Gary Wick, Yuanfu Xie 4 , Phil Hall 5 ,<br />
Nancy Ash 5 , and Phil Eastman 5<br />
(robbie.hood@noaa.gov)<br />
1 NOAA/OAR/UASP; 2 NOAA/ Atlantic Oceanographic and Meteorological Laboratory;<br />
3 NOAA / National Hurricane Center; 4 NOAA / Earth System Research Laboratory; 5 NOAA/<br />
<strong>Office</strong> <strong>of</strong> Marine and Aviation Operations<br />
The NOAA Unmanned Aircraft Systems (UAS) <strong>Program</strong> is evaluating <strong>the</strong> feasibility <strong>of</strong> UAS<br />
technologies to address <strong>the</strong> NOAA mission using a requirements-based systems approach. UAS<br />
have <strong>the</strong> potential to fill critical observation gaps in understanding and predicting high impact<br />
wea<strong>the</strong>r events impacting coastal communities. The NOAA UAS <strong>Program</strong> has been identifying<br />
and conducting conceptual studies <strong>of</strong> UAS platforms and payloads which could be beneficial for<br />
long endurance sampling <strong>of</strong> tropical cyclone boundary layers and remote sensing <strong>of</strong> storm<br />
structures. The NOAA UAS <strong>Program</strong> is also investing in Observing System Simulation<br />
Experiments (OSSE) to analyze whe<strong>the</strong>r positive impact to future tropical cyclone observing<br />
strategies could be achieved with UAS observations. This presentation will include an overview<br />
<strong>of</strong> <strong>the</strong> NOAA UAS <strong>Program</strong> High Impact Wea<strong>the</strong>r Roadmap for testing and evaluating UAS<br />
technologies. Recent accomplishments and key partnerships with NASA, NSF, and academic<br />
community will also be discussed.<br />
Session 4 – Page 6
Surface-Reflected GPS Wind Speed Sensing Results for 2010 Atlantic Season<br />
Michael S. Grant 1 , Stephen J. Katzberg 2 , Jason P. Dunion 3<br />
(michael.s.grant@nasa.gov)<br />
1 NASA/Langley Research Center, 2 NASA/Distinguished Research Associate, 3 University <strong>of</strong><br />
Miami/RSMAS/CIMAS-NOAA/AOML/HRD<br />
During <strong>the</strong> 2010 Atlantic storm season, NASA-Langley GPS receiver/reflectometers deployed<br />
on NOAA P-3 Hurricane Hunter aircraft were used to retrieve ocean surface wind speed for a<br />
number <strong>of</strong> storms including Hurricane Earl, Tropical Storm Alex, and for a rapid intensification<br />
flight into Hurricane Karl. The sensing technique uses surface-reflected GPS navigation signals<br />
in a manner analogous to bistatic radar, where Global Positioning System (GPS) satellites serve<br />
as surface illumination sources. A modified GPS receiver measures surface-reflected signal<br />
strength at increasing path delays, relative to <strong>the</strong> geometric mirror reflection point. Surface wind<br />
speed is inferred by monitoring ocean surface roughness (mean square slope) via <strong>the</strong> measured<br />
scattering <strong>of</strong> <strong>the</strong> reflected signal.<br />
Results from earlier storm seasons verified <strong>the</strong> reflected signal sensitivity over a range <strong>of</strong> wind<br />
speeds: from nearly 0 (calm seas) to greater than 40 meters per second (m/s) [1]. Ano<strong>the</strong>r study<br />
reported that, for 0 – 15 m/s wind conditions and well-developed seas, GPS wind speed retrievals<br />
were in agreement with TOPEX satellite altimeter-derived measurements to better than 1 m/s,<br />
with a precision ~2 m/s (1-sigma) [2]. Surface wind speeds obtained using an empirical<br />
calibration function also compared well to GPS dropsonde data, particularly for winds in <strong>the</strong> 0 –<br />
20 m/s range [3]. In this paper, GPS reflection measurement results from <strong>the</strong> 2010 storm season<br />
will be presented and compared to co-located measurements from <strong>the</strong> operational Stepped-<br />
Frequency Microwave Radiometer, surface-adjusted flight level winds, and GPS dropsondes.<br />
The GPS reflection measurements were achieved using light-weight (< 5 kg), low power,<br />
autonomously operated GPS receivers and nadir-viewing 3.5” hemispherical antennas – a system<br />
which requires only minimal aircraft accommodation. GPS wind speed instruments deployed on<br />
longer-duration aircraft missions could be useful for mapping <strong>the</strong> changing surface wind field<br />
and changes in momentum flux related to <strong>the</strong> ultimate intensity and classification <strong>of</strong> developing<br />
storm systems.<br />
The sensitivity <strong>of</strong> <strong>the</strong> GPS instrument to low-speed surface wind conditions (< 10 - 15 m/s),<br />
where microwave radiometers can be less effective, implies that GPS surface-reflection<br />
instruments can provide independent wind speed retrievals to compliment those obtained with<br />
radiometers or o<strong>the</strong>r instruments currently utilized in tropical cyclone genesis and forecasting<br />
studies. Combining wind speeds based upon GPS surface reflections (due to larger surface<br />
slopes) with those derived from radiometric brightness temperature (involving finer surface<br />
features) can potentially provide a more complete understanding <strong>of</strong> tropical cyclone formation,<br />
and improve forecasts <strong>of</strong> storm intensity.<br />
[1] Katzberg, S. J., O. Torres, and G. Ganoe (2006), ‘Calibration <strong>of</strong> reflected GPS for tropical<br />
storm wind speed retrievals,’ Geophys. Res. Lett., 33, L18602, doi:10.1029/2006GL026825<br />
[2] Garrison, J. L., et. al., (2002) ‘Wind speed measurements using forward scattered GPS<br />
signals,’ IEEE Trans. Geoscience and Remote Sensing, vol. 40, no. 1.<br />
[3] Katzberg, S. J., and J. Dunion (2009) ‘Comparison <strong>of</strong> refl. GPS wind speed retrievals with<br />
dropsondes in tropical cyclones,’ Geophys. Res. Lett., 36, L17602, doi: 10.1029/2009GL039512.<br />
Session 3 – Page 7
S<br />
E<br />
S<br />
Session 4<br />
Observations and<br />
Observing Strategies for<br />
Tropical Cyclones and<br />
<strong>the</strong>ir Environment, Part 2<br />
S<br />
I<br />
O<br />
N<br />
4
Real-Time Airborne Ocean Measurements and Predictions <strong>of</strong> Loop Current Eddy<br />
Shedding During <strong>the</strong> Deepwater Horizon Oil Spill: Implications for Hurricane Intensity<br />
Forecasting<br />
Lynn K. Shay 1 , Benjamin Jaimes 1 , Jodi K. Brewster 1 , Patrick Meyers 1 , Claire McCaskill 1 ,<br />
Steven Paul 2 , Eric W. Uhlhorn 3 , Frank D. Marks 3 , George R. Halliwell Jr. 4<br />
(nshay@rsmas.miami.edu)<br />
1 Division <strong>of</strong> Meteorology and Physical Oceanography, RSMAS, University <strong>of</strong> Miami; 2 <strong>Office</strong> <strong>of</strong><br />
Aircraft Operations, NOAA, MacDill AFB 3 Hurricane Research Division, NOAA, AOML<br />
4 Physical Oceanography Division, NOAA, AOML<br />
Several flights from NOAA WP-3D aircraft were conducted between 5 May and 9 July 2010 that<br />
focused on temperature, currents and salinity in a geographical location to <strong>the</strong> sou<strong>the</strong>ast <strong>of</strong> <strong>the</strong><br />
Deepwater Horizon (DWH) rig, and over <strong>the</strong> Loop Current (LC) and associated eddies. These<br />
flights provided <strong>the</strong> evolving oceanic variability <strong>of</strong> <strong>the</strong> LC, <strong>the</strong> shedding <strong>of</strong> warm core eddy<br />
Franklin, and frontal eddies along its' periphery. Atmospheric dropsondes (for surface winds)<br />
and airborne expendable ocean pr<strong>of</strong>ilers sampling to as deep as 1500 m (from expendable current<br />
pr<strong>of</strong>ilers: AXCP) were deployed in a lawnmower pattern with essentially <strong>the</strong> drop points. Over<br />
700 airborne ocean pr<strong>of</strong>ilers were deployed that included AXBT, AXCP, and conductivitytemperature-depth<br />
pr<strong>of</strong>ilers (AXCTD). These data, acquired over a weekly basis over <strong>the</strong> LC,<br />
were assimilated into operational ocean models (HYCOM) at NAVOCEANO to predict potential<br />
pathways <strong>of</strong> <strong>the</strong> oil from <strong>the</strong> nor<strong>the</strong>rn Gulf <strong>of</strong> Mexico. In addition, <strong>the</strong>se measurements provided<br />
data to vector ships to regions <strong>of</strong> mesoscale variability for detailed oil spill measurements, and<br />
are being used to evaluate satellite-based products such as oceanic heat content from altimetry<br />
and SMARTS climatology.<br />
Surface currents derived from altimeter sea surface heights and direct current measurements<br />
from AXCPs indicate that, from May to June, <strong>the</strong> circulation patterns between <strong>the</strong> DWH rig and<br />
<strong>the</strong> nor<strong>the</strong>rn boundary <strong>of</strong> <strong>the</strong> LC were dominated by nearly small-scale cyclones. Eddy Franklin<br />
detached from <strong>the</strong> LC between 28 May and 18 June, where <strong>the</strong> 20 o C iso<strong>the</strong>rm depth (h20)<br />
reached maximum values <strong>of</strong> about 320 m at Franklin’s core, compared with values ranging from<br />
280 to 300 m before <strong>the</strong> shedding event. During early July, Franklin experienced significant<br />
erosion from several frontal eddies, where h20 values in Franklin’s core ranged from 260 to 280<br />
m. Subsequently, Franklin began to move westward as expected with large warm core eddies.<br />
Thus, <strong>the</strong> approach captured <strong>the</strong> complexities <strong>of</strong> <strong>the</strong> mesoscale LC-eddy shedding processes for<br />
<strong>the</strong> first time over weekly time scales. The <strong>the</strong>rmal structure data from all pr<strong>of</strong>ilers were<br />
assimilated into <strong>the</strong> operational HYCOM whereas <strong>the</strong> salinity and current data are being used to<br />
evaluate model performance. Analyses <strong>of</strong> twin numerical experiments with and without data<br />
assimilation clearly revealed <strong>the</strong> unprecedented importance <strong>of</strong> <strong>the</strong> real-time, 3-D measurements<br />
in improving <strong>the</strong> trajectories to guide cleanup efforts. This approach needs to be applied to<br />
oceanic and coupled model efforts and implemented for real-time ocean forecasting at <strong>the</strong><br />
National Centers for eventual use in coupled model forecasts.<br />
Session 4 – Page 1
First Flights <strong>of</strong> HIWRAP During GRIP<br />
Gerald Heymsfield 1 , L. Li 1 , J. Carswell 2 , M. Mclinden 1 , M. Perrine 1 , L. Tian 3 , A. Reynolds 1 , S.<br />
Guimond 4<br />
(gerald.heymsfield@nasa.gov)<br />
1 NASA Goddard Space Flight Center; 2 Remote Sensing Solutions; 3 UMBC GEST; 4 NASA<br />
ORAU<br />
Wind measurements are crucial for understanding and forecasting tropical storms since<br />
<strong>the</strong>y are closely tied to <strong>the</strong> overall dynamics <strong>of</strong> <strong>the</strong> storm. The High-Altitude Imaging Wind and<br />
Rain Airborne Pr<strong>of</strong>iler (HIWRAP) is a dual-frequency (Ka- and Ku-band), dual-beam (30 0 and<br />
40 0 incidence angle), conical scan, solid-state transmitter-based system, designed for operation<br />
on <strong>the</strong> high-altitude (20 km) Global Hawk UAV. HIWRAP images <strong>the</strong> winds through volume<br />
backscattering from clouds and precipitation, enabling it to measure <strong>the</strong> tropospheric winds<br />
above heavy rain at high levels. It will also measure ocean surface winds through scatterometry,<br />
similar to QuikScat. These measurements from higher altitudes above storms, are useful for<br />
providing higher spatial and temporal resolution than obtained by current satellites and loweraltitude<br />
instrumented aircraft.<br />
HIWRAP flew its first test flights during March 2010 on <strong>the</strong> NASA WB-57 manned<br />
aircraft (60-65kft ceiling) and <strong>the</strong>n <strong>the</strong> first science flights on <strong>the</strong> unmanned Global Hawk (65kft<br />
ceiling) during <strong>the</strong> Genesis and Rapid Intensification Processes (GRIP) campaign conducted<br />
during August and September 2010. The Global Hawk flew for <strong>the</strong> first time over hurricanes<br />
during GRIP. The were 5 science flights over storms (Hurricanes Karl, Earl, and Mat<strong>the</strong>w)<br />
during which <strong>the</strong>re were as many as 20 passes over <strong>the</strong> storm center during a single flight.<br />
HIWRAP data analysis from <strong>the</strong>se flights is in very early stages <strong>of</strong> processing and s<strong>of</strong>tware<br />
development. We will present a summary <strong>of</strong> <strong>the</strong> instrument status, data analysis, lessons learned,<br />
and future plans.<br />
Session 4 – Page 2
WISDOM Intensity <strong>Program</strong> – Wea<strong>the</strong>r Hurricane In-situ Sea Surface Probe (WHISSP)<br />
Justyna Nicinska, Russell B. Chadwick, Randy Johnson,<br />
(justyna.nicinska@noaa.gov)<br />
<strong>Office</strong> <strong>of</strong> Oceanic and Atmospheric Research (OAR)/NOAA<br />
The WISDOM Intensity program is a new research effort based in <strong>the</strong> <strong>Office</strong> <strong>of</strong> Oceanic and<br />
Atmospheric Research (OAR) with <strong>the</strong> aim <strong>of</strong> developing observing platforms capable <strong>of</strong><br />
delivering continuous data within <strong>the</strong> eye <strong>of</strong> a tropical cyclone. At present data collection in <strong>the</strong><br />
eye <strong>of</strong> a hurricane is limited. The WISDOM effort was inspired by <strong>the</strong> successful Aeroclipper<br />
design led by CNES in which two models were entrained into a tropical cyclone in <strong>the</strong> Indian<br />
Ocean and collected data for over a week. OAR/WISDOM aims to develop a low cost platform<br />
capable <strong>of</strong> collecting continuous observations for days in <strong>the</strong> eye <strong>of</strong> a hurricane including central<br />
pressure, wind speed, wind direction and air temperature. One <strong>of</strong> several possible approaches<br />
towards developing a simple and low-cost version <strong>of</strong> a platform for collecting data in <strong>the</strong> eye <strong>of</strong> a<br />
storm is <strong>the</strong> Wea<strong>the</strong>r/Hurricane In-situ Sea Surface Probe (WHISSP). This presentation will<br />
describe <strong>the</strong> simple wind model developed to assess a surface craft’s ability to become entrained<br />
in a tropical cyclone as well as results from an initial pro<strong>of</strong> <strong>of</strong> concept study conducted by<br />
OAR/WISDOM, where four experimental WHISSP models were tested in <strong>the</strong> field. Results <strong>of</strong><br />
this study as well as future development plans will be discussed.<br />
Session 4 – Page 3
New Tools for Tropical Cyclone Radar Rainfall Estimation<br />
Dan Berkowitz<br />
(Daniel.S.Berkowitz@noaa.gov)<br />
Radar Operations Center, Norman, OK<br />
During <strong>the</strong> early years <strong>of</strong> <strong>the</strong> WSR-88D program, an empirical relationship, known as <strong>the</strong> default<br />
Z/R relationship, was used to convert radar reflectivity to a rainfall rate. However, it was known<br />
to underestimate rainfall in tropical-like systems. In June 1997, a tropical Z/R relationship was<br />
authorized by <strong>the</strong> Radar Operations Center (ROC) which yielded higher rainfall rates than <strong>the</strong><br />
default relationship for tropical systems. However, <strong>the</strong> performance <strong>of</strong> <strong>the</strong> tropical Z/R<br />
relationship remained inconsistent. Part <strong>of</strong> <strong>the</strong> problem was that one Z/R relationship was applied<br />
to <strong>the</strong> entire 230 kilometer range within which rainfall estimates were computed even though<br />
different types <strong>of</strong> rain regimes are possible within a tropical cyclone (TC). Additionally, once <strong>the</strong><br />
tropical Z/R relationship was selected, it was used until an operator changed it. These challenges<br />
highlighted <strong>the</strong> need for an improved method for estimating rainfall amounts. This presentation<br />
will provide an overview <strong>of</strong> <strong>the</strong> traditional (reflectivity-based) method, plus two new rainfall<br />
estimation tools worth considering for <strong>the</strong> upcoming tropical cyclone season - <strong>the</strong> vertical pr<strong>of</strong>ile<br />
<strong>of</strong> reflectivity (VPR)-based method developed by <strong>the</strong> National Severe Storms Laboratory and <strong>the</strong><br />
new Dual Polarization (DP) Quantitative Precipitation Estimation (QPE) method.<br />
Session 4 – Page 4
A Two-Dimensional Velocity Dealiasing Algorithm for <strong>the</strong> WSR-88D<br />
W. David Zittel 1 , Zhongqi Jing 1 , Nicholas Langlieb 2<br />
(Walter.D.Zittel@noaa.gov)<br />
1 Radar Operations Center, Norman, OK; 2 National Wea<strong>the</strong>r Service Forecast <strong>Office</strong>, Great Falls<br />
MT<br />
The current Wea<strong>the</strong>r Surveillance Radar-1988 Doppler (WSR-88D) utilizes two velocity dealiasing<br />
schemes, <strong>the</strong> Velocity Dealiasing Algorithm (VDA) and <strong>the</strong> Multiple Pulse Repetition Frequency<br />
(PRF) Velocity Dealiasing Algorithm (MPDA). The VDA remains virtually unchanged since <strong>the</strong><br />
deployment <strong>of</strong> <strong>the</strong> legacy WSR-88Ds. The VDA primarily uses radial continuity, an average <strong>of</strong><br />
nearby velocity neighbors, or an Environmental Wind Table (EWT) to help resolve winds exceeding<br />
<strong>the</strong> maximum unambiguous velocity (Nyquist Velocity, V N ) which for <strong>the</strong> WSR-88D is between 21<br />
and 35 m s -1 for <strong>the</strong> following precipitation Volume Coverage Patterns (VCPs): VCPs 11, 12, 21, 211,<br />
212, & 221 and <strong>the</strong> clear air VCP 32. The long-pulse clear air VCP 31 has a Nyquist velocity <strong>of</strong> about<br />
8 m s -1 . While generally reliable, <strong>the</strong> VDA can fail: 1) under strong shear conditions; 2) in velocity<br />
data with moving clutter; 3) in areas with weak echoes; 4) when <strong>the</strong> Nyquist velocity is much lower<br />
than <strong>the</strong> prevailing winds; or 5) where <strong>the</strong> values in <strong>the</strong> EWT are not representative <strong>of</strong> <strong>the</strong> local storm<br />
winds. The MPDA, fielded in 2004 as VCP 121, takes multiple scans <strong>of</strong> velocity data at <strong>the</strong> same<br />
elevation using up to three different PRFs. It can dealias velocity with a high degree <strong>of</strong> reliability<br />
where <strong>the</strong>re is more than one velocity estimate available. However, <strong>the</strong> utility <strong>of</strong> <strong>the</strong> MPDA in VCP<br />
121 is limited during rapidly changing wea<strong>the</strong>r events because <strong>the</strong> additional scans required increases<br />
<strong>the</strong> volume scan time to nearly 6 minutes. VCP 121’s utility is fur<strong>the</strong>r diminished because it has only<br />
9 unique elevation angles with which to interrogate storm structure.<br />
The Radar Operations Center (ROC) tested a two-dimensional velocity dealiasing scheme (VDEAL)<br />
that is more robust than <strong>the</strong> current VDA. It works by simultaneously dealiasing all gates in an<br />
elevation scan using a least-squares approach to minimize <strong>the</strong> discontinuity caused by aliasing.<br />
Greater weight is given to velocity differences near zero or at multiples <strong>of</strong> 2V N as well as velocity<br />
differences where <strong>the</strong> corresponding spectrum width values are low. VDEAL can be used by all VCPs<br />
except VCP 121 with no perceptible delay in product availability.<br />
This paper presents <strong>the</strong> test results <strong>of</strong> VDEAL on historical WSR-88D data sets collected during<br />
hurricanes, tornadic storms, and storms with outflow boundaries. For this test, velocity products were<br />
scored qualitatively. Of 520 low-level velocity products evaluated, <strong>the</strong> VDA had 252 with dealiasing<br />
errors while VDEAL had only 71 with dealiasing errors. More striking was <strong>the</strong> reduction in velocity<br />
dealiasing errors and improved data quality <strong>of</strong> <strong>the</strong> VDEAL over <strong>the</strong> VDA in hurricanes. Of 201<br />
velocity products evaluated, VDA had 185 total dealiasing errors while VDEAL had only 5 dealiasing<br />
errors. Based on <strong>the</strong>se results and independent testing by scientists at <strong>the</strong> National Severe Storms<br />
Laboratory, <strong>the</strong> ROC plans to conduct a field test during <strong>the</strong> summer and fall <strong>of</strong> 2011.<br />
Session 4 – Page 5
A summary <strong>of</strong> new activities to expand <strong>the</strong> Caribbean sounding and surface networks<br />
The IASCLIP and COCONet initiatives<br />
Michael W. Douglas<br />
(Michael.Douglas@noaa.gov)<br />
National Severe Storms Laboratory/NOAA<br />
Norman, Oklahoma<br />
Two very different activities that are now spinning up should substantially improve surface<br />
measurements and tropospheric pr<strong>of</strong>iling across <strong>the</strong> Caribbean Sea region and neighboring<br />
regions. The Continuously Operating Caribbean GPS Observational Network (COCONet),<br />
funded by NSF, will install approximately 50 new GPS stations that, although intended primarily<br />
to measure tectonic motions for geophysical research, will also have co-located automatic<br />
wea<strong>the</strong>r stations reporting in real time. The COCONet observations will provide nearly<br />
continuous estimates <strong>of</strong> precipitable water much like <strong>the</strong> current Suominet sites. These estimates<br />
can be used both for real-time analysis and model initialization and for comparison with, and<br />
calibration <strong>of</strong>, routine radiosonde moisture information. More information on COCONet can be<br />
found at:<br />
http://www.unavco.org/community/meetings-events/2011/coconet/agenda.html<br />
Overlapping some <strong>of</strong> <strong>the</strong> objectives <strong>of</strong> COCONet is <strong>the</strong> Intra-Americas Study <strong>of</strong> Climate<br />
Processes (IASCLIP) program, being supported initially by NOAA, which although focused on<br />
climate variability, also seeks to improve <strong>the</strong> atmospheric and oceanic monitoring over <strong>the</strong><br />
region on all time scales. Some <strong>of</strong> <strong>the</strong> desired improvements to <strong>the</strong> observing network over <strong>the</strong><br />
Caribbean region overlap those being proposed by COCONet and <strong>the</strong>re will likely be joint<br />
development <strong>of</strong> some aspects <strong>of</strong> <strong>the</strong> networks. More information on <strong>the</strong> IASCLIP can be found<br />
at:<br />
http://www.eol.ucar.edu/projects/iasclip/<br />
This talk will summarize both <strong>the</strong> COCONet network and <strong>the</strong> proposed initial IASCLIP<br />
enhancements over <strong>the</strong> region. Modification to <strong>the</strong> current CHUAS (Cooperative Hurricane<br />
Upper-Air Stations) network to include adaptive observations at additional sites, proposed as part<br />
<strong>of</strong> IASCLIP and also to <strong>the</strong> JHT, will also be described.<br />
Session 4 – Page 6
Establishing an Improved National Capability for Collection <strong>of</strong> Extreme Storm and Flood<br />
Data<br />
This abstract was drafted by <strong>the</strong> members <strong>of</strong> <strong>the</strong> <strong>Office</strong> <strong>of</strong> <strong>Federal</strong> Coordinator's Workgroup on<br />
Disaster Impact Assessments: Wea<strong>the</strong>r and Water Data, including William Birkemeier<br />
(USACE), Dan Catlett (FEMA), William L. Coulbourne ( Wind and Flood Hazard Mitigation<br />
Applied Technology Conference), Robert R. Holmes (USGS, Robert R. Mason, Jr. (USGS),<br />
Anthony R. Ramirez (NOAA), Wilson Shaffer (NOAA), and D. Phil Turnipseed (USGS) and<br />
presented by Robert Mason, Workgroup Chair, on behalf <strong>of</strong> <strong>the</strong> committee.<br />
The National Oceanic and Atmospheric Administration’s (NOAA) National Wea<strong>the</strong>r Service<br />
(NWS) flood forecasting operations saves thousands <strong>of</strong> lives and reduce injuries and property<br />
damage by billions <strong>of</strong> dollars annually. But this process, which depends on data from thousands<br />
<strong>of</strong> U.S. Geological Survey streamgages and NOAA meteorological stations, usually does not<br />
provide data coverage sufficient to adequately document <strong>the</strong> extensive impacts <strong>of</strong> a major storm<br />
or flood or enable understanding <strong>of</strong> small-scale, localized processes. As a result, network<br />
observations <strong>of</strong>ten are supplemented by post-storm surveys and studies <strong>of</strong> rainfall, flood marks,<br />
and wind damage to fill in observational gaps and obtain a more complete spatial coverage. In<br />
turn, <strong>the</strong>se data are studied by <strong>the</strong> <strong>Federal</strong> Emergency Management Agency, <strong>the</strong> National<br />
Institute <strong>of</strong> Science and Technology, and various State agencies resulting in advancements in<br />
building codes and construction practices.<br />
Today, post-storm surveys and traditional networks can be greatly augmented by pre-event<br />
deployment <strong>of</strong> small, self-contained instruments in spatially dense, temporary networks to<br />
monitor <strong>the</strong> event directly and continuously. Clusters <strong>of</strong> self-logging pressure transducers and<br />
real-time rapid-deployment gages monitor waves and water-levels and anemometers and truckmounted<br />
Doppler radars monitor wind speed and direction at rapid intervals. These data<br />
describe <strong>the</strong> evolution <strong>of</strong> storms and floods with unprecedented spatial and temporal detail,<br />
particularly floods <strong>of</strong> coastal waters and wetlands. The resulting data can be used to (1) develop<br />
more accurate and robust wind, storm-surge, and flood models; (2) derive better structure design<br />
criteria and building codes; and (3) improve warning systems.<br />
Effective utilization <strong>of</strong> <strong>the</strong>se mobile networks requires <strong>the</strong> timely and well-coordinated efforts to<br />
deploy equipment into targeted areas in anticipation <strong>of</strong> <strong>the</strong> storm. In response to this need,<br />
various <strong>Federal</strong> agencies and affiliated organizations have created <strong>the</strong> National Plan for Disaster<br />
Impact Assessments: Wea<strong>the</strong>r and Water Data (NPDIA), which establishes a procedural template<br />
for coordinating various pre-storm readiness activities and post-storm responses. The plan is<br />
available from <strong>the</strong> publications web page <strong>of</strong> <strong>Office</strong> <strong>of</strong> <strong>the</strong> <strong>Federal</strong> Coordinator for<br />
Meteorological Services and Supporting Research (OFCM) at URL:<br />
http://www.<strong>of</strong>cm.gov/homepage/text/pubs.htm.<br />
This presentation will describe procedures for coordinating deployment activities, capabilities <strong>of</strong><br />
<strong>the</strong> participating agencies and affiliated organizations; mechanisms for aggregating and sharing<br />
resources; plans for documenting <strong>the</strong> event; and links to acquired data. By working toge<strong>the</strong>r and<br />
with o<strong>the</strong>r stakeholders we can better collect <strong>the</strong> timely and useful data needed to develop more<br />
robust and resilient communities and a safer, disaster resilient Nation.<br />
Session 4 – Page 7
S<br />
E<br />
S<br />
Session 5<br />
Tropical Cyclone Model<br />
Development and<br />
Technology Transfer,<br />
Part 1<br />
S<br />
I<br />
O<br />
N<br />
5
Advancements to <strong>the</strong> Operational HWRF Modeling System at EMC<br />
Vijay Tallapragada<br />
(vijay.tallapragada@noaa.gov)<br />
NOAA/NWS/NCEP/EMC/HWRF<br />
The National Centers for Environmental Prediction (NCEP)/Environmental Modeling Center<br />
(EMC) operational Hurricane Wea<strong>the</strong>r Research and Forecast (HWRF) modeling system has<br />
been upgraded for implementation in 2011 hurricane season. Through a collaborative effort,<br />
EMC and <strong>the</strong> Developmental Testbed Center (DTC) have upgraded <strong>the</strong> non-hydrostatic<br />
mesoscale model (NMM) core <strong>of</strong> <strong>the</strong> HWRF system from V2.0 and synchronized it with <strong>the</strong><br />
latest version <strong>of</strong> WRF NMM V3.2+, allowing <strong>the</strong> operational and research communities to share<br />
<strong>the</strong> same code base and help accelerate fur<strong>the</strong>r advancements to <strong>the</strong> HWRF modeling system<br />
through an efficient Research to Operations (R2O) infrastructure. Developmental activities for<br />
<strong>the</strong> HWRF system for 2011 hurricane season also included improvements to <strong>the</strong> vortex<br />
initialization procedure, new GFS deep convection parameterization, improved surface physics<br />
formulation, expanded Princeton Ocean Model (POM) Eastern Atlantic domain and enhanced<br />
hurricane model diagnostics designed to identify areas for improvement.<br />
The coupled HWRF system was uniquely designed to make significant advancements in<br />
improving operational forecast skill <strong>of</strong> intensity and structure forecasts in addition to advancing<br />
wave and storm surge forecasts to address <strong>the</strong> coastal inundation problem. Continued<br />
advancements in track prediction will remain an important focus <strong>of</strong> this prediction system.<br />
Fur<strong>the</strong>r improvements to <strong>the</strong> HWRF modeling system is being made possible through <strong>the</strong><br />
support provided by <strong>the</strong> Hurricane Forecast Improvement Project (HFIP). Accelerating<br />
advancements in hurricane prediction will require an infusion <strong>of</strong> resources directed at<br />
concentrating vital modeling efforts at NCEP in <strong>the</strong> areas <strong>of</strong> model resolution, advanced triple<br />
nested grids, improved air-sea-wave-land coupling, advanced hurricane physics suitable for<br />
higher resolutions, improved data assimilation methods to ingest new and existing datasets in <strong>the</strong><br />
hurricane core, and high resolution HWRF ensembles to account for uncertainties in <strong>the</strong> initial<br />
state and physics.<br />
Session 5 – Page 1
Issues in transitioning HWRF upgrades into operations at EMC<br />
A Joint Hurricane Testbed (JHT) <strong>Program</strong><br />
Robert E. Tuleya, Young Kwon, Vijay Tallapragada,<br />
Zhan Zhang, Yihua Wu, Qingfu Liu, and J. O’Connor<br />
(Robert.tuleya@noaa.gov)<br />
CCPO/ODU<br />
The 2010-2011 JHT project funded through <strong>the</strong> Center for Coastal Physical Oceanography (CCPO)<br />
at Old Dominion University (ODU) has concentrated on HWRF development, its operational<br />
implementation, and recent upgrades. Over <strong>the</strong> last year emphasis on this project has been on trouble<br />
shooting problems involving model biases <strong>of</strong> intensity and issues involving land interaction. The<br />
long-standing HWRF problem with unrealistic, cold land surface temperatures was corrected with<br />
<strong>the</strong> 2010 forecast system. Some fur<strong>the</strong>r analysis and possible refinements to <strong>the</strong>se land-related issues<br />
will be discussed in addition to refinements in <strong>the</strong> new HWRF surface flux package.<br />
A new surface flux package based on observations was implemented for <strong>the</strong> 2010 season that has in<br />
part contributed to some improvements <strong>of</strong> track and intensity in HWRF. This new 2010 surface flux<br />
package has been fur<strong>the</strong>r examined and contrasted with packages used in o<strong>the</strong>r operational models.<br />
Fur<strong>the</strong>rmore, this new package was generalized and recast in terms <strong>of</strong> momentum and <strong>the</strong>rmal<br />
roughness lengths. This new revised code has been installed in <strong>the</strong> new HWRF V3 model version to<br />
be installed for 2011 operations. Some comparisons will be shown in running <strong>the</strong> HWRF model<br />
using different flavors <strong>of</strong> <strong>the</strong> new formulation.<br />
In order to quantify <strong>the</strong> impact <strong>of</strong> using a more sophisticated land model, i.e. <strong>the</strong> NOAH LSM,<br />
HWRF underwent extensive testing in 2010. These tests including running <strong>the</strong> operational system,<br />
H210, both for numerous historical cases <strong>of</strong> 2008-2009 and for nearly 300 cases in real-time for <strong>the</strong><br />
2010 Atlantic season. Besides using <strong>the</strong> NOAH LSM surface option, <strong>the</strong> tests also included changes<br />
to <strong>the</strong> operational system to allow more frequent output <strong>of</strong> surface and sub-surface runn<strong>of</strong>f - a<br />
requiremnt for a stream routing model. The standard verification parameters <strong>of</strong> mean track and<br />
intenity errors were applied to <strong>the</strong>se suite <strong>of</strong> cases. As opposed to prelimiary results using a previous<br />
HWRF model version, <strong>the</strong> 20120 HWRF version with <strong>the</strong> NOAH LSM option led to some<br />
degradation in both track and intensity at some forecast times. These results will be shown. Fur<strong>the</strong>r<br />
issues with <strong>the</strong> proposed 2011 HWRF version involving <strong>the</strong> transition from WRF 2 to WRF3 will<br />
also be shown.<br />
Session 5 – Page 2
2011 operational HWRF model upgrades<br />
Young Kwon, Vijay Tallaparagada, Robert Tuleya, Qingfu Liu, Kevin Yeh, Zhan Zhang, Sam<br />
Trahan and Janna O’Connor<br />
(Young.Kwon@noaa.gov)<br />
EMC/NCEP/NWS/NOAA<br />
The hurricane model team at EMC/NCEP is working on upgrade <strong>of</strong> <strong>the</strong> operational HWRF<br />
model for <strong>the</strong> year 2011 hurricane season. There are three main components <strong>of</strong> <strong>the</strong> upgrades,<br />
which are 1) modified vortex initialization method, 2) new deep convection parameterization<br />
with revised surface physics and 3) bug fixed <strong>of</strong> microphysics and radiation in addition to<br />
dynamic core upgrade to NMM v3.2.<br />
The preliminary results indicate that <strong>the</strong> initialization and physics upgrades improve <strong>the</strong><br />
accuracy <strong>of</strong> intensity and track forecast <strong>of</strong> HWRF model respectively while <strong>the</strong> bug fixes do not<br />
impact <strong>the</strong> skill <strong>of</strong> <strong>the</strong> model significantly. Especially, <strong>the</strong> new initialization scheme significantly<br />
improve <strong>the</strong> intensity forecast skill <strong>of</strong> 0-48 hour forecast ranges with maximum about 25%<br />
compare to <strong>the</strong> old method. The test cases, detailed explanations <strong>of</strong> upgrades will be presented<br />
during <strong>the</strong> conference.<br />
Session 5 – Page 3
Major Upgrades Planned in 2011 for <strong>the</strong> GFDL Hurricane Prediction System<br />
Morris A. Bender 1 , Isaac Ginis 2 , Biju Thomas 2 , and Richard Yablonsky 2<br />
(Morris.Bender@noaa.gov)<br />
1 DOC/NOAA/Geophysical Fluid Dynamics Laboratory; 2 Graduate School <strong>of</strong> Oceanography,<br />
University <strong>of</strong> Rhode Island<br />
Major upgrades to <strong>the</strong> GFDL hurricane prediction system, run operationally by <strong>the</strong><br />
National Wea<strong>the</strong>r Service, have been extensively tested and evaluated for operational<br />
implementation in 2011. These changes include upgrade <strong>of</strong> <strong>the</strong> deep convection scheme to <strong>the</strong><br />
version implemented into NCEP’s Global Forecast System (GFS) in 2010, implementation <strong>of</strong> <strong>the</strong><br />
new GFS shallow convection, modification <strong>of</strong> <strong>the</strong> enthalpy exchange coefficient (Ch), inclusion<br />
<strong>of</strong> solar radiation into <strong>the</strong> ocean coupler, several bug fixes in <strong>the</strong> surface physics and ocean<br />
coupling code, extension <strong>of</strong> <strong>the</strong> eastern Atlantic ocean domain, and adoption <strong>of</strong> a more<br />
consistent dissipative heating scheme.<br />
Preliminary results, using initial and boundary conditions taken from <strong>the</strong> new GFS<br />
planned for operational implementation in 2011, show about a 20% decrease in track error in <strong>the</strong><br />
4-5 day range, for 305 forecasts run for storms during <strong>the</strong> 2010 Atlantic hurricane season. This<br />
improvement was statistically significant at <strong>the</strong> 95% level. Reduction <strong>of</strong> track error was even<br />
more pronounced for major hurricanes Danielle, Earl and Igor, with over a 22% reduction in<br />
track error in <strong>the</strong> 2-5 day forecast time period.<br />
Evaluation <strong>of</strong> <strong>the</strong> environment fields indicate that with <strong>the</strong> new physics package, <strong>the</strong><br />
forecast evolution <strong>of</strong> <strong>the</strong> sub-tropical high was much better simulated over <strong>the</strong> central and<br />
western Atlantic. This resulted in a marked reduction in <strong>the</strong> model’s bias for premature<br />
recurvature, particularly for intense hurricanes.<br />
Examples <strong>of</strong> some <strong>of</strong> <strong>the</strong> storm tracks will be shown for select cases, as well as examples<br />
<strong>of</strong> differences in <strong>the</strong> environmental fields forecasted by <strong>the</strong> upgraded model compared to <strong>the</strong><br />
current operational system. Since upgrades are also planned for <strong>the</strong> GFS before <strong>the</strong> start <strong>of</strong> <strong>the</strong><br />
2011 hurricane season, results will also be shown, on <strong>the</strong> impact <strong>of</strong> <strong>the</strong>se changes for both <strong>the</strong><br />
GFS and GFDL performance. Overall impact on intensity so far has been mostly neutral with <strong>the</strong><br />
new model.<br />
Funding for this work has been provided by <strong>the</strong> NOAA Joint Hurricane Testbed <strong>Program</strong>.<br />
Session 5 – Page 4
An Overview <strong>of</strong> COAMPS-TC Development and Real-Time Tests<br />
James D. Doyle, R. Hodur, S. Chen, J. Cummings, E. Hendricks, T. Holt, H. Jin, Y. Jin, C.-S.<br />
Liou, J. Moskaitis, M. Peng, K. Sashegyi, J. Schmidt, S. Wang<br />
(James.Doyle@nrlmry.navy.mil)<br />
Naval Research Laboratory<br />
The newly developed Coupled Ocean/Atmosphere Mesoscale Prediction System – Tropical<br />
Cyclone (COAMPS ® -TC), designed to predict tropical cyclone track, structure, and intensity, has<br />
been applied in real-time in support <strong>of</strong> <strong>the</strong> recent Hurricane Forecast Improvement Project<br />
(HFIP). These real time forecasts were performed in <strong>the</strong> Atlantic basin; and in <strong>the</strong> Eastern,<br />
Central, and Western Pacific basins during <strong>the</strong> 2009 and 2010 seasons. Additionally,<br />
retrospective tests for HFIP were conducted on a large sample <strong>of</strong> storms (more than 400 cases)<br />
over <strong>the</strong> W. Atlantic and E. Pacific basins for hurricanes that occurred in <strong>the</strong> 2008 and 2009<br />
seasons. For <strong>the</strong>se real time and retrospective tests, <strong>the</strong> COAMPS-TC system was configured<br />
with three nested grids, with 45, 15, 5 km horizontal grid spacings. The inner two meshes<br />
automatically moved with <strong>the</strong> tropical cyclone center.<br />
A number <strong>of</strong> improvements were made to <strong>the</strong> COAMPS-TC physics and data assimilation based<br />
on <strong>the</strong> results <strong>of</strong> <strong>the</strong> 2009 tropical cyclone forecast season. This version <strong>of</strong> COAMPS-TC was<br />
<strong>the</strong>n evaluated using <strong>the</strong> HFIP retrospective cases performed for 2008 and 2009. The intensity<br />
forecasts for <strong>the</strong> retrospective tests show <strong>the</strong> model skill for intensity was superior to o<strong>the</strong>r<br />
dynamical models, particularly for <strong>the</strong> 30-72 h forecast range. Similarly, an analysis <strong>of</strong> <strong>the</strong> 2010<br />
real-time forecasts in support <strong>of</strong> HFIP reveals that <strong>the</strong> COAMPS-TC intensity forecasts for <strong>the</strong><br />
W. Atlantic were superior to o<strong>the</strong>r dynamical models for <strong>the</strong> 30-66 h forecast range. Statistical<br />
verification from <strong>the</strong>se retrospective tests indicates that <strong>the</strong> COAMPS-TC system provided<br />
skillful track forecasts competitive with o<strong>the</strong>r limited area models such as <strong>the</strong> Navy’s GFDN.<br />
Following <strong>the</strong> analysis <strong>of</strong> <strong>the</strong> 2010 real time forecast results, a number <strong>of</strong> improvements were<br />
made to COAMPS-TC including a new algorithm for syn<strong>the</strong>tic observations, inclusion <strong>of</strong><br />
additional observations such as satellite derived total precipitable water that are used by <strong>the</strong> Navy<br />
Atmospheric Variational Data Assimilation System (NAVDAS), and a new formulation <strong>of</strong><br />
vertical mixing within clouds and deep convection. Sensitivity test results from this new<br />
improved version <strong>of</strong> COAMPS-TC will be presented. Additionally, real-time application <strong>of</strong><br />
COAMPS-TC in <strong>the</strong> W. Pacific basin during <strong>the</strong> Interaction <strong>of</strong> Typhoons and Ocean Processes<br />
(ITOP) will be discussed.<br />
Session 5 – Page 5
Progress towards developing a coupled atmosphere-wave-ocean framework for research<br />
and operational hurricane models<br />
Isaac Ginis 1 , Biju Thomas 1 , Richard Yablonsky 1 , Tetsu Hara 1 , Jian-Wen Bao 2 , Chris Fairall 2 , and<br />
Laura Bianco 2<br />
(iginis@gso.uri.edu)<br />
1 Graduate School <strong>of</strong> Oceanography, University <strong>of</strong> Rhode Island; 2 NOAA/ESRL/PSD<br />
We will discuss our progress towards developing a coupled hurricane-wave-ocean framework for<br />
operational implementation at NOAA and <strong>the</strong> U.S. Navy. Our goals are to understand <strong>the</strong><br />
physical processes that control air-sea interaction and to develop a physically based and<br />
computationally efficient coupling at <strong>the</strong> air-sea interface for use in research and operational<br />
hurricane models. The key element <strong>of</strong> <strong>the</strong> our approach is an air-sea interface module consisting<br />
<strong>of</strong> a wave boundary layer model and an air-sea heat and momentum flux budget model that<br />
explicitly resolve wind-wave-current interaction processes and sea spray effects. So far, <strong>the</strong><br />
module has been imbedded into <strong>the</strong> experimental version <strong>of</strong> <strong>the</strong> GFDL hurricane-wave-ocean<br />
coupled model and calculates all <strong>of</strong> <strong>the</strong> flux boundary conditions for <strong>the</strong> atmospheric, wave, and<br />
ocean model components. This module will be implemented into <strong>the</strong> HWRF coupled system<br />
later this year. We will present <strong>the</strong> results <strong>of</strong> idealized and real-case simulations and evaluate <strong>the</strong><br />
impact <strong>of</strong> explicit wind-wave-ocean coupling on hurricane track and intensity forecasts.<br />
Session 5 – Page 6
Evaluation and Improvement <strong>of</strong> Ocean Model Parameterizations for NCEP Operations<br />
Lynn K. Shay 1 , George. R. Halliwell, Jr. 2 , Benjamin Jaimes 1<br />
(nshay@rsmas.miami.edu)<br />
1 Division <strong>of</strong> Meteorology and Physical Oceanography, RSMAS, University <strong>of</strong> Miami<br />
2 NOAA/AOML/POD<br />
The research focused on testing model initialization schemes primarily in <strong>the</strong> Gulf <strong>of</strong> Mexico<br />
(GOM) and processing data required for model evaluation. This dataset includes in situ Naval<br />
Research Laboratory Acoustic Doppler Current Pr<strong>of</strong>iler (ADCP) data from Ivan and during<br />
Katrina and Rita (courtesy <strong>of</strong> Minerals Management Service) as well as measurements acquired<br />
during NOAA Hurricane Research Division Intensity Fluctuation Experiments (IFEX) in pre and<br />
post Rita in 2005, and during Gustav and Ike (2008). All <strong>of</strong> <strong>the</strong>se hurricanes have been shown to<br />
have been affected by warm and cold ocean features in <strong>the</strong> GOM. Numerical experiments for <strong>the</strong><br />
Ivan case demonstrated <strong>the</strong> import <strong>of</strong> model sensitivity to vertical resolution, horizontal<br />
resolution, vertical mixing, air-sea flux parameterizations (drag coefficients), ocean dynamics,<br />
and <strong>the</strong> accuracy <strong>of</strong> <strong>the</strong> ocean initialization.<br />
Analyses <strong>of</strong> <strong>the</strong> ocean response to hurricanes Katrina and Rita from in-situ (moorings, airborne<br />
pr<strong>of</strong>ilers) and satellite-based measurements have shown significant modulation <strong>of</strong> <strong>the</strong> oceanic<br />
mixed layer cooling by <strong>the</strong> geostrophically balanced currents in both warm and cold eddies.<br />
Using an idealized, isopycnic ocean model and wind fields derived from data acquired during<br />
hurricane Katrina, aspects <strong>of</strong> <strong>the</strong> ocean response to tropical cyclones (TC) are investigated in <strong>the</strong><br />
eddies. It is found that ra<strong>the</strong>r than a function <strong>of</strong> <strong>the</strong> wind stress curl, <strong>the</strong> upwelling response is a<br />
function <strong>of</strong> <strong>the</strong> curl <strong>of</strong> wind-driven acceleration <strong>of</strong> oceanic mixed layer (OML) geostrophic<br />
currents: upwelling (downwelling) regimes prevail under <strong>the</strong> TC’s eye over cyclonic<br />
(anticyclonic) eddies. Predominant iso<strong>the</strong>rm downwelling, wind erosion over deep, warm, and<br />
nearly homogeneous water columns, and dispersion <strong>of</strong> OML near-inertial energy only produce<br />
OML cooling <strong>of</strong> ~1 o C in anticyclones, consistent with observations. By contrast, widespread<br />
upwelling <strong>of</strong> <strong>the</strong> iso<strong>the</strong>rms and wind-induced mixing over shallow OMLs with enhanced vertical<br />
current shears produce OML cooling <strong>of</strong> ~4 o C in cyclones. For oceanic models to correctly<br />
reproduce TC-induced OML cooling and feedback mechanisms to TC intensity, <strong>the</strong>y must<br />
accurately resolve mesoscale oceanic features, including position and <strong>the</strong>rmal, density, and<br />
velocity structures.<br />
For this reason, ocean model improvement efforts at <strong>the</strong> National Centers must focus on<br />
improving <strong>the</strong> model initialization through assimilation methods. During <strong>the</strong> summer <strong>of</strong> 2010,<br />
an extensive data set was acquired in response to <strong>the</strong> Deep Water Horizon oil spill in <strong>the</strong> Gulf <strong>of</strong><br />
Mexico. The 3-dimensional snapshots from NOAA research aircraft <strong>of</strong> <strong>the</strong> upper ocean structure<br />
captured <strong>the</strong> complex detachment/reattachment processes associated with Eddy Franklin from<br />
<strong>the</strong> Loop Current.<br />
Session 5 – Page 7
S<br />
E<br />
S<br />
Session 6<br />
Tropical Cyclone Model<br />
Development and<br />
Technology Transfer,<br />
Part 2<br />
S<br />
I<br />
O<br />
N<br />
6
Prediction <strong>of</strong> Consensus TC Track Forecast Error (2005-2010)<br />
James S. Goerss<br />
(jim.goerss@nrlmry.navy.mil)<br />
Marine Meteorology Division, Naval Research Laboratory<br />
Funded by a JHT project, a graphical predicted consensus error product (GPCE; Goerss 2007)<br />
was first developed and installed on <strong>the</strong> ATCF at both NHC and JTWC in 2004. Using GPCE’s<br />
pool <strong>of</strong> predictors, revised regression models to be used for <strong>the</strong> upcoming season were derived<br />
and installed on <strong>the</strong> ATCF at both centers from 2005 to 2010. These regression models are used<br />
to determine <strong>the</strong> radii <strong>of</strong> circular areas drawn around <strong>the</strong> consensus model forecast positions<br />
within which <strong>the</strong> verifying TC position is expected to be contained approximately 70% <strong>of</strong> <strong>the</strong><br />
time. These circular areas are <strong>the</strong>n graphically displayed on <strong>the</strong> ATCF for use by <strong>the</strong> forecasters<br />
at NHC and JTWC. For each season from 2005 to 2010, GPCE is validated for <strong>the</strong> Atlantic and<br />
Eastern North Pacific basins. For each forecast length, <strong>the</strong> GPCE validation percentage is<br />
compared with <strong>the</strong> consensus forecast error for <strong>the</strong> season. As one would expect, since <strong>the</strong><br />
GPCE regression models are derived using <strong>the</strong> results from previous seasons (e.g., for 2010 <strong>the</strong><br />
dependent data for <strong>the</strong> Atlantic basin came from <strong>the</strong> 2003-2009 seasons), <strong>the</strong> GPCE validation<br />
percentages for a given season are larger/smaller than <strong>the</strong> 70% target when <strong>the</strong> consensus<br />
forecast errors for that season are smaller/larger than average. For <strong>the</strong> entire period from 2005 to<br />
2010, <strong>the</strong> GPCE validation percentages for <strong>the</strong> Atlantic basin were 75%, 76%, 76%, 79%, and<br />
79% for 24h, 48h, 72h, 96h, and 120h, respectively. The respective errors for <strong>the</strong> eastern North<br />
Pacific basin were 71%, 73%, 79%, 80%, and 82%. All <strong>of</strong> <strong>the</strong> GPCE validation percentages are<br />
larger than <strong>the</strong> target for <strong>the</strong> entire period. This result is consistent with <strong>the</strong> general reduction in<br />
consensus forecast error from 2005 to 2010 due to improvements in individual track forecast<br />
models and <strong>the</strong> addition <strong>of</strong> more “good” models (e.g., ECMWF and HWRF) to <strong>the</strong> consensus.<br />
Session 6 – Page 1
Ensemble Forecasting Products for Tropical Cyclones at <strong>the</strong> UK Met <strong>Office</strong>.<br />
Piers Buchanan and Ken Mylne<br />
(piers.buchanan@met<strong>of</strong>fice.gov.uk)<br />
Met <strong>Office</strong>, Exeter, United Kingdom<br />
The Met <strong>Office</strong> global ensemble forecasting model, MOGREPS-15 runs twice a day producing<br />
global forecasts at 60km resolution out to a 15 day lead time. There is 1 control member and 23<br />
perturbed ensemble members. Since October 2006, tropical cyclone products have been<br />
produced twice daily. There are products for individual tracks and strike probability for named<br />
storms. There are also products generated for 6 worldwide basin areas which track both existing<br />
storms and potential developing storms. A subset <strong>of</strong> <strong>the</strong>se products is currently disseminated to<br />
several international forecasting organisations including <strong>the</strong> National Hurricane Center. These<br />
products will be overviewed toge<strong>the</strong>r with some specific examples <strong>of</strong> <strong>the</strong>ir use.<br />
Additionally, as part <strong>of</strong> <strong>the</strong> TIGGE cyclone exchange project, Met <strong>Office</strong> ensemble storm<br />
forecast tracks are shared with those <strong>of</strong> o<strong>the</strong>r forecasting organisations. Some objective<br />
verification results for combining ECMWF and MOGREPS data will be presented. In addition,<br />
<strong>the</strong> combined performance <strong>of</strong> <strong>the</strong> 2 ensembles is shown for several examples.<br />
Session 6 – Page 2
Large ensemble tropical cyclone intensity forecasting<br />
Kerry Emanuel 1 , Ross H<strong>of</strong>fman 2 , Susanna Hopsch 2 , Daniel Gombos 2 , and Thomas Nehrkorn 2<br />
(emanuel@mit.edu)<br />
1 Massachusetts Institute <strong>of</strong> Technology; 2 Atmospheric and Environmental Research, Inc.<br />
The advent <strong>of</strong> ensemble prediction <strong>of</strong> tropical cyclone tracks has led to improvements in<br />
<strong>the</strong> quantification <strong>of</strong> uncertainty in track forecasts. But <strong>the</strong> severe computational demands for<br />
tropical cyclone intensity prediction have limited <strong>the</strong> utility <strong>of</strong> ensembles for quantification <strong>of</strong><br />
tropical cyclone intensity forecast uncertainty. We here attempt to circumvent this difficulty by<br />
running large (100-1000 member) ensembles <strong>of</strong> tropical cyclone forecasts using <strong>the</strong> Coupled<br />
Intensity Hurricane Prediction System (CHIPS) bootstrapped from <strong>the</strong> ECMWF 51-member<br />
ensemble forecasts. The CHIPS model is phrased in angular momentum coordinates, allowing<br />
high resolution <strong>of</strong> <strong>the</strong> critical eyewall region at <strong>the</strong> expense <strong>of</strong> less resolution <strong>of</strong> <strong>the</strong> outer regions<br />
<strong>of</strong> <strong>the</strong> storm. Tracks are generated by calculating <strong>the</strong> ensemble mean and full covariance matrix<br />
<strong>of</strong> <strong>the</strong> ECMWF track velocities and using <strong>the</strong>se to create a large number <strong>of</strong> tracks whose velocity<br />
mean and covariances match those <strong>of</strong> <strong>the</strong> ECMWF tracks. But with time, this track algorithm<br />
evolves into a beta-and-advection technique whose driving winds are derived from <strong>the</strong> ECMWF<br />
ensemble forecasts. This also allows us to extend <strong>the</strong> tracks from 5 to 10 days. Once <strong>the</strong> tracks<br />
are created, CHIPS is run along each track to forecast intensity. We will present some results<br />
from <strong>the</strong> 2010 hurricane season.<br />
Session 6 – Page 3
The Performance <strong>of</strong> a GFDL Hurricane Model Ensemble Forecast System during <strong>the</strong> 2010<br />
Atlantic Hurricane Season<br />
Timothy Marchok and Morris Bender<br />
(timothy.marchok@noaa.gov)<br />
NOAA / GFDL<br />
Since 1995, <strong>the</strong> GFDL Hurricane Model (GHM) has been run operationally at NCEP. During<br />
<strong>the</strong> 2010 hurricane season, an ensemble forecast system was developed for <strong>the</strong> GHM and was<br />
run in near-real time as part <strong>of</strong> <strong>the</strong> HFIP Project on <strong>the</strong> NOAA Jet supercomputer. This talk will<br />
describe <strong>the</strong> design <strong>of</strong> <strong>the</strong> GHM ensemble forecast system and will summarize results from <strong>the</strong><br />
2010 Atlantic Season. In addition, plans for running this system for <strong>the</strong> 2011 season will be<br />
discussed.<br />
The GHM ensemble forecast system developed in 2010 consisted <strong>of</strong> 11 members, with one<br />
control forecast and ten perturbed forecasts. All 11 member forecasts used <strong>the</strong> same triplynested<br />
configuration as in operations at NCEP, with a horizontal resolution in <strong>the</strong> innermost grid<br />
<strong>of</strong> 1/12 o .<br />
Most <strong>of</strong> <strong>the</strong> modifications that were made to <strong>the</strong> GHM system to create <strong>the</strong> perturbed forecasts<br />
were designed with <strong>the</strong> intention <strong>of</strong> having an impact primarily on intensity forecasts. Six <strong>of</strong> <strong>the</strong><br />
members were created by modifying storm size parameters that are included on <strong>the</strong> TC vitals<br />
storm warning message send from NHC. These members based on storm size were created by<br />
increasing or decreasing <strong>the</strong> observed storm size parameters by 25%. One member was created<br />
by using <strong>the</strong> environmental filtering scheme from a previous version <strong>of</strong> <strong>the</strong> GHM, and ano<strong>the</strong>r<br />
member was created by not including <strong>the</strong> vortex asymmetries from previous forecasts as is done<br />
in operations. Ano<strong>the</strong>r member was created by setting a minimum threshold on <strong>the</strong> radius <strong>of</strong><br />
maximum winds that is different than is done in operations, and <strong>the</strong> final member was created by<br />
simply running <strong>the</strong> GFDL forecast system without including a bogussed vortex.<br />
Evaluations <strong>of</strong> <strong>the</strong> GHM ensemble mean intensity forecasts indicated reductions in forecast<br />
errors from 24h to 96h ranging from 5.4% to 11.6%. These improvements were statistically<br />
significant from 36h through 96h. Reductions in track errors were found in <strong>the</strong> first 72h <strong>of</strong> <strong>the</strong><br />
forecast period, statistical significance from 12h through 48h and a maximum improvement <strong>of</strong><br />
5.6% at 12h.<br />
Despite <strong>the</strong>se improvements, results indicated that <strong>the</strong> ensemble was under-dispersive for both<br />
track and intensity forecasts, and this will be an area <strong>of</strong> focus in modifying <strong>the</strong> system for <strong>the</strong><br />
2011 hurricane season. In addition to <strong>the</strong> current members which focus mainly on perturbations<br />
to <strong>the</strong> observed storm size, we will add some members that include modifications to some <strong>of</strong> <strong>the</strong><br />
physics parameterizations within <strong>the</strong> model.<br />
Session 6 – Page 4
Evaluation and Development <strong>of</strong> Ensemble Prediction System for <strong>the</strong> Operational HWRF<br />
Model<br />
Zhan Zhang, V. Tallapragada, R. Tuleya, Q. Liu, Y. Kwon, S. Trahan, J. O’Connor, and W. M.<br />
Lapenta<br />
(zhan.zhang@noaa.gov)<br />
NOAA/NCEP/EMC-IMSG, Camp Springs, MD<br />
Ensemble prediction system (EPS) has been proven to be effective in reducing various<br />
uncertainties in model initial states and model physics, and <strong>the</strong>refore improving model forecast<br />
skills. This talk reviews <strong>the</strong> undergoing efforts at NCEP/EMC to develop EPS based on <strong>the</strong><br />
operational Hurricane Wea<strong>the</strong>r Research and Forecasting (HWRF) model. The study attempts to<br />
understand <strong>the</strong> impact <strong>of</strong> various uncertainties on <strong>the</strong> model hurricane track and intensity<br />
forecasts, and to find out <strong>the</strong> best combination <strong>of</strong> ensemble perturbations for HWRF EPS.<br />
The key to a successful hurricane ensemble forecast is to generate a set <strong>of</strong> ensembles that<br />
represent <strong>the</strong> uncertainties in hurricane model prediction system. The important uncertainties that<br />
need to be taken into account in hurricane EPS include <strong>the</strong> uncertainties in <strong>the</strong> hurricane initial<br />
structures, initial large scale environment flows, model lateral boundary conditions (LBC), and<br />
model physics. Following ensemble perturbations are evaluated within <strong>the</strong> operational HWRF<br />
model framework:<br />
• Initial hurricane structures: in order to reduce <strong>the</strong> uncertainties in initial hurricane<br />
structure, <strong>the</strong> observed initial radius <strong>of</strong> maximum wind is perturbed by<br />
increasing/decreasing 25% <strong>of</strong> its value in tcvital file;<br />
• Large scale environment flows and LBC at initial states: data sets from Global Ensemble<br />
Forecast System (GEFS), which have resolution <strong>of</strong> T190L28 and includes 21 ensemble<br />
members, are used to initialize HWRF domain and LBC;<br />
• Physics-based perturbations: uncertainties due to model physics can be reduced by using<br />
various physics packages in HWRF. Several model physics packages have been used for<br />
this purpose. They include two convective schemes: Simplified Arakawa-Schubert<br />
(SAS), Kain-Fritsch, and two PBL schemes: GFS PBL scheme, MYJ PBL scheme.<br />
• Combined ensemble perturbations: all above ensemble forecasts are <strong>the</strong>n combined to<br />
construct one ensemble.<br />
Forecast experiments <strong>of</strong> three hurricanes in 2010 season, Earl, Alex, and Celia, are carried out<br />
for different ensemble configurations. The track and intensity forecasts from each subset <strong>of</strong><br />
ensemble are evaluated and compared. Different combinations <strong>of</strong> ensembles are examined to<br />
find out <strong>the</strong> best results for HWRF EPS. Various probabilistic forecast products resulted from<br />
EPS, such as track striking probability, ensemble track spread, are also discussed.<br />
Session 6 – Page 5
Forecasting Tropical Cyclone Genesis/Development Using an Ensemble <strong>of</strong> High Resolution<br />
Deterministic Global Models – Results from <strong>the</strong> HFIP 2010 Summer Demo<br />
Mike Fiorino<br />
(Michael.Fiorino@noaa.gov)<br />
NOAA/ESRL/Global Systems Division<br />
Forecasters at <strong>the</strong> Joint Typhoon Warning Center (JTWC) and <strong>the</strong> National Hurricane Center<br />
(NHC) have, over <strong>the</strong> past several years, used medium (72-120 h)-to-long-range (5-8 d) global<br />
model forecasts to qualitatively assess <strong>the</strong> potential for tropical cyclone (TC) formation. The<br />
general finding is that if <strong>the</strong> better-performing global models (ECMWF, GFS and UKMO) all<br />
generate a surface trough, in roughly <strong>the</strong> same location, with significant 850 mb relative vorticity<br />
and strong precipitation, <strong>the</strong>n a TC is likely to occur.<br />
For <strong>the</strong> 2010 HFIP summer demo, we applied <strong>the</strong> 'genesis' version <strong>of</strong> <strong>the</strong> GFDL TC tracker to<br />
quantitatively measure <strong>the</strong> genesis forecasts <strong>of</strong> six high-resolution global models available to<br />
JWTC/NHC, namely <strong>the</strong> NCEP GFS (dx ~30km), FNMOC NOGAPS (dx ~45km), ECMWF IFS<br />
(dx ~20km), CMC GEM (dx ~60 km), UKMO UM (dx ~30 km) and <strong>the</strong> ESRL FIM (dx=30km).<br />
An objective genesis forecast scheme depends critically on <strong>the</strong> definition <strong>of</strong> genesis, in both <strong>the</strong><br />
atmosphere and in <strong>the</strong> models.<br />
For <strong>the</strong> HFIP demo, genesis is defined from an operational perspective according to USPACOM<br />
INST 0539.1 and <strong>the</strong> NHOP that require JTWC/NHC issue warnings/advisories for all "tropical<br />
cyclones" (WMO definition) in <strong>the</strong>ir AOR. Thus, <strong>the</strong> first warning/advisory is issued when a<br />
system reaches tropical depression strength (typically Vmax = 25 kt) and from this genesis point,<br />
we define a 30-h 'genesis period' so as to give 00/12UTC models three chances to forecast<br />
genesis. A successful genesis forecast is when a model 'genesis' storm (cyclones that formed<br />
during <strong>the</strong> integration and not model tracks <strong>of</strong> existing TCs) matches an actual TC during <strong>the</strong><br />
genesis period.<br />
Results from <strong>the</strong> 2010 nor<strong>the</strong>rn Hemisphere season are presented by basin (NIO, WPAC, EPAC<br />
and LANT); <strong>the</strong> main finding is that for systems that eventually reach hurricane strength, <strong>the</strong><br />
better TC forecast models (ECMWF and GFS) successfully forecast genesis at day 5 about 65%<br />
<strong>of</strong> <strong>the</strong> time. We also use <strong>the</strong> genesis forecasts to diagnose spurious model storms or 'spuricanes'<br />
and how <strong>the</strong>se false alarms depend on <strong>the</strong> model convective parametrization. Finally, <strong>the</strong> 2011<br />
HFIP stream 1.5 web page will be previewed.<br />
Session 6 – Page 6
Ensemble-based prediction and diagnostics during <strong>the</strong> PREDICT field experiement<br />
Sharanya J. Majumdar 1 , Ryan D. Torn 2 , Fuqing Zhang 3<br />
(smajumdar@rsmas.miami.edu)<br />
1 Rosenstiel School <strong>of</strong> Marine and Atmospheric Science, University <strong>of</strong> Miami;<br />
2 University at Albany, State University <strong>of</strong> New York;<br />
3 Department <strong>of</strong> Meteorology, Penn State University<br />
During <strong>the</strong> NSF-sponsored PRE-Depression Investigation <strong>of</strong> Cloud-systems in <strong>the</strong><br />
Tropics (PREDICT) field experiment, which took place during August-September 2010, a<br />
variety <strong>of</strong> synoptic-scale, mesoscale and convective-scale products based on ensemble forecasts<br />
were disseminated. In addition to operational global ensemble forecasts provided by ECMWF<br />
and NCEP, new higher-resolution, data-assimilative Wea<strong>the</strong>r Research and Forecasting<br />
ensembles initialized using <strong>the</strong> Ensemble Kalman Filter (WRF/EnKF) were also run in real-time.<br />
With <strong>the</strong> primary focus <strong>of</strong> PREDICT being to test <strong>the</strong> 'marsupial' <strong>the</strong>ory on how clusters <strong>of</strong><br />
thunderstorms organize into tropical depressions, ensemble mean and probabilistic measures <strong>of</strong><br />
low-level circulation and thickness anomaly were provided to yield quantitative estimates <strong>of</strong><br />
fields relevant to genesis. O<strong>the</strong>r products included probability distributions <strong>of</strong> vertical wind<br />
shear, relative humidity, and upper-level divergence, and spaghetti contours <strong>of</strong> <strong>the</strong> curvature <strong>of</strong><br />
<strong>the</strong> flow via <strong>the</strong> Okubo-Weiss parameter. The utility <strong>of</strong> all <strong>the</strong>se ensemble products will be<br />
presented for <strong>the</strong> disturbance that eventually became Hurricane Karl, toge<strong>the</strong>r with preliminary<br />
evaluations <strong>of</strong> <strong>the</strong> ensembles' abilities to quantitatively predict metrics relevant to genesis.<br />
Session 6 – Page 7
S<br />
E<br />
S<br />
Session 7<br />
Tropical Cyclone Model<br />
Development and<br />
Technology Transfer,<br />
Part 3<br />
S<br />
I<br />
O<br />
N<br />
7
Technology Transfer in Tropical Cyclone Numerical Modeling –<br />
The role <strong>of</strong> <strong>the</strong> Developmental Testbed Center (DTC)<br />
Ligia Bernardet 1∗ % , Shaowu Bao 1,% , Christopher Harrop 1,% , Donald Stark 2 , Timothy Brown 1,%<br />
(ligia.bernardet@noaa.gov)<br />
1 NOAA Earth System research Laboratory – Global Systems Division, Boulder, CO<br />
2 National Center for Atmospheric Research, Boulder CO<br />
The Hurricane Wea<strong>the</strong>r, Research and Forecasting (HWRF) model is one <strong>of</strong> two NOAA<br />
operational regional numerical wea<strong>the</strong>r prediction (NWP) models for tropical cyclones. HWRF<br />
is an important component <strong>of</strong> <strong>the</strong> numerical guidance used at <strong>the</strong> National Hurricane Center for<br />
tropical storm forecasting. For that reason, it is critical that HWRF be continuously improved<br />
and uses state <strong>of</strong> <strong>the</strong> art research and developments in tropical NWP.<br />
The Developmental Testbed Center (DTC – dtcenter.org) has partnered with <strong>the</strong> NOAA National<br />
Centers for Environmental Prediction to work with <strong>the</strong> transfer <strong>of</strong> new technologies onto HWRF.<br />
The DTC is an organization with nodes at NOAA Earth System Research Laboratory and <strong>the</strong><br />
National Center for Atmospheric Research that has as a mission bridging <strong>the</strong> gap between<br />
research and operations in several areas <strong>of</strong> numerical wea<strong>the</strong>r prediction.<br />
The DTC’s work in transferring new technology to HWRF follows two strategies. First, <strong>the</strong> DTC<br />
recognizes that <strong>the</strong> use <strong>of</strong> a single code base between research and operations facilitates <strong>the</strong><br />
exchanges between <strong>the</strong> two groups. Over <strong>the</strong> last year, <strong>the</strong> DTC has worked with NOAA NCEP<br />
to merge <strong>the</strong> components <strong>of</strong> <strong>the</strong> HWRF model that are used operationally onto Community<br />
codes. This work has culminated with <strong>the</strong> transfer <strong>of</strong> a community model for operational<br />
implementation for <strong>the</strong> 2011 hurricane season. Since March 2010, <strong>the</strong> DTC has been providing<br />
code management and user support for HWRF (http://www.dtcenter.org/HurrWRF/users),<br />
having now reached 150 registered users. Our presentation will describe <strong>the</strong> process used to<br />
transfer <strong>the</strong> community model onto operations and <strong>the</strong> support that DTC provides to its users.<br />
The second strategy is to have <strong>the</strong> DTC maintain a functionally equivalent HWRF testing and<br />
evaluation infrastructure in order to assess new developments that have a potential for<br />
operational implementation in <strong>the</strong> short or medium term. We will present results <strong>of</strong> multipleseason<br />
forecasts <strong>of</strong> <strong>the</strong> Community HWRF model and will discuss <strong>the</strong> upcoming evaluations to<br />
be conducted at <strong>the</strong> DTC to test new developments that have a potential for operational<br />
implementation.<br />
% Also affiliated with <strong>the</strong> Cooperative Institute for Research in <strong>the</strong> Environmental Sciences, University <strong>of</strong> Colorado,<br />
Boulder, CO.<br />
Session 7 – Page 1
Objective evaluation <strong>of</strong> 2010 HFIP Stream 1.5 candidates<br />
Louisa Nance, Christopher L. Williams, Michelle Harrold, Kathryn Newman, Paul Kucera, and<br />
Barbara Brown<br />
(nance@ucar.edu)<br />
National Center for Atmospheric Research, Boulder, CO<br />
The Hurricane Forecast Improvement Project (HFIP) provides <strong>the</strong> basis for NOAA and o<strong>the</strong>r<br />
agencies to coordinate hurricane research needed to significantly improve numerical guidance<br />
for hurricane forecasts. HFIP activities supporting <strong>the</strong> yearly upgrades made to operational<br />
numerical wea<strong>the</strong>r prediction (NWP) capabilities are referred to as “Stream 1”; whereas efforts<br />
taking multiple years to enhance operations are referred to as “Stream 2”. In 2010, HFIP and <strong>the</strong><br />
National Hurricane Center (NHC) established a new, intermediate pathway to operations known<br />
as “Stream 1.5”. Stream 1.5 covers experimental models and/or techniques that NHC, based on<br />
prior assessments, wants to access in real-time during a particular hurricane season, but which<br />
cannot be made available to NHC by <strong>the</strong> operational modeling centers in conventional<br />
“production” mode. Stream 1.5 projects are run as part <strong>of</strong> HFIP’s annual “Demonstration<br />
Project”. To qualify, participation by a candidate project must be approved by HFIP<br />
management and <strong>the</strong> NHC. Part <strong>of</strong> <strong>the</strong> basis for this approval is demonstrated performance<br />
through extensive retrospective testing. The retrospective testing for <strong>the</strong> 2010 Stream 1.5<br />
candidates focused on a representative sample <strong>of</strong> 27 storms from <strong>the</strong> 2008 and 2009 hurricane<br />
seasons. Four modeling groups participated in this retrospective test activity: Geophysical Fluid<br />
Dynamics Laboratory (GFDL) – GFDL hurricane model, Mesoscale and Microscale<br />
Meteorology (MMM) division <strong>of</strong> <strong>the</strong> NCAR Earth System Laboratory (NESL) – Advanced<br />
Hurricane WRF (AHW), Naval Research Laboratory (NRL) – Couple Ocean/Atmosphere<br />
Mesoscale Prediction System - Tropical Cyclone (COAMPS-TC), and Florida State University<br />
(FSU) – Advanced Research WRF (ARW). This presentation will discuss <strong>the</strong> objective<br />
evaluation <strong>of</strong> <strong>the</strong> submitted retrospective forecasts that was conducted by <strong>the</strong> Tropical Cyclone<br />
Modeling Team (TCMT) located in <strong>the</strong> Joint Numerical Testbed (JNT) <strong>of</strong> NCAR’s Research<br />
Applications Laboratory (RAL). The presentation will briefly review <strong>the</strong> methodology used for<br />
this evaluation, summarize <strong>the</strong> high lights <strong>of</strong> <strong>the</strong> evaluation and discuss plans for <strong>the</strong> 2011<br />
Stream 1.5 retrospective testing.<br />
Session 7 – Page 2
Hurricane Intensity and Structure Research Using NOAA's High Resolution Forecast<br />
Model and its Transition to Operations<br />
Sundararaman.G.Gopalakrishnan 1 , Frank Marks 1 and Vijay Tallapragada 1<br />
(gopal@noaa.gov)<br />
1 /AOML/NOAA/HRD; 2 NOAA/NCEP/EMC<br />
HWFRX is <strong>the</strong> high resolution, research version <strong>of</strong> <strong>the</strong> National Centers for Environmental<br />
Prediction’s (NCEP) Hurricane Wea<strong>the</strong>r Research and Forecasting model specifically adopted<br />
and developed jointly at NOAA’s Atlantic Oceanographic and Meteorological Laboratory<br />
(AOML) and Earth System Research Laboratory (ESRL) for studying <strong>the</strong> intensity change<br />
problem at 1-3 km model grid resolution. This modeling system is supported by NOAA's<br />
Hurricane Forecasting Improvement Project (HFIP). An overview <strong>of</strong> <strong>the</strong> model<br />
developments and <strong>the</strong> related research activities will be provided. As a part <strong>of</strong> <strong>the</strong> HFIP demo<br />
project a 3-km-resolution version <strong>of</strong> <strong>the</strong> HWRFX system was run using <strong>the</strong> operational HWRF<br />
initial conditions for <strong>the</strong> 2005, 2007, 2009 and 2010 seasons. Several sensitivity experiments on<br />
initial conditions, physics and resolution were also performed for at least a set <strong>of</strong> 89 cases <strong>of</strong><br />
storms from those seasons. The seasonal performance <strong>of</strong> <strong>the</strong> model along with <strong>the</strong> results from<br />
<strong>the</strong> sensitivity experiments will be provided. A merger <strong>of</strong> <strong>the</strong> HWRFX and <strong>the</strong> operational<br />
version <strong>of</strong> <strong>the</strong> HWRF system, now dubbed as "HWRFV3.2" is under development. The 2012<br />
operational upgrade will potentially include a triply nested system operating at a scale <strong>of</strong> about 3<br />
km and is expected to provide improvements to structure and intensity predictions. We will<br />
provide a status report on this system.<br />
Session 7 – Page 3
Progress Towards a High-Resolution HWRF Model<br />
Sam Trahan 1 , Vijay Tallapragada 1 , S.G.Gopal 2 , Xuejin Zhang 2<br />
(Samuel.Trahan@noaa.gov)<br />
1 NOAA NCEP EMC<br />
2 NOAA AOML HRD<br />
This presentation gives an overview <strong>of</strong> <strong>the</strong> joint NOAA EMC-HRD research towards developing<br />
a triple nested high-resolution hurricane forecasting system based on <strong>the</strong> EMC HWRF with<br />
upgrades from <strong>the</strong> experimental HRD HWRF-X and elsewhere. We show improvements in <strong>the</strong><br />
representation <strong>of</strong> hurricane structure as a result <strong>of</strong> <strong>the</strong> higher resolution. We detail computational<br />
efficiency experiments that will eventually lead to operational implementation. We also<br />
overview upcoming work on improving <strong>the</strong> physics, initialization, ocean coupling and o<strong>the</strong>r<br />
model aspects to take advantage <strong>of</strong> <strong>the</strong> higher atmospheric model resolution and realize<br />
improved hurricane intensity and structure prediction.<br />
Session 7 – Page 4
Evaluation and Improvements <strong>of</strong> Cloud and Precipitation Physics in<br />
<strong>the</strong> Operational Hurricane WRF Model at NOAA/EMC<br />
Yuqing Wang<br />
(yuqing@hawaii.edu)<br />
International Pacific Research Center and Department <strong>of</strong> Meteorology, University <strong>of</strong> Hawaii at<br />
Manoa<br />
The overall goal <strong>of</strong> this project is to evaluate and improve <strong>the</strong> cloud and precipitation<br />
physics used in <strong>the</strong> operational Hurricane Wea<strong>the</strong>r Research and Forecasting (HWRF) model<br />
developed in <strong>the</strong> Environmental Modeling Center (EMC) at <strong>the</strong> National Centers for<br />
Environmental Prediction (NCEP) <strong>of</strong> NOAA, achieving improved prediction <strong>of</strong> hurricane<br />
structure and intensity, including <strong>the</strong> size, by <strong>the</strong> HWRF model at NCEP/EMC. As <strong>the</strong> first step,<br />
we have implemented <strong>the</strong> current cloud microphysics scheme and convective parameterization<br />
scheme used in <strong>the</strong> HWRF model into TCM4 and compared <strong>the</strong> structure, intensity, and diabatic<br />
heating <strong>of</strong> <strong>the</strong> HWRF model cloud microphysics scheme with that used in TCM4. We have<br />
examined <strong>the</strong> possible effect <strong>of</strong> cumulus convective parameterization scheme in coarse model<br />
domains on <strong>the</strong> fine-resolution explicit simulations <strong>of</strong> hurricanes in TCM4. These comparisons<br />
have helped us identify <strong>the</strong> potential discrepancies <strong>of</strong> <strong>the</strong> current cloud and precipitation physics<br />
used in <strong>the</strong> HWRF model and provide <strong>the</strong> basis for our improvements <strong>of</strong> <strong>the</strong> HWRF cloud and<br />
precipitation physics.<br />
We have also examined <strong>the</strong> possible discrepancies in <strong>the</strong> dynamical core <strong>of</strong> <strong>the</strong> HWRF<br />
model in comparison with <strong>the</strong> simulation using <strong>the</strong> WRF_ARW dynamical core with <strong>the</strong> same<br />
model physics options. It is our purpose to see whe<strong>the</strong>r biases in <strong>the</strong> prediction <strong>of</strong> hurricane size<br />
and intensity by HWRF are related to <strong>the</strong> dynamical core. Hurricane Katrina (2005) was selected<br />
in <strong>the</strong> comparison. Our results show that although <strong>the</strong> NMM dynamical core simulated weaker<br />
hurricane intensity, it simulated <strong>the</strong> track considerably better in terms <strong>of</strong> <strong>the</strong> timing and location<br />
<strong>of</strong> landfall than <strong>the</strong> ARW dynamical core for this case. This indicates that <strong>the</strong> NMM dynamical<br />
core might capture <strong>the</strong> evolution <strong>of</strong> <strong>the</strong> large-scale environmental flow, which is <strong>the</strong> key to <strong>the</strong><br />
accurate prediction <strong>of</strong> storm motion. However, <strong>the</strong> storm intensity is largely controlled by <strong>the</strong><br />
inner core dynamics, which was not well represented by <strong>the</strong> numerical scheme in <strong>the</strong> NMM<br />
dynamical core. The difference in <strong>the</strong> vertical structure <strong>of</strong> <strong>the</strong> simulated storm suggests that some<br />
discrepancies between <strong>the</strong> simulations with different dynamical cores might be related to <strong>the</strong><br />
difference in <strong>the</strong> vertical descretization. We also found that <strong>the</strong> dynamical core may affect <strong>the</strong><br />
cloud microphysics to some degree. We also found that <strong>the</strong> dynamical core may affect <strong>the</strong> cloud<br />
microphysics to some degree. We thus suggest that a systematic diagnostics <strong>of</strong> <strong>the</strong> dynamical<br />
core <strong>of</strong> <strong>the</strong> NMM is required in order to improve <strong>the</strong> prediction <strong>of</strong> storm intensity and structure<br />
by HWRF.<br />
Session 7 – Page 5
Controlling Factors <strong>of</strong> <strong>the</strong> Radius <strong>of</strong> Maximum Winds in HWRF<br />
Jian-Wen Bao, Sara A. Michelson, Sundararaman G. Gopalakrishnan<br />
(Jian-Wen.Bao@noaa.gov)<br />
NOAA/ESRL and NOAA/AMOL<br />
This presentation highlights major results from a series <strong>of</strong> numerical experiments with<br />
NOAA’s Hurricane WRF (HWRF) model. The purpose <strong>of</strong> <strong>the</strong> experiments is to investigate <strong>the</strong><br />
sensitivity <strong>of</strong> <strong>the</strong> radius <strong>of</strong> maximum winds <strong>of</strong> an idealized tropical storm to <strong>the</strong> model’s internal<br />
controlling factors (such as <strong>the</strong> size <strong>of</strong> <strong>the</strong> initial vortex, cloud physics and vertical diffusion) and<br />
external conditions (such as <strong>the</strong> latitude-dependent Coriolis parameter). The model is initialized<br />
with a weak axisymmetric vortex disturbance in an idealized tropical environment that is<br />
favorable for <strong>the</strong> vortex disturbance to develop into a hurricane. The initial mass and wind fields<br />
associated with <strong>the</strong> weak vortex disturbance are obtained by solving <strong>the</strong> nonlinear balance<br />
equation for <strong>the</strong> given wind distributions <strong>of</strong> <strong>the</strong> initial vortex, and <strong>the</strong> prescribed background<br />
<strong>the</strong>rmal sounding and winds. Results from <strong>the</strong> idealized HWRF sensitivity runs are compared in<br />
terms <strong>of</strong> <strong>the</strong> radius <strong>of</strong> maximum winds along with <strong>the</strong> azimuthally averaged storm structure and<br />
<strong>the</strong> surface wind-pressure relationships, to gain an insight into how to improve <strong>the</strong> model.<br />
Session 7 – Page 6
Tropical Cyclone Inner-core Diagnostics<br />
Robert Rogers 1 , Paul Reasor 1 , S. Lorsolo 2 , and J. Zhang 2<br />
(Robert.Rogers@noaa.gov)<br />
1 NOAA/AOML Hurricane Research Division, Miami, FL<br />
2 CIMAS, University <strong>of</strong> Miami, Miami, FL<br />
Much work has gone toward evaluating <strong>the</strong> performance <strong>of</strong> numerical models using<br />
“traditional” metrics, e.g., position and intensity errors. As operational horizontal grid lengths<br />
approach 3 km (and eventually reach 1 km), <strong>the</strong> ability to represent many features within <strong>the</strong><br />
inner core <strong>of</strong> tropical cyclones (TCs) increases. Robust evaluations <strong>of</strong> TC inner-core structure<br />
are <strong>the</strong>refore crucial to assess <strong>the</strong> realism <strong>of</strong> numerical simulations. A wealth <strong>of</strong> TC inner-core<br />
data collected and archived at <strong>the</strong> NOAA Hurricane Research Division (HRD) over many years<br />
provides an excellent opportunity for evaluating high-resolution numerical models.<br />
In this talk composites from observations (airborne Doppler and dropsondes) and<br />
simulations <strong>of</strong> multiple storms will be compared. These composites are key to providing<br />
statistically robust measures and evaluations <strong>of</strong> numerical models. The focus here is on several<br />
scales within <strong>the</strong> TC inner core – symmetric and asymmetric vortex-scale properties, convectivescale<br />
statistics, and boundary-layer structure.<br />
Session 7 – Page 7
On <strong>the</strong> Characteristic Height Scales <strong>of</strong> <strong>the</strong> Hurricane Boundary Layer: Dropsonde<br />
Composite Analysis for <strong>the</strong> Purpose <strong>of</strong> Model Diagnostics<br />
Jun Zhang 1 Robert Rogers 2 , David Nolan 3 , Frank Marks 2<br />
(Jun.Zhang@noaa.gov)<br />
1 UM/CIMAS & NOAA/HRD, 2 (NOAA/HRD), 3 UM/RSMAS<br />
In this talk, we present composite analysis results using hundreds <strong>of</strong> GPS dropsonde data from<br />
13 hurricanes. We focus on <strong>the</strong> investigation <strong>of</strong> <strong>the</strong> characteristic height scales <strong>of</strong> <strong>the</strong> hurricane<br />
boundary layer. The height scales are defined in a variety <strong>of</strong> ways: <strong>the</strong> height <strong>of</strong> <strong>the</strong> maximum<br />
total wind speed, <strong>the</strong> inflow layer depth, and <strong>the</strong> mixed layer depth. The height <strong>of</strong> <strong>the</strong> maximum<br />
wind speed and <strong>the</strong> inflow layer depth are referred to as <strong>the</strong> dynamical boundary layer heights,<br />
while <strong>the</strong> mixed layer depth is referred to as <strong>the</strong> <strong>the</strong>rmodynamical boundary layer height. The<br />
data analyses show that <strong>the</strong>re is a clear separation <strong>of</strong> <strong>the</strong> <strong>the</strong>rmodynamical and dynamical<br />
boundary layer heights. Consistent with previous studies on <strong>the</strong> boundary layer structure in<br />
individual storms, <strong>the</strong> dynamical boundary layer height is found to decrease with decreasing<br />
radius to <strong>the</strong> storm center. The <strong>the</strong>rmodynamic boundary layer height, which is much shallower<br />
than <strong>the</strong> dynamical boundary layer height, is also found to decrease with decreasing radius to <strong>the</strong><br />
storm center. The results also suggest that using <strong>the</strong> traditional critical Richardson number<br />
method to determine <strong>the</strong> boundary layer height may not accurately reproduce <strong>the</strong> height scale <strong>of</strong><br />
<strong>the</strong> hurricane boundary layer. These different height scales reveal <strong>the</strong> complexity <strong>of</strong> <strong>the</strong> hurricane<br />
boundary layer structure that should be captured in hurricane model simulations. Methodology<br />
and preliminary results <strong>of</strong> using <strong>the</strong> dropsonde composites to evaluate <strong>the</strong> PBL scheme used in<br />
<strong>the</strong> Hurricane Wea<strong>the</strong>r Research and Forecast (HWRF) model are discussed.<br />
Session 7 – Page 8
S<br />
E<br />
S<br />
Session 9<br />
ITOP/TCS-10: Coupled<br />
Air-Sea Observations and<br />
TC Predictions<br />
S<br />
I<br />
O<br />
N<br />
9
Overview <strong>of</strong> <strong>the</strong> ITOP / TCS10 <strong>Program</strong>: Impact <strong>of</strong> Typhoons on <strong>the</strong> Pacific<br />
Eric A. D’Asaro<br />
(dasaro@apl.washington.edu)<br />
Applied Physics Laboratory and School <strong>of</strong> Oceanography, University <strong>of</strong> Washington, Seattle<br />
The Impacts <strong>of</strong> Typhoons on <strong>the</strong> Ocean in <strong>the</strong> Pacific (ITOP) program was a multinational<br />
field campaign that aimed to study typhoons and <strong>the</strong> ocean response to typhoons in <strong>the</strong><br />
western Pacific Ocean. ITOP focused on understanding how <strong>the</strong> cold wake <strong>of</strong> a typhoon forms<br />
and dissipates, <strong>the</strong> air-sea fluxes for winds greater than 30 m/s, <strong>the</strong> impact <strong>of</strong> ocean eddies on<br />
typhoons and <strong>the</strong> physical and biogeochemical ocean response to typhoons, <strong>the</strong> surface wave<br />
field under typhoons, and typhoon genesis and forecasting.<br />
An array <strong>of</strong> 10 ocean moorings, including detailed air-sea flux instrumentation, was<br />
deployed from July to October, 2010. Two C-130J aircraft <strong>of</strong> <strong>the</strong> Air Force Reserve 53 rd WRS<br />
operated from Guam from Aug. 20 to Oct. 20, 2010, working in cooperation with <strong>the</strong> Taiwanese<br />
DOTSTAR program. They conducted storm reconnaissance, deploying ~700 dropsondes and<br />
~850 AXBTs in <strong>the</strong> vicinity <strong>of</strong> typhoons and deployed 89 oceanographic drifters and floats<br />
ahead <strong>of</strong> typhoons and into <strong>the</strong>ir wakes. US and Taiwanese research vessels made measurements<br />
in <strong>the</strong> wake <strong>of</strong> typhoons making ~3500 CTD pr<strong>of</strong>iles and deploying 10 long-term autonomous<br />
gliders. Operations were directed from a control center at <strong>the</strong> Naval Postgraduate School.<br />
ITOP sampled <strong>the</strong> structure <strong>of</strong> and ocean response to 3 typhoons: Fanapi, Malakas and<br />
supertyphoon Megi, one <strong>of</strong> <strong>the</strong> strongest typhoons every measured (885 mbar). Detailed<br />
measurements <strong>of</strong> <strong>the</strong> air-sea fluxes were obtained in Fanapi and Megi. The ocean response to<br />
typhoons was complicated by strong internal tides in this region. All three typhoons made strong<br />
cold wakes. Megi’s wake was very narrow, 20 km across, reflecting <strong>the</strong> small size <strong>of</strong> <strong>the</strong> storm,<br />
while Malakas’ ranged from 100-250 km. The evolution <strong>of</strong> Fanapi’s wake was followed for a<br />
month. The surface signature <strong>of</strong> <strong>the</strong> wake rapidly diminished due to surface warming, but a thick<br />
cold subsurface component lasted for at least 3 weeks and was advected around a cyclonic eddy.<br />
ITOP was supported by <strong>the</strong> <strong>Office</strong> <strong>of</strong> Naval Research and <strong>the</strong> Taiwan National Science Council.<br />
Session 9 – Page 1
Multi-scale Observations <strong>of</strong> Cloud Clusters and Tropical Cyclones in ITOP/TCS10<br />
Shuyi S. Chen, B. Kerns, E. Ryan, and C. Lee<br />
(schen@rsmas.miami.edu)<br />
RSMAS/University <strong>of</strong> Miami<br />
The goal <strong>of</strong> <strong>the</strong> Impact <strong>of</strong> Typhoon on Ocean over <strong>the</strong> Pacific (ITOP) and Tropical Cyclone<br />
Structure 2010 (TCS10) is to better understand and predict TC formation and intensity change<br />
through a comprehensive observation <strong>of</strong> TC structure and its oceanic and atmospheric<br />
environment over a broad spatial and time scales. An objective cloud-cluster tracking method is<br />
used to identify <strong>the</strong> TC precursor clusters using hourly satellite IR images over <strong>the</strong> entire West-<br />
Central Pacific basin. By tracking all cloud clusters, we are able to objectively determine both<br />
developing and non-developing TCs, which have been a one <strong>of</strong> <strong>the</strong> most difficult problem in<br />
understanding <strong>of</strong> formation (genesis) <strong>of</strong> TCs in <strong>the</strong> past, especially <strong>the</strong> lack <strong>of</strong> objective method<br />
for determining non-developing TCs. Comparing with results from previous years (2003-2009),<br />
2010 consists <strong>of</strong> more long-lived cloud clusters that do not develop into TCs, even though some<br />
apparent large-scale conditions such as warm SST and synoptic wave-like disturbances are<br />
abundant. Composite <strong>of</strong> <strong>the</strong> environmental conditions for developing vs. non-developing cases<br />
using <strong>the</strong> global analysis fields and in situ airborne dropsonde and AXBT data are used to<br />
quantify <strong>the</strong> mesoscale and large-scale “forcing” for TCs. The ITOP/TCS10 field experiments<br />
were designed to follow <strong>the</strong> developing TC throughout <strong>the</strong>ir lifecycle with extensive<br />
observations <strong>of</strong> pre-, during- and post-TC oceanic and atmospheric conditions. More than 800<br />
GPS dropsondes and 1000 AXBTs/AXCTs as well as drifters and floats were deployed in TCs<br />
from August-October 2010, including Typhoon Fanapei and Supertyphoon Megi. Some<br />
preliminary analysis and implication for coupled TC prediction model development and<br />
verification will be discussed. Fur<strong>the</strong>rmore, a comparison <strong>of</strong> TC activities between <strong>the</strong> western<br />
Pacific and Altantic basins using <strong>the</strong> cloud-cluster tracking analysis will be presented.<br />
Session 9 – Page 2
The Challenge <strong>of</strong> Measuring <strong>the</strong> Atmosphere-Ocean Interface in Tropical Cyclones:<br />
Observations from Air-Deployed Drifters<br />
Jan Morzel 1 , Luca Centurioni 2 , P.P Niiler 2<br />
(jan@rosettaconsult.com)<br />
1 Rosetta Consulting; 2 Scripps Institution <strong>of</strong> Oceanography<br />
Since 2003, air-deployed drifters have been used to make measurements <strong>of</strong> upper ocean<br />
temperature, surface currents, atmospheric pressure, wind velocity, and, more recently, <strong>of</strong><br />
subsurface ocean currents and solar radiation, within tropical cyclones and in <strong>the</strong>ir cold wakes.<br />
The co-ordination <strong>of</strong> multiple projects sponsored by <strong>the</strong> <strong>Office</strong> <strong>of</strong> Naval Research and by NOAA<br />
has led to <strong>the</strong> accumulation <strong>of</strong> a dataset that includes drifter observations <strong>of</strong> six hurricanes and<br />
four typhoons, covering <strong>the</strong> Cat 1 through Cat 5 range. The air-deployment success rate <strong>of</strong> <strong>the</strong><br />
drifters is 93%.<br />
Drifters are typically air-deployed along a 400 km line, 18 to 24 hours ahead <strong>of</strong> <strong>the</strong> tropical<br />
storm. The spatial separation <strong>of</strong> <strong>the</strong> drifter array ranges from 30 to 50 km. Atmospheric pressure,<br />
sea surface temperature and surface winds are measured every 15 min. The data are transmitted<br />
in real-time through <strong>the</strong> Argos and Iridium satellite systems and are routinely placed on <strong>the</strong><br />
Global Telecommunication System.<br />
We focus on oceanic and atmospheric observations obtained during typhoon Fanapi in<br />
September 2010 during <strong>the</strong> ITOP/TCS10 field project in <strong>the</strong> Western Pacific. We discuss wind<br />
and atmospheric pressure measurements obtained with a new meteorological package, as well as<br />
upper ocean temperature changes. The preliminary results show that on 09-18-2010 between<br />
0030Z and 0400Z Fanapi’s minimum recorded pressure was 940 mbar and it left a cold wake<br />
approximately 150 to 200 km wide with a maximum surface cooling <strong>of</strong> 2.5 °C<br />
The first order challenge for forecasting and warning centers consists <strong>of</strong> accurately predicting<br />
intensity changes <strong>of</strong> tropical cyclones. Providing quality measurements <strong>of</strong> <strong>the</strong> upper ocean<br />
<strong>the</strong>rmal structure is <strong>the</strong>refore crucial. The comprehensive drifter dataset represents an<br />
opportunity to improve data assimilation, to initialize forecast models and to validate research<br />
and operational models.<br />
Session 9 – Page 3
Pre-Genesis Monitoring <strong>of</strong> <strong>the</strong> 3-D Atmospheric and Oceanic Environment Via High<br />
Altitude Aircraft Observations<br />
Jeff Hawkins 1 , Peter Black 2 , Pat Harr 3 , Russ Elsberry 3<br />
(Jeffrey.Hawkins@nrlmry.navy.mil)<br />
1 Naval Research Laboratory; 2 Science Applications International Inc;<br />
3 Naval Postgraduate School<br />
The Tropical Cyclone Structure (TCS-08) and <strong>the</strong> Impact <strong>of</strong> Typhoons on <strong>the</strong> Ocean in <strong>the</strong><br />
Pacific (ITOP) field programs enabled <strong>the</strong> first two tests <strong>of</strong> high altitude (300 MB) deployment<br />
<strong>of</strong> dropsondes and AXBTs into pre-genesis, incipient tropical cyclone (TC) systems within <strong>the</strong><br />
western North Pacific basin (WPAC). This sampling strategy enabled a unique view <strong>of</strong> <strong>the</strong> three<br />
dimensional (3-D) atmospheric (winds, temperature and moisture) and oceanic <strong>the</strong>rmal<br />
environments. Data sets from both developing and non-developing tropical systems were intercompared<br />
through <strong>the</strong> use <strong>of</strong> <strong>the</strong> Air Force WC-130J data sets, which include dropsondes,<br />
Stepped Frequency Microwave Radiometer (SFMR), airborne radar, and flight level parameters,<br />
MTSAT-derived automated cloud motion winds, NRL P-3 Eldora 3-D winds (TCS-08), and<br />
satellite-derived ocean surface wind vectors (QuikSCAT – TCS-08 only, ASCAT, and WindSat).<br />
Aircraft flights were designed to overlap with satellite over-pass times as close as possible. In<br />
addition, satellite-derived total precipitable water (TPW), a measure <strong>of</strong> low/mid-level moisture<br />
content which maps mesoscale and synoptic scale features, was utilized to observe <strong>the</strong> potential<br />
<strong>of</strong> dry- and moist-air entrainment into <strong>the</strong> inner vortex. This combination <strong>of</strong> sensors allowed <strong>the</strong><br />
aircraft-derived observations to validate satellite-derived observations <strong>of</strong> ocean surface and midlevel<br />
winds as well as sea surface temperature (SST) and subsurface ocean heat content (OHC).<br />
During August 2008, TCS-08 candidate systems included many weak convective clusters as <strong>the</strong><br />
western Pacific basin experienced an unusual ‘TC drought’ and an anomalous circulation pattern.<br />
Organized convective activity was suppressed and <strong>the</strong> monsoon trough was absent as low-level<br />
easterly flow predominated. Several wave-like systems entered <strong>the</strong> TCS-08 Guam domain from<br />
<strong>the</strong> east and were investigated by <strong>the</strong> WC-130J and NRL P-3 aircraft. ITOP conditions during<br />
2010 included additional pre-genesis cases near Guam <strong>of</strong> several systems that later evolved into<br />
significant TCs.<br />
Passive microwave imagers were able to augment <strong>the</strong> TCS-08 and ITOP aircraft data sets by<br />
mapping <strong>the</strong> rainfall and convective cloud cluster patterns during many daily overpasses. The<br />
combination <strong>of</strong> both operational and research microwave satellite sensors (SSM/I, SSMIS, TMI,<br />
AMSR-E, and WindSat) provided frequent temporal observations <strong>of</strong> convective system<br />
evolution. The temporal sampling from <strong>the</strong> microwave imagers provided <strong>the</strong> large-scale context<br />
in mapping convective organization <strong>of</strong> <strong>the</strong> three tropical systems using WC-130J recorded radar<br />
video and NRL P3 Eldora Doppler radar data (TCS-08), but does not provide <strong>the</strong> 3-D structure,<br />
nor spatial details needed to appropriately understand <strong>the</strong> full 3-D storm environment.<br />
Preliminary analysis <strong>of</strong> <strong>the</strong> WC-130J dropsondes, AXBTs, and satellite digital data sets indicate<br />
complicated 3-D atmospheric and oceanic structures can be monitored by <strong>the</strong> high altitude WC-<br />
130J dropsonde square spiral flight patterns and effectively detail critical differences between<br />
Session 9 – Page 4
low, mid and upper-level wind, temperature and moisture variables as <strong>the</strong> genesis system<br />
struggles within <strong>the</strong> sometimes very harsh environmental conditions. Important information<br />
pertaining to wind shear and possible decoupling between <strong>the</strong> low and mid level vortex and <strong>the</strong><br />
extent <strong>of</strong> dry air intruding into or near <strong>the</strong> system’s inner core can only be accurately obtained<br />
via <strong>the</strong>se high altitude 3-D dropsonde measurements that systematically cover <strong>the</strong> entire storm<br />
grid and not just <strong>the</strong> periphery as currently accomplished within some NOAA G-IV flights.<br />
These 3-D atmospheric data sets have <strong>the</strong> potential to also initialize and help validate multiple<br />
ongoing TC mesoscale numerical wea<strong>the</strong>r prediction (NWP) forecast model diagnoses and<br />
forecast efforts as <strong>the</strong> community attempts to improve predictions <strong>of</strong> genesis, track, and intensity.<br />
In addition, <strong>the</strong> AXBT data has provided <strong>the</strong> means to effectively map <strong>the</strong> oceanic <strong>the</strong>rmal front<br />
and eddy field and help us factor in OHC impacts on storm intensification and decay, not<br />
o<strong>the</strong>rwise accounted for in previous WPAC studies.<br />
Session 9 – Page 5
Ocean observations in developing and mature TC’s based on a new airborne observing<br />
strategy: 'Combo' deployments <strong>of</strong> AXBT’s and GPS dropsondes from long-endurance,<br />
multi-altitude reconnaissance flights<br />
P. G. Black 1 and J. D. Hawkins 2<br />
(peter.black.ctr@nrlmry.navy.mil)<br />
1 Science Applications International Corporation/Naval Research Laboratory; 2 Naval Research<br />
Laboratory<br />
The first ‘combo’ deployment <strong>of</strong> AXBTs and dropsondes into pre-genesis, and mature tropical<br />
cyclones (TC’s) within <strong>the</strong> Western North Pacific (WPAC) basin was conducted during <strong>the</strong><br />
TPARC-Tropical Cyclone Structure (TPARC/TCS-08) field program. This strategy was repeated<br />
again during <strong>the</strong> Interaction <strong>of</strong> Typhoons over <strong>the</strong> Pacific experiment (ITOP/TCS10) in 2010.<br />
This sampling strategy enabled a unique view <strong>of</strong> <strong>the</strong> three- dimensional (3-D) oceanic <strong>the</strong>rmal<br />
and atmospheric environments in evolving tropical systems to be obtained. Coupled with <strong>the</strong><br />
low-level ocean buoy/float deployment capability <strong>of</strong> <strong>the</strong> AFRC WC-130J aircraft, its longendurance<br />
in excess <strong>of</strong> 12-hours and high-altitude capabilities (300 mb) demonstrates a new era<br />
in TC operational ocean feature observation capabilities for initialization and validation <strong>of</strong> new<br />
coupled air-sea TC models such as <strong>the</strong> NRL coupled COAMPS-TC model, brought on line for<br />
<strong>the</strong> first time during ITOP/TCS10.<br />
Preliminary analysis <strong>of</strong> <strong>the</strong> TPARC and ITOP WC-130J AXBT data indicated that three <strong>of</strong> four<br />
systems that developed into typhoons in 2008 and two <strong>of</strong> three systems in 2010 developed within<br />
<strong>the</strong> WPAC oceanic region referred to as <strong>the</strong> ‘Sou<strong>the</strong>rn Eddy Zone' between 16-24 N. In<br />
TPARC/TCS08, AXBT data for one case (Jangmi) showed rapid intensification (RI) over a<br />
warm eddy and subsequent rapid decay (RD) over a cold eddy while during ITOP/TCS10,<br />
ano<strong>the</strong>r case (Fanapi) showed rapid development over a warm eddy. While underlying ocean<br />
conditions seemed not to be a factor in TC formation, or lack <strong>the</strong>re<strong>of</strong>, subsequent development<br />
did appear to depend on subsurface ocean eddy conditions, a result that makes monitoring <strong>the</strong>se<br />
ocean conditions for coupled model use an important new consideration in TC observational<br />
requirements.<br />
We suggest that this sampling strategy may prove effective in meeting emerging observational<br />
requirements for model initialization and validation in <strong>the</strong> Atlantic Basin as <strong>the</strong> use <strong>of</strong> coupled<br />
TC prediction models grows. This strategy <strong>of</strong> flying high in weak systems ra<strong>the</strong>r than flying low<br />
looking for closed circulations takes advantage <strong>of</strong> <strong>the</strong> high altitude and long range capability <strong>of</strong><br />
<strong>the</strong> WC-130J aircraft and provides <strong>the</strong> ability to simultaneously map vertical atmospheric<br />
structure searching for signatures <strong>of</strong> mid-level as well as low-level spin-up at <strong>the</strong> earliest possible<br />
time while also mapping <strong>the</strong> surface wind field through use <strong>of</strong> <strong>the</strong> new Stepped Frequency<br />
Microwave Radiometer (SFMR), also flown on <strong>the</strong> WC-130J aircraft. Fur<strong>the</strong>rmore, simultaneous<br />
ocean vertical structure pr<strong>of</strong>iles reveal signatures <strong>of</strong> ocean eddies that may impact TC<br />
development and subsequent intensification. This type <strong>of</strong> strategy, especially in concert with G-<br />
IV surveillance flights in <strong>the</strong> storm environment would bring a powerful new set <strong>of</strong> observations<br />
into play that could be ideal not only for coupled model initialization and validation but for<br />
forecaster diagnostics for subsequent TC intensification or decay.<br />
Session 9 – Page 6
An overview <strong>of</strong> COAMPS-TC Forecasts and Targeting for ITOP<br />
Sue Chen, James Doyle, Richard Hodur, Hao Jin, James Cummings, and Jerome Schmidt<br />
(Sue.Chen@nrlmry.navy.mil)<br />
Naval Research Laboratory<br />
An unprecedented typhoon field campaign that combined state-<strong>of</strong>-<strong>the</strong>-art observations in <strong>the</strong><br />
atmosphere and ocean (“Tropical Cyclone Structure (TCS)-10” /“Impact <strong>of</strong> Typhoons on <strong>the</strong><br />
Ocean in <strong>the</strong> Pacific (ITOP)”) was conducted in <strong>the</strong> Western Pacific during <strong>the</strong> summer <strong>of</strong> 2010.<br />
Four different configurations <strong>of</strong> <strong>the</strong> Coupled Ocean/Atmosphere Mesoscale Prediction System-<br />
Tropical Cyclone (COAMPS-TC) were used to provide typhoon genesis, track, and intensity<br />
forecasts in real-time for TCS-10/ITOP. These COAMPS-TC configurations were (a) a fixeddomain<br />
(27 and 9 km nested grids) two-way air-sea coupled COAMPS-TC area (INVEST), (b)<br />
an atmosphere-only version <strong>of</strong> COAMPS-TC using a triply-nested grid down to 5 km that<br />
automatically moved with <strong>the</strong> tropical cyclone, (c) <strong>the</strong> atmosphere-ocean coupled COAMPS-TC<br />
system that used <strong>the</strong> same nested grids for <strong>the</strong> atmosphere as in (c), and (d) <strong>the</strong> COAMPS-TC<br />
atmospheric adjoint model coupled with a simple ocean mixed layer (ADJOINT),. The<br />
ADJOINT configuration was used to assist in determining where targeted observations could be<br />
employed in both <strong>the</strong> atmosphere and <strong>the</strong> ocean, while <strong>the</strong> INVEST configuration was used for<br />
daily assessments <strong>of</strong> typhoon genesis potential. The atmosphere-only and <strong>the</strong> coupled<br />
COAMPS-TC configurations were used to provide forecast track and intensity information, and<br />
were only activated when a typhoon warning message was issued by <strong>the</strong> Joint Typhoon Forecast<br />
Center. The major findings and results from <strong>the</strong>se four COAMPS-TC forecast exercises include:<br />
(i) <strong>the</strong> INVEST configuration provided a three-day warning lead time for <strong>the</strong> genesis location <strong>of</strong><br />
typhoon Fanapi; (ii) continuous assimilation <strong>of</strong> <strong>the</strong> ocean observations in <strong>the</strong> INVEST runs<br />
reduced <strong>the</strong> ocean model sea surface temperature bias which, in turn, improved <strong>the</strong> ocean forcing<br />
to <strong>the</strong> atmospheric model; (iii) upgraded microphysical and radiation processes improved <strong>the</strong><br />
surface radiative forcing for <strong>the</strong> ocean model; and (iv) <strong>the</strong> seasonal-averaged (8 typhoons)<br />
intensity error was larger in <strong>the</strong> coupled COAMPS-TC forecasts than in <strong>the</strong> uncoupled<br />
COAMPS-TC forecasts, but <strong>the</strong> coupled COAMPS-TC exhibited a slightly smaller cross-track<br />
bias than <strong>the</strong> uncoupled COAMPS-TC in <strong>the</strong> 48-96 hour forecast period; and (v) <strong>the</strong> ADJOINT<br />
exhibits complex patterns <strong>of</strong> sensitivity to ocean-mixed layer depth for storms reaching typhoon<br />
strength along with large sensitivity to <strong>the</strong> low-level atmospheric moisture near typhoon Megi.<br />
More detailed discussions on <strong>the</strong> use, forecast performance, and lessons learned from our<br />
applications <strong>of</strong> <strong>the</strong> ADJOINT, INVEST, and <strong>the</strong> uncoupled and coupled COAMPS-TC<br />
configurations for eight typhoons during <strong>the</strong> 2010 season will be presented.<br />
Session 9 – Page 7
Multi-Model Coupled Air-Sea Forecasts <strong>of</strong> Typhoons during ITOP<br />
Brandon Kerns, Shuyi S. Chen, and Chiaying Lee<br />
(bkerns@rsmas.miami.edu)<br />
RSMAS/University <strong>of</strong> Miami<br />
In support <strong>of</strong> <strong>the</strong> Impact <strong>of</strong> Typhoons on <strong>the</strong> Ocean in <strong>the</strong> Pacific (ITOP) experiment,<br />
high-resolution coupled models were run in a semi-operational setting in real time at <strong>the</strong><br />
University <strong>of</strong> Miami Rosenstiel School <strong>of</strong> Marine and Atmospheric Science (RSMAS) during <strong>the</strong><br />
ITOP dry run from Sep-Oct 2009 and field phase from August-October 2010. The highresolution<br />
models include <strong>the</strong> University <strong>of</strong> Miami Coupled Model (UMCM) and <strong>the</strong> coupled<br />
WRF (CWRF) with triply nested grids <strong>of</strong> 12, 4, and 1.3-km grid spacing. The coupled models<br />
include <strong>the</strong> fully coupled atmospheric, ocean and wave model components. A multi-model, highresolution<br />
prediction system used in ITOP consists <strong>of</strong> UMCM and CWRF that are run with<br />
various initial and boundary conditions from several operational global models including GFS,<br />
ECMWF, NOGAPS, JMA, and HYCOM. The coupled models provide not only <strong>the</strong> storm track,<br />
intensity and structure forecasts, but also <strong>the</strong> surface waves and ocean temperature and current<br />
fields in typhoons. The air-sea coupled forecasts were used in near real time to aid <strong>the</strong><br />
deployment <strong>of</strong> <strong>the</strong> ITOP atmospheric and oceanic instrumentation from <strong>the</strong> C-130 aircraft and<br />
ships. Preliminary results from <strong>the</strong> coupled model forecasts and verification statistics from eight<br />
typhoons will be presented at <strong>IHC</strong>. Implications and potential applications for hurricane<br />
reconnaissance and prediction in <strong>the</strong> Atlantic will be discussed.<br />
Session 9 – Page 8
S<br />
E<br />
Session 10<br />
O<strong>the</strong>r Research to<br />
Improve <strong>the</strong> Prediction <strong>of</strong><br />
Tropical Cyclone Intensity<br />
and Structure, Track,<br />
Precipitation, and Inland<br />
Inundation,<br />
Part 1<br />
S<br />
S<br />
I<br />
O<br />
N<br />
10
Hurricane and Severe Storm Sentinel (HS3): A Multi-year Investigation <strong>of</strong> Atlantic<br />
Hurricanes<br />
Scott A. Braun 1 , Paul A. Newman 1 , Marilyn Vasques 2<br />
(scott.a.braun@nasa.gov)<br />
1 NASA/GSFC; , 2 NASA/ARC<br />
HS3 is a five-year mission specifically targeted to enhance our understanding <strong>of</strong> <strong>the</strong> processes<br />
that underlie hurricane intensity change in <strong>the</strong> Atlantic Ocean basin. The HS3 science questions<br />
can be distilled down to <strong>the</strong> extent to which ei<strong>the</strong>r <strong>the</strong> environment or processes internal to <strong>the</strong><br />
storm are key to intensity change. Is storm formation and intensification mainly a result <strong>of</strong><br />
characteristics <strong>of</strong> <strong>the</strong> large-scale environment or internal processes? Are <strong>the</strong>se internal processes<br />
driven by large-scale forcing or do <strong>the</strong>y act independently <strong>of</strong> this forcing?<br />
The HS3 objectives are:<br />
• To obtain critical measurements in <strong>the</strong> hurricane environment in order to identify <strong>the</strong> role <strong>of</strong><br />
key factors such as large-scale wind systems (troughs, jet streams), Saharan air masses, African<br />
Easterly Waves and <strong>the</strong>ir embedded critical layers (that help to isolate tropical disturbances from<br />
hostile environments).<br />
• To observe and understand <strong>the</strong> three-dimensional mesoscale and convective-scale internal<br />
structures <strong>of</strong> tropical disturbances and cyclones and <strong>the</strong>ir role in intensity change.<br />
The mission objectives will be achieved using two Global Hawk (GH) Unmanned Airborne<br />
Systems (UASs) with separate comprehensive environmental and over-storm payloads. The GH<br />
flight altitudes (>16.8 km) allow overflights <strong>of</strong> most convection and sampling <strong>of</strong> uppertropospheric<br />
winds. Deployments from Goddard’s Wallops Flight Facility and 30-hour flight<br />
durations will provide coverage <strong>of</strong> <strong>the</strong> entire Atlantic Ocean basin, and on-station times up to 10-<br />
24 h depending on storm location. Deployments will be in September <strong>of</strong> 2012 and from mid-<br />
August to mid-September 2013-2014, with ten 30-h flights per deployment.<br />
HS3’s suite <strong>of</strong> advanced instruments will measure key characteristics <strong>of</strong> <strong>the</strong> storm<br />
environment and its internal structures. The measurements include:<br />
Measurements from <strong>the</strong> Environmental GH Payload<br />
• Continuous sampling <strong>of</strong> temperature and relative humidity in <strong>the</strong> clear-air<br />
environment from <strong>the</strong> scanning High-resolution Interferometer Sounder (S-HIS).<br />
• Continuous wind pr<strong>of</strong>iles in clear air from <strong>the</strong> TWiLiTE instrument. TWiLiTE is a<br />
direct detection Doppler lidar capable <strong>of</strong> measuring <strong>the</strong> motion <strong>of</strong> air molecules in clear<br />
air environments.<br />
Session 10 – Page 1
• Full tropospheric wind, temperature, and humidity pr<strong>of</strong>iles from <strong>the</strong> Advanced<br />
Vertical Atmospheric Pr<strong>of</strong>iling System (AVAPS) dropsonde system, which is capable<br />
<strong>of</strong> releasing up to 100 dropsondes in a single flight.<br />
• Aerosol and cloud layer vertical structure from <strong>the</strong> Cloud Physics Lidar (CPL).<br />
Measurements from <strong>the</strong> Over-Storm GH Payload<br />
• Three-dimensional wind and precipitation fields from <strong>the</strong> High-altitude Wind and<br />
Rain Airborne Pr<strong>of</strong>iler (HIWRAP) conically scanning Doppler radar.<br />
• Surface winds and rainfall from <strong>the</strong> Hurricane Imaging Radiometer (HIRAD) multifrequency<br />
interferometric radiometer.<br />
• Measurements <strong>of</strong> temperature, water vapor, and liquid water pr<strong>of</strong>iles, total<br />
precipitable water, sea-surface temperature, rain rates, and vertical precipitation pr<strong>of</strong>iles<br />
from <strong>the</strong> High-Altitude MMIC Sounding Radiometer (HAMSR).<br />
Session 10 – Page 2
2011 Plans for NOAA’s Intensity Forecasting Experiment (IFEX)<br />
Shirley T. Murillo<br />
(Shirley.Murillo@noaa.gov)<br />
NOAA/AOML/HRD<br />
We continue to address <strong>the</strong> goals set forth by NOAA’s Intensity Forecasting Experiment<br />
(IFEX). IFEX aims to collect observations throughout <strong>the</strong> tropical cyclone (TC) life cycle,<br />
develop and refine measurement technologies for real-time monitoring <strong>of</strong> TC structure and<br />
intensity, and improve understanding <strong>of</strong> <strong>the</strong> physical processes important in TC intensity change.<br />
This season our focus will be on streng<strong>the</strong>ning <strong>the</strong> NOAA intra-agency partnership among HRD,<br />
AOC, EMC and NESDIS, as well as a new effort to enhance interactions between HRD and<br />
NHC. Plans for <strong>the</strong> 2011 field program, including how <strong>the</strong>se interactions will impact it, will be<br />
presented.<br />
Session 10 – Page 3
Estimating Tropical Cyclone Intensity from Infrared Image Data<br />
Elizabeth A. Ritchie 1 , Miguel F. Piñeros 2 , J. Scott Tyo 2 , and Genevieve Valliere-Kelley 1<br />
(ritchie@atmo.arizona.edu)<br />
1 Department <strong>of</strong> Atmospheric Sciences, University <strong>of</strong> Arizona; 2 College <strong>of</strong> Optical Sciences,<br />
University <strong>of</strong> Arizona<br />
A near real-time objective technique for obtaining features associated with <strong>the</strong> shape and <strong>the</strong><br />
dynamics <strong>of</strong> cloud structures embedded in tropical cyclones from satellite infrared images is<br />
described. As <strong>the</strong> tropical cyclone develops from an unstructured cloud cluster and intensifies<br />
<strong>the</strong> cloud structures become more axisymmetric about an identified reference point. Using<br />
variables derived from remotely-sensed IR data, <strong>the</strong> technique calculates <strong>the</strong> gradient <strong>of</strong> <strong>the</strong><br />
brightness temperatures to measure <strong>the</strong> level <strong>of</strong> symmetry <strong>of</strong> each structure and this level <strong>of</strong><br />
symmetry characterizes <strong>the</strong> degree <strong>of</strong> cloud organization <strong>of</strong> <strong>the</strong> tropical cyclone. Previous results<br />
have shown that <strong>the</strong> technique provides a reasonable objective, independent measure <strong>of</strong> <strong>the</strong><br />
intensity <strong>of</strong> <strong>the</strong> tropical cyclone.<br />
In this presentation, seventy-eight tropical cyclones from <strong>the</strong> 2004-2009 seasons are used to both<br />
train and independently test <strong>the</strong> intensity estimation technique. Two independent tests are<br />
performed to test <strong>the</strong> ability <strong>of</strong> <strong>the</strong> technique to accurately estimate tropical cyclone intensity.<br />
Results from <strong>the</strong>se tests will be presented.<br />
Session 10 – Page 4
Airborne Surface Water and Ocean Topography Mapping System<br />
James Carswell and D. Moller<br />
(carswell@remotesensingsolutions.com)<br />
Remote Sensing Solutions<br />
A long history <strong>of</strong> spaceborne radar altimetry observations <strong>of</strong> <strong>the</strong> ocean surface has revolutionized<br />
oceanography enabling significant advances in our understanding <strong>of</strong> global ocean circulation<br />
[e.g., Fu and Cazenave, 2001]. More recently <strong>the</strong>se measurements (in <strong>the</strong> last decade) have been<br />
extended to provide elevation measurements <strong>of</strong> land surface water bodies (ie lakes, rivers and<br />
floodplains) [e.g. Birkett 1998; Alsdorf et. al. 2007a]. Despite <strong>the</strong> significant contributions <strong>of</strong><br />
<strong>the</strong>se observations, <strong>the</strong> fundamental limitation presented is <strong>the</strong> lack <strong>of</strong> coverage that a nadirlooking<br />
sensor can provide with gaps between satellite tracks <strong>of</strong> 200-300km. The result is that<br />
smaller scale features (e.g., oceanic mesoscale processes) are not resolved and many rivers and<br />
lakes are not observed altoge<strong>the</strong>r [Alsdorf et.al. 2007b].<br />
In response <strong>the</strong> NRC Decadal Survey acknowledged not only <strong>the</strong> compelling science needs,<br />
but also <strong>the</strong> measurement commonality between <strong>the</strong> ocean and surface water communities by<br />
recommending <strong>the</strong> Surface Water Ocean Topography satellite mission (SWOT). To satisfy <strong>the</strong><br />
high-resolution sampling requirements needed for surface water hydrology, and <strong>the</strong> high<br />
accuracy requirements for <strong>the</strong> oceanography, <strong>the</strong> primary SWOT instrument is a Ka-band Radar<br />
Interferometer (KaRIN). This solution is capable <strong>of</strong> simultaneously meeting coverage, accuracy<br />
and resolution requirements and enhances greatly <strong>the</strong> science achievable from a traditional<br />
pr<strong>of</strong>iling altimeter. However <strong>the</strong> uniqueness <strong>of</strong> this solution, and application, means <strong>the</strong>re<br />
remain some specific questions for which <strong>the</strong>re currently exists little or no supporting data.<br />
In this paper we present <strong>the</strong> Ka-band SWOT Phenomenology Airborne Radar (KaSPAR).<br />
This multi-baseline Ka-band InSAR will serve to provide <strong>the</strong> necessary measurements to address<br />
key SWOT mission risk items. With centimeter-scale precision, its ability for map ocean and<br />
surface water topography over a wide swath (near nadir to 25 degrees incidence), KaSPAR can<br />
provide unique high-resolution topography maps for directly observing storm surge caused by<br />
tropical storms. With its ability to map radial velocity as well, <strong>the</strong> surface water velocity and<br />
topography observations may also provide essential observations <strong>of</strong> coastal and inland<br />
inundation. These applications and KaSPAR measurement capabilities will be described.<br />
[Alsdorf et. al. 2007a] D. Alsdorf, Feu L. L, N. Mognard, A. Cazenave, E. Rodriguez, D.<br />
Chelton, D. Lettenmaier, Measuring Global Oceans and Terrestrial Freshwater From Space,<br />
EOS Transactions, American Geophysical Union, no. 24, pp. 25, 2007<br />
[Alsdorf et.al. 2007b] D. Alsdorf, E. Rodriguez, and D. P. Lettenmaier, Measuring surface water<br />
from space, Rev. Geophys., 45, RG2002 doi:10.1029/2006RG000197.<br />
[Birkett 1998] C.M. Birkett, Contribution <strong>of</strong> <strong>the</strong> TOPEX NASA radar altimeter to <strong>the</strong> global<br />
monitoring <strong>of</strong> large rivers and wetlands, Water Resources Research, 34, 1223-1239, 1998.<br />
[Fu and Cazenave, 2001] L. L. Fu, A. Cazenave Eds., Altimetry and Earth Science, A Handbook<br />
<strong>of</strong> Techniques and Applications, vol. 69 <strong>of</strong> International Geophysics Series, Academic Press,<br />
London, 2001<br />
Session 10 – Page 5
The Experimental HWRF-HEDAS system: Model Evaluation in Preparation for Satellite<br />
Microwave Data Assimilation Inside <strong>the</strong> Hurricane Precipitation Area<br />
Svetla Hristova-Veleva 1 , Sundararaman Gopalakrishnan 2 ,<br />
Tomislava Vukicevic 2 , Ziad Haddad 1 and Thiago Quirino 2<br />
(Svetla.Hristova@jpl.nasa.gov)<br />
1 Jet Propulsion Laboratory, California Institute <strong>of</strong> Technology; 2 NOAA/HRD/AOML<br />
Over <strong>the</strong> last two decades, data assimilation <strong>of</strong> satellite observations outside precipitation has<br />
lead to significant improvement in <strong>the</strong> ability <strong>of</strong> global models to represent <strong>the</strong> large-scale<br />
synoptic environment. This has resulted in measured improvement in <strong>the</strong> hurricane track<br />
forecast skills <strong>of</strong> <strong>the</strong> global models. However, improving <strong>the</strong> accuracy <strong>of</strong> hurricane intensity<br />
changes remains a very challenging problem. The main source <strong>of</strong> error for <strong>the</strong> large-scale<br />
models is <strong>the</strong>ir limited ability, due to <strong>the</strong> use <strong>of</strong> convective parameterizations, to resolve<br />
convective scale events and <strong>the</strong>ir interaction with <strong>the</strong> large-scale environment. Regional models<br />
have <strong>the</strong> resolution, and <strong>the</strong> physics to properly represent <strong>the</strong> convective processes. However,<br />
even today, <strong>the</strong>re is large uncertainty regarding <strong>the</strong> assumptions used by <strong>the</strong> convective-scale<br />
parameterizations (e.g. parameterizations <strong>of</strong> <strong>the</strong> microphysical processes, <strong>the</strong> boundary layer<br />
processes and <strong>the</strong> ocean-atmosphere fluxes).<br />
Assimilation <strong>of</strong> satellite observations inside <strong>the</strong> precipitation presents <strong>the</strong> next opportunity for<br />
hurricane intensity forecast improvements. It <strong>of</strong>fers two benefits: <strong>the</strong> ability to improve <strong>the</strong><br />
model forecasts through constantly pushing <strong>the</strong> model toward <strong>the</strong> observed precipitation<br />
structures; <strong>the</strong> ability to improve <strong>the</strong> model physics through parameter estimation as part <strong>of</strong> <strong>the</strong><br />
data assimilation.<br />
The data to be assimilated could be ei<strong>the</strong>r <strong>the</strong> satellite-based retrievals <strong>of</strong> geophysical<br />
parameters, or, <strong>the</strong> observed radiances <strong>the</strong>mselves. Assimilation <strong>of</strong> geophysical parameters is<br />
<strong>of</strong>ten easier since <strong>the</strong>y are more closely related to <strong>the</strong> state variables. However, instantaneous<br />
satellite retrievals carry a lot <strong>of</strong> uncertainty. Assimilating <strong>the</strong> observed radiances is <strong>the</strong> more<br />
promising approach at <strong>the</strong> moment. However, to allow <strong>the</strong> model to efficiently assimilate <strong>the</strong><br />
observed data, we need to first assure that <strong>the</strong> model-produced satellite observables compare well<br />
to <strong>the</strong> observations <strong>the</strong>mselves.<br />
To facilitate <strong>the</strong> model evaluation, we are developing <strong>the</strong> Tropical Cyclone Information System<br />
(TCIS- http://topicalcyclone.jpl.nasa.gov). As part <strong>of</strong> TCIS, a dedicated portal was developed to<br />
facilitate <strong>the</strong> NASA/NOAA/NSF hurricane field campaigns <strong>of</strong> 2010 (http://grip.jpl.nasa.gov).<br />
We used it to identify a number <strong>of</strong> cases to allow <strong>the</strong> evaluation <strong>of</strong> different hurricane forecasts.<br />
In particular, we focused on evaluating <strong>the</strong> performance <strong>of</strong> <strong>the</strong> Experimental version <strong>of</strong> HWRF<br />
(HWRFX) in forecasting <strong>the</strong> evolution <strong>of</strong> hurricane Earl. In a previous study we used <strong>the</strong> model<br />
forecast <strong>of</strong> <strong>the</strong> <strong>the</strong>rmodynamic and hydrometeor fields to forward simulate satellite observables<br />
(microwave brightness temperatures). We compared <strong>the</strong> overall structure <strong>of</strong> <strong>the</strong> observed and<br />
<strong>the</strong> forecasted storms as depicted by <strong>the</strong> brightness temperatures at 37 and 89 GHz channels. We<br />
found that <strong>the</strong> model was highly capable in depicting <strong>the</strong> 2D structure <strong>of</strong> <strong>the</strong> precipitation field<br />
and its evolution. However, <strong>the</strong> previous study was mostly qualitative.<br />
Session 10 – Page 6
In this study we go fur<strong>the</strong>r and perform a statistical comparison <strong>of</strong> <strong>the</strong> observed and simulated<br />
brightness temperatures. We evaluate <strong>the</strong>ir distributions as a function <strong>of</strong> <strong>the</strong> distance from <strong>the</strong><br />
storm center. We look at <strong>the</strong> joint multi-frequency distributions <strong>of</strong> simulated and observed<br />
brightness temperatures to evaluate whe<strong>the</strong>r <strong>the</strong> vertical structure <strong>of</strong> <strong>the</strong> precipitation is properly<br />
reflected in <strong>the</strong> simulated storms. As part <strong>of</strong> this study, we also evaluate <strong>the</strong> impact <strong>of</strong><br />
microphysical assumptions as manifested in <strong>the</strong> brightness temperatures <strong>of</strong> an ensemble WRF<br />
(ARW) simulations, each member using different assumptions about <strong>the</strong> hydrometeor’s particle<br />
size distributions. Ongoing plans include developing composites from satellite observations to<br />
facilitate <strong>the</strong> model evaluation. The goal is to point toward a more realistic set <strong>of</strong> assumptions<br />
that would produce simulations with closer-to-<strong>the</strong>-observed radiometric signatures. Assuring a<br />
close comparison between observed and modeled radiances in precipitation is <strong>the</strong> first, and very<br />
important, step toward an effective assimilation <strong>of</strong> satellite observations in <strong>the</strong> HWRFX system.<br />
For this purpose <strong>the</strong> Hurricane EnKF Data Assimilation System (HEDAS) that is currently<br />
developed at NOAA's hurricane research division is proposed to be used.<br />
Session 10 – Page 7
Hurricane center-fixing with <strong>the</strong> Automated Rotational Center Hurricane Eye Retrieval<br />
(ARCHER) method<br />
Anthony Wimmers, Christopher Velden<br />
(wimmers@ssec.wisc.edu)<br />
Cooperative Institute for Meteorological Satellite Studies (CIMSS)<br />
University <strong>of</strong> Wisconsin-Madison<br />
Precise center-fixing <strong>of</strong> tropical cyclones (TCs) is critical for operational forecasting, intensity<br />
estimation and visualization. Current procedures are usually performed with manual input from a<br />
human analyst, using multispectral satellite imagery as <strong>the</strong> primary tools. While adequate in<br />
many cases, subjective interpretation can <strong>of</strong>ten lead to variance in <strong>the</strong> estimated center positions.<br />
In this paper we present an objective, robust algorithm for resolving <strong>the</strong> rotational center <strong>of</strong> TCs:<br />
<strong>the</strong> Automated Rotational Center Hurricane Eye Retrieval (ARCHER). The algorithm finds <strong>the</strong><br />
center <strong>of</strong> rotation using spirally-oriented brightness temperature gradients in <strong>the</strong> TC banding<br />
patterns in combination with gradients along <strong>the</strong> ring-shaped edge <strong>of</strong> a possible eye. It is<br />
calibrated and validated using 85-92 GHz passive microwave imagery because <strong>of</strong> this<br />
frequency's relative ubiquity in TC applications. However, similar versions <strong>of</strong> ARCHER are also<br />
shown to work effectively with 37 GHz and infrared imagery <strong>of</strong> TCs. In TC cases with estimated<br />
low to moderate vertical wind shear, <strong>the</strong> mean accuracy <strong>of</strong> <strong>the</strong> ARCHER estimated center<br />
positions is 17 km (9 km for Category 1-5 hurricanes). In cases with estimated high vertical<br />
shear, <strong>the</strong> accuracy <strong>of</strong> ARCHER is 31 km (21 km for Category 2-5 hurricanes). O<strong>the</strong>r structure<br />
parameters retrieved from this algorithm such as eye radius and eyewall brightness temperature<br />
are shown to have important value for intensity estimation.<br />
Session 10 – Page 8
Intraseasonal to Seasonal Prediction <strong>of</strong> Tropical Cyclogenesis:<br />
A Statistical-Dynamical Forecast System<br />
Tom Murphree and David Meyer<br />
(murphree@nps.edu)<br />
Department <strong>of</strong> Meteorology, Naval Postgraduate School<br />
We have developed a statistical-dynamical prediction system for forecasting <strong>the</strong><br />
probability <strong>of</strong> tropical cyclone (TC) formation at intraseasonal to seasonal scales and 2.5°<br />
horizontal resolution across <strong>the</strong> western North Pacific (WNP), with lead times out to 90 days.<br />
We use five large scale environmental factors (LSEFs) to represent <strong>the</strong> favorability <strong>of</strong> <strong>the</strong> climate<br />
system for tropical Cyclogenesis (low level relative vorticity, sea surface temperature, vertical<br />
wind shear, upper level divergence, and planetary vorticity). We use logistic regression to<br />
develop a statistical model representing <strong>the</strong> probability <strong>of</strong> TC formation based on <strong>the</strong> LSEFs.<br />
Data for <strong>the</strong> model development was obtained for <strong>the</strong> LSEFs from <strong>the</strong> NCEP R2 reanalysis, and<br />
for <strong>the</strong> corresponding TC activity from <strong>the</strong> JTWC best track data set. We use <strong>the</strong> NCEP Climate<br />
Forecast System (CFS) to obtain forecasts <strong>of</strong> <strong>the</strong> LSEFs at lead times <strong>of</strong> several days to several<br />
months, which we <strong>the</strong>n use to force <strong>the</strong> regression model. The forecasts are ensemble means<br />
based on extensive ensembling <strong>of</strong> individual forecasts with multiple initial conditions and<br />
multiple lead times.<br />
We have conducted independent hindcasts for 1982-2008 which show <strong>the</strong> forecast system<br />
has skill and potential value to risk adverse customers (e.g., positive Brier skill scores, skillful<br />
ROC values). For 2009 and 2010, we have generated and verified forecasts out to leads <strong>of</strong> 90<br />
days. The skill <strong>of</strong> <strong>the</strong>se forecasts is very positive, as indicated by several metrics. For example,<br />
for 2009, <strong>the</strong> 30 day lead forecasts had a probability <strong>of</strong> detection (POD) <strong>of</strong> 0.81 and a Heidke<br />
skill score (HSS) <strong>of</strong> 0.38. For 2010, <strong>the</strong> 90 day lead forecasts had a POD <strong>of</strong> 0.82 and a HSS <strong>of</strong><br />
0.26 (<strong>the</strong> 2010 skill results are preliminary until <strong>the</strong> release <strong>of</strong> <strong>the</strong> JTWC best track data in 2011).<br />
The 2009 and 2010 forecasts also correctly predicted several intraseasonal and interannual<br />
variations. For example, <strong>the</strong> 30-90 day lead forecasts for 2010 forecasted a northward and<br />
westward shift in <strong>the</strong> location <strong>of</strong> <strong>the</strong> main formation region from its long term mean position, and<br />
much lower formation probabilities than normal, consistent with <strong>the</strong> observed formations for<br />
2010 and with <strong>the</strong> development <strong>of</strong> La Nina conditions in 2010. These formation anomalies were<br />
forecasted first by <strong>the</strong> 90 day lead forecasts issued in Mar-May 2010, three (five) months prior to<br />
<strong>the</strong> first La Nina watch (advisory) issued by NOAA/CPC.<br />
We have also developed a corresponding system for forecasting North Atlantic TC<br />
formations, with positive early results. We are presently upgrading <strong>the</strong> forecast system to take<br />
advantage <strong>of</strong> NCEP’s recently released and higher resolution Climate Forecast System<br />
Reanalysis (CFSR) and Climate Forecast System version 2 (CFSv2).<br />
Session 10 – Page 9
S<br />
E<br />
Session 11<br />
O<strong>the</strong>r Research to<br />
Improve <strong>the</strong> Prediction <strong>of</strong><br />
Tropical Cyclone Intensity<br />
and Structure, Track,<br />
Precipitation, and Inland<br />
Inundation,<br />
Part 2<br />
S<br />
S<br />
I<br />
O<br />
N<br />
11
International Best Track Archive for Climate Stewardship (IBTrACS)<br />
activities at NOAA’s NCDC<br />
Kenneth R. Knapp a , Howard Diamond a , Ethan J Gibney c , Paula A. Hennon c , Michael C. Kruk c<br />
(Ken.Knapp@noaa.gov)<br />
a<br />
NOAA/NCDC, b I.M. Systems Group, Inc., Asheville, NC, c STG, Inc.<br />
The International Best Track Archive for Climate Stewardship (IBTrACS) is a project at<br />
NOAA’s National Climatic Data Center under <strong>the</strong> auspices <strong>of</strong> <strong>the</strong> World Data Center for<br />
Meteorology – Asheville to collect and disseminate <strong>the</strong> historical tropical cyclone best track data<br />
from all available agencies, merging <strong>the</strong> disparate data sets into one comprehensive product for<br />
<strong>the</strong> user community. One <strong>of</strong> <strong>the</strong> goals <strong>of</strong> <strong>the</strong> project is to maintain open data processing methods,<br />
so that desired user feedback on data quality is more easily collected. In addition, data<br />
provenance is completely recorded so all observations and corrections, ei<strong>the</strong>r through rigorous<br />
quality control or user feedback, may be attributed to <strong>the</strong>ir source. Data are available in various<br />
formats to accommodate <strong>the</strong> diverse needs <strong>of</strong> <strong>the</strong> tropical cyclone data user community. The<br />
presentation will summarize <strong>the</strong> purpose <strong>of</strong> <strong>the</strong> project, recent accomplishments and <strong>the</strong> future<br />
direction <strong>of</strong> IBTrACS. More information on IBTrACS is available at<br />
http://www.ncdc.noaa.gov/oa/ibtracs/<br />
Session 11 – Page 1
Dry Air in <strong>the</strong> Tropical Cyclone Environment<br />
Jason P. Dunion 1 , Greg Tripoli 2<br />
(Jason.Dunion@noaa.gov)<br />
1 University <strong>of</strong> Miami/RSMAS/CIMAS - NOAA/AOML/HRD; 2 University <strong>of</strong> Wisconsin-<br />
Madison<br />
Infrared and microwave satellite imagery has steadily improved our ability to detect dry air in <strong>the</strong><br />
environments <strong>of</strong> tropical disturbances. However, forecasting when and how low to mid-level dry<br />
air will interact with <strong>the</strong>se systems remains a difficult challenge. This presentation will discuss<br />
details <strong>of</strong> diagnosing interactions between low to mid-level dry air and tropical disturbances (i.e.<br />
arc cloud formation), trajectory analyses that may provide insight as to where and when a dry air<br />
intrusion will take place, and idealized simulations that fur<strong>the</strong>r investigate trajectories <strong>of</strong> dry air<br />
intrusions into tropical cyclones (TCs).<br />
When a dry air intrusion interacts with tropical convection, significant arc cloud events are <strong>of</strong>ten<br />
spawned. Although arc clouds are common features in mid-latitude thunderstorms and MCSs,<br />
<strong>the</strong>y have only occasionally been noted in TC environments (Knaff and Weaver 2000). Arc<br />
clouds denote <strong>the</strong> presence <strong>of</strong> a density current that forms when dry middle level (~600-850 hPa)<br />
air has interacted with precipitation. The convectively-driven downdrafts that result can reach<br />
<strong>the</strong> surface/near-surface and spread out from a thunderstorm’s convective core. It is hypo<strong>the</strong>size<br />
that <strong>the</strong> mid-level moisture found in <strong>the</strong> moist tropical North Atlantic sounding described by<br />
Dunion (2011) is insufficiently dry to generate extensive arc clouds around African easterly<br />
waves (AEWs) or TCs. However, substantial arc clouds (100s <strong>of</strong> km in length and lasting for<br />
several hours) consistently form in <strong>the</strong> tropics in <strong>the</strong> periphery <strong>of</strong> <strong>the</strong>se tropical disturbances.<br />
Dunion (2011) described two additional types <strong>of</strong> air masses frequently found in <strong>the</strong> tropical<br />
North Atlantic and Caribbean (both with 50-60% less low to mid-level moisture than <strong>the</strong> moist<br />
tropical sounding) that could effectively initiate <strong>the</strong> formation <strong>of</strong> large arc clouds: <strong>the</strong> Saharan<br />
Air Layer and mid-latitude dry air intrusions. It is hypo<strong>the</strong>sized that <strong>the</strong> processes leading to <strong>the</strong><br />
formation <strong>of</strong> arc cloud events can significantly impact an AEW or TC (particularly smaller, less<br />
developed systems). Specifically, <strong>the</strong> cool, dry air associated with <strong>the</strong> convectively-driven<br />
downdrafts that form arc clouds can help stabilize <strong>the</strong> middle to lower troposphere and may even<br />
act to stabilize <strong>the</strong> boundary layer. The arc clouds <strong>the</strong>mselves may also act to disrupt <strong>the</strong> storm.<br />
As <strong>the</strong>y race away from <strong>the</strong> convective core region, <strong>the</strong>y create low-level outflow in <strong>the</strong><br />
quadrant/semicircle <strong>of</strong> <strong>the</strong> AEW or TC in which <strong>the</strong>y form. This outflow pattern counters <strong>the</strong><br />
typical low-level inflow that is vital for TC formation and maintenance.<br />
Recent work looking at trajectory analyses and observations from aircraft and satellites suggest<br />
that <strong>the</strong>re are preferred pathways for low to mid-level dry air to enter <strong>the</strong> periphery <strong>of</strong> tropical<br />
disturbances. These results may provide insight as to where and when a dry air intrusion may<br />
take place. To fur<strong>the</strong>r study <strong>the</strong>se preferred pathways, idealized simulations <strong>of</strong> a TC vortex<br />
embedded in easterly flow is examined on both an f-plane, a beta plane and relative to an easterly<br />
jet to examine <strong>the</strong> relative <strong>the</strong> impact <strong>of</strong> both beta drift and <strong>the</strong> Magnus effect on <strong>the</strong> entrainment<br />
<strong>of</strong> dry air into <strong>the</strong> TC. The conditions for <strong>the</strong> relative importance <strong>of</strong> <strong>the</strong>se effects under differing<br />
horizontal and vertical shears <strong>of</strong> easterly flow expected with AEWs will be presented.<br />
Session 11 – Page 2
Improvements to Statistical Intensity Forecasts<br />
John A. Knaff 1 , Mark DeMaria 1 , Kate Musgrave 2 , John Kaplan 3 , Christopher M. Roz<strong>of</strong>f 4 , James<br />
P. Kossin 5 , Christopher S. Velden 4 ,<br />
(John.Knaff@noaa.gov)<br />
1 NOAA/NESDIS/STAR; 2 CIRA/CSU; 3 NOAA/HRD; 4 CIMSS/UW, 5 NOAA/NESDIS/NCDC<br />
Tropical cyclone intensity forecasts have improved relatively slowly over <strong>the</strong> last decade and<br />
statistical models still remain state-<strong>of</strong>-<strong>the</strong>-art. Recently with NOAA’s Hurricane Intensity<br />
Forecast Improvement Project (HFIP), great emphasis has been placed on numerical wea<strong>the</strong>r<br />
prediction models, which are fully expected to become <strong>the</strong> state-<strong>of</strong>-<strong>the</strong>-art methodology by <strong>the</strong><br />
end <strong>of</strong> <strong>the</strong> <strong>the</strong> HFIP program. In <strong>the</strong> mean time, several new statistical techniques have been<br />
developed, existing techniques have been improved and <strong>the</strong> application <strong>of</strong> similar techinques are<br />
being developed for o<strong>the</strong>r tropical cyclone basins. Much <strong>of</strong> <strong>the</strong> recent improvements to existing<br />
methodologies have concentrated on improved use <strong>of</strong> satellite-based information from NOAA’s<br />
Geostationary Operational Environmental Satellite (GOES) and Polar Operational<br />
Environmental Satellite (POES) programs and data from o<strong>the</strong>r low earth orbiting satellite<br />
platforms. Funding for <strong>the</strong>se efforts has come from a variaty <strong>of</strong> different programs including <strong>the</strong><br />
GOES I/M Product Assurance Plan (GIMPAP), <strong>the</strong> Joint Hurricane Testbed (JHT), and <strong>the</strong><br />
GOES-R Risk Reduction (GOES-R3) program.<br />
This presentation will detail <strong>the</strong> recent improvements to existing statistical intensity forecast<br />
techniques, recently developed techniques and planned future improvements. More specifically<br />
we will present recent improvements (and related verifications) to existing statistical techniques<br />
including <strong>the</strong> Statistical Hurricane Intensity Predictions Scheme (SHIPS), <strong>the</strong> Logistic Growth<br />
Equation Model (LGEM) and <strong>the</strong> Rapid Intensity Index (RII). This disucssion will include<br />
updates to <strong>the</strong> developmental datasets, new GOES-based, microwave-based and total precipitable<br />
water predictors and statistical methodologies as well as insight inferred from real-time<br />
experimental (JHT and GOES-R3 Proving Ground) versions <strong>of</strong> <strong>the</strong> RII that included lightning<br />
information. In addition, recently developed tools to anticipate rapid weakening (25-kt in 24 h)<br />
<strong>of</strong> non-landfalling tropical cyclones and extra-tropical transitions will be discussed. Here we will<br />
also review expected performance <strong>of</strong> a probabalistic estimate <strong>of</strong> rapid weakening and <strong>the</strong> factors<br />
found to be related to eminant (24-h) extratropical transition in a similar statistical framework.<br />
Finally, future plans to transfer <strong>the</strong>se capabilities to o<strong>the</strong>r tropical cyclone basins will be briefly<br />
discussed.<br />
DISCLAIMER: The views, opinions, and findings in this report are those <strong>of</strong> <strong>the</strong> authors and<br />
should not be construed as an <strong>of</strong>ficial NOAA and/or U.S. Government position, policy, or<br />
decision.<br />
Session 11 – Page 3
Improvements in <strong>the</strong> Statistical Prediction <strong>of</strong> Tropical Cyclone Rapid Intensification<br />
Christopher M. Roz<strong>of</strong>f 1 James P. Kossin 1,2 , Christopher Velden 1 , Anthony J. Wimmers 1 ,<br />
Margaret E. Kieper 3 , John Kaplan 4 , John A. Knaff 5 , and Mark DeMaria 5<br />
(chris.roz<strong>of</strong>f@ssec.wisc.edu),<br />
1 CIMSS/UW-Madison; 2 NOAA/NCDC; 3 Private Consultant; 4 NOAA/HRD;<br />
5 NOAA/NESDIS/StAR<br />
The National Hurricane Center currently uses a skillful probabilistic rapid intensification<br />
(RI) index (RII) based on linear discriminant analysis <strong>of</strong> <strong>the</strong> environmental and satellite-derived<br />
features from <strong>the</strong> Statistical Hurricane Prediction Scheme (SHIPS) dataset. In this presentation,<br />
two new probabilistic models for RI prediction, along with <strong>the</strong> benefits <strong>of</strong> using an ensemblemean<br />
<strong>of</strong> multiple models, will be reviewed. The remainder <strong>of</strong> <strong>the</strong> presentation will focus on <strong>the</strong><br />
benefits <strong>of</strong> using structural predictors based on microwave imagery.<br />
Two new probabilistic RI models, one based on logistic regression and <strong>the</strong> o<strong>the</strong>r on a naïve<br />
Bayes framework, are evaluated. Both models incorporate data from <strong>the</strong> SHIPS dataset and have<br />
been developed for a variety <strong>of</strong> RI thresholds for both <strong>the</strong> Atlantic and eastern Pacific. Crossvalidation<br />
demonstrates that both models are skillful relative to climatology and that <strong>the</strong>ir skill is<br />
competitive with SHIPS-RII. Finally, a three-member ensemble-mean <strong>of</strong> <strong>the</strong> logistic, Bayesian,<br />
and SHIPS-RII models provides superior skill to any <strong>of</strong> <strong>the</strong> individual members. For a rapid<br />
intensification threshold <strong>of</strong> 25 kt per 24 h, <strong>the</strong> three-member ensemble-mean improves <strong>the</strong> Brier<br />
skill scores relative to <strong>the</strong> current operational SHIPS-RII by 33% in <strong>the</strong> Atlantic and 52% in <strong>the</strong><br />
eastern Pacific.<br />
This presentation will also highlight improvements in statistical models <strong>of</strong> RI resulting<br />
from <strong>the</strong> incorporation <strong>of</strong> predictors derived from 37-GHz microwave imagery. These predictors<br />
exploit <strong>the</strong> internal structure <strong>of</strong> tropical cyclones <strong>of</strong>ten obscured from view in geostationary<br />
satellite data. Cross-validation <strong>of</strong> <strong>the</strong> logistic RI model in both <strong>the</strong> Atlantic and East Pacific<br />
shows that adding certain microwave-based predictors improves both <strong>the</strong> Brier skill score and<br />
probability <strong>of</strong> detection significantly. Plans to include predictors from 19- and 85-GHz<br />
microwave frequencies will also be discussed.<br />
Session 11 – Page 4
Improving SHIPS Rapid Intensification (RI) Index Using 37 GHz Microwave Ring Pattern<br />
around <strong>the</strong> Center <strong>of</strong> Tropical Cyclones<br />
Haiyan Jiang 1 , Margie Kieper 2 , Tie Yuan 1 , Edward J. Zipser 3 , and John Kaplan 4<br />
(haiyan.jiang@fiu.edu)<br />
1 Department <strong>of</strong> Earth & Environment, Florida International University<br />
2 Private Consultant; 3 Department <strong>of</strong> Atmospheric Sciences, University <strong>of</strong> Utah<br />
4 NOAA/HRD<br />
The physical processes associated with rapid intensification (RI) <strong>of</strong> tropical cyclones (TCs)<br />
remain unsolved. Predicting <strong>the</strong>se events is one <strong>of</strong> <strong>the</strong> most challenging aspects for TC<br />
forecasters. Recently, a robust ring pattern in <strong>the</strong> inner core area <strong>of</strong> TCs has been found in <strong>the</strong> 37<br />
GHz microwave images to be associated with RI. Margie Kieper initiated a subjective forecast<br />
method using <strong>the</strong> 37 GHz color product developed by <strong>the</strong> Naval Research Laboratory (NRL) to<br />
predict <strong>the</strong> onset <strong>of</strong> RI. She reviewed numerous microwave TC images, and found that a cyan<br />
color ring around <strong>the</strong> eye could be an early indicator <strong>of</strong> RI when environmental conditions are<br />
favorable. She tested this method in real time for <strong>the</strong> 2008 hurricane season in <strong>the</strong> Atlantic<br />
(ATL) and 2009-2010 hurricane seasons for both ATL and East Pacific (EPA) basins in<br />
conjunction with <strong>the</strong> SHIPS RI index. The result was very encouraging. So it will be optimal to<br />
translate this subjective forecast method into an objective one for wider forecast applications.<br />
However, <strong>the</strong> NRL 37color product is constructed by using 37 GHz vertically polarized<br />
(V37) and horizontally polarized (H37) brightness temperatures, and polarization correction<br />
temperature (PCT37). V37 and H37 are sensitive to sea surface (cold) and low-level clouds/rain<br />
(warm), while PCT37 is sensitive to convection (cold). The product implements a red/green/blue<br />
color composite from PCT37, H37 and V37 so that <strong>the</strong> sea surface in <strong>the</strong> color product appears<br />
green, deep convection appears pink, and low-level water clouds and rain appear cyan. Although<br />
this product provides unique qualitative information, quantitative information is sacrificed. It has<br />
been a mystery for <strong>the</strong> TC community what <strong>the</strong> cyan color truly represents. This hinders us from<br />
translating Margie Kieper’s eye-based subjective method into an objective and automatic<br />
prediction method.<br />
In this study, we discovered <strong>the</strong> mystery by determining quantitative values for <strong>the</strong> cyan<br />
color region in <strong>the</strong> NRL 37 GHz color product using a 12-yr Tropical Rainfall Measurement<br />
Mission (TRMM) tropical cyclone precipitation feature database. Based on <strong>the</strong>se findings, an<br />
objective 37 GHz ring pattern RI index is developed by strictly following Margie Kieper’s ring<br />
pattern identification and forecasting methodology. Evaluation <strong>of</strong> <strong>the</strong> index has been done by<br />
using <strong>the</strong> TRMM Microwave Imager (TMI) observations <strong>of</strong> TCs in <strong>the</strong> ATL and EPA basins<br />
from 2002 to 2009. It is found that <strong>the</strong> 37 GHz ring pattern RI index is an independent predictor<br />
relative to <strong>the</strong> SHIPS RI index. By adding this ring pattern index to <strong>the</strong> SHIPS RI index, <strong>the</strong> skill<br />
score <strong>of</strong> <strong>the</strong> new combined indices can be as high as 55% for <strong>the</strong> ATL basin and 75% for <strong>the</strong><br />
EPA basin for RI threshold at 25-kt intensity increase during 24 hours.<br />
Session 11 – Page 5
Forecasting Rapid Intensification <strong>of</strong> Tropical Cyclones in <strong>the</strong> Western North Pacific Using<br />
TRMM/TMI 37 GHz Microwave Signal<br />
Tie Yuan 1 , Haiyan Jiang 1 , and Margaret Kieper 2<br />
(tyuan@fiu.edu)<br />
1 Department <strong>of</strong> Earth & Environment, Florida International University; 2 Private Consultant<br />
The prediction <strong>of</strong> rapid intensification (RI) <strong>of</strong> tropical cyclones has always been a great<br />
challenge in tropical wea<strong>the</strong>r forecasting. Compared with <strong>the</strong> progress in RI forecast in <strong>the</strong><br />
Atlantic and Eastern North Pacific, <strong>the</strong>re are few works in RI forecast in <strong>the</strong> Western North<br />
Pacific. Following Margie Kieper’s subjective forecast method using <strong>the</strong> 37 GHz color product<br />
developed by <strong>the</strong> Naval Research Laboratory (NRL) to predict <strong>the</strong> onset <strong>of</strong> RI, we have<br />
developed an automated detection method, 37 GHz ring pattern RI index, to identify <strong>the</strong> cyancolor<br />
ring pattern around <strong>the</strong> center <strong>of</strong> tropical cyclones from <strong>the</strong> Tropical Rainfall Measurement<br />
Mission (TRMM) Microwave Imager (TMI) 37 GHz observations (please see <strong>the</strong> abstract by<br />
Jiang et al. in <strong>the</strong> same conference). In this study, this ring pattern RI index is applied to <strong>the</strong> 12-<br />
yr TRMM Tropical Cyclone Precipitation Features (TCPFs) database to investigate <strong>the</strong><br />
probability <strong>of</strong> improving RI forecast in <strong>the</strong> Western North Pacific. The result shows that <strong>the</strong><br />
probability <strong>of</strong> detection (POD) <strong>of</strong> RI for storms reaching tropical storm intensity in <strong>the</strong> Western<br />
North Pacific is about 63%. Fur<strong>the</strong>rmore, it is found that <strong>the</strong> greater <strong>the</strong> intensity <strong>of</strong> tropical<br />
cyclones is, <strong>the</strong> larger <strong>the</strong> POD. The PODs are 40%, 75%, and 100% for tropical storms,<br />
typhoons, and super typhoons, respectively.<br />
Our technique uses <strong>the</strong> 37-GHz ring feature in <strong>the</strong> storm’s inner core, <strong>the</strong>refore it counts <strong>the</strong><br />
effects <strong>of</strong> storm internal processes on intensity change. However, large-scale environmental<br />
conditions are <strong>the</strong> controlling factors <strong>of</strong> intensity change. We plan to use <strong>the</strong> environmental<br />
factors such as SST and wind shear to screen out those ring cases with unfavorable<br />
environmental conditions. The work is underway to generate environmental RI index similar to<br />
STIPS using <strong>the</strong> ECMWF INTERIM reanalysis data. The environmental RI index will be<br />
incorporated into <strong>the</strong> 37 GHz ring pattern RI index to fur<strong>the</strong>r advance <strong>the</strong> RI forecast skill in <strong>the</strong><br />
Western North Pacific.<br />
Session 11 – Page 6
S<br />
E<br />
S<br />
Session 12<br />
Joint Hurricane Testbed<br />
Project Updates and<br />
Improved Products<br />
S<br />
I<br />
O<br />
N<br />
12
2010 Update on The Joint Hurricane Testbed (JHT)<br />
Jiann-Gwo Jiing, Christopher Landsea and Shirley Murillo<br />
(Jiann-Gwo.Jiing@noaa.gov)<br />
Joint Hurricane Testbed<br />
Forecasting tools and techniques, developed by <strong>the</strong> research community were tested and<br />
evaluated at <strong>the</strong> National Hurricane Center (NHC) facilitated by <strong>the</strong> Joint Hurricane Testbed<br />
(JHT). Eleven 5 th round (FY09-11) projects were tested and evaluated during <strong>the</strong> 2010 hurricane<br />
season, following any necessary technique modifications or o<strong>the</strong>r preparations. These projects<br />
include upgrades to dynamical models and model components, enhancements to observed data<br />
and assimilation techniques, track forecasting algorithms, intensity estimation and forecasting<br />
algorithms. An announcement <strong>of</strong> <strong>Federal</strong> Funding Opportunity for new FY11 funding was<br />
released in July. Letters <strong>of</strong> Intent followed by full Proposals were submitted by Principal<br />
Investigators and evaluated by <strong>the</strong> JHT Steering Committee for a 6 th round <strong>of</strong> JHT projects to<br />
begin in August 2011.<br />
Session 12 – Page 1
Enhancements to <strong>the</strong> SHIPS Rapid Intensification Index<br />
John Kaplan 1 , Joe Cione 1 , Mark DeMaria 2 , John Knaff 2 , Jason Dunion 3 , Jeremy Solbrig 4 , Jeffrey<br />
Hawkins 4 , Thomas Lee 4 , Evan Kalina 5 , Jun Zhang 3 , Jack Dostalek 6 , Paul Leighton 1<br />
(John.Kaplan@noaa.gov)<br />
1 NOAA/HRD; 2 NOAA/NESDIS; 3 CIMAS/HRD; 4 NRL; 5 CU; 6 CIRA<br />
Predicting <strong>the</strong> timing, magnitude, and duration <strong>of</strong> episodes <strong>of</strong> tropical cyclone rapid<br />
intensification (RI) remains one <strong>of</strong> <strong>the</strong> most challenging problems in tropical cyclone forecasting.<br />
In recent years, a statistically based rapid intensification index (RII) that uses predictors from <strong>the</strong><br />
SHIPS model to estimate <strong>the</strong> probability <strong>of</strong> RI has been developed for operational use by<br />
forecasters at <strong>the</strong> National Hurricane Center (NHC) for systems in <strong>the</strong> Atlantic and eastern North<br />
Pacific basins. Although <strong>the</strong> operational RII forecasts exhibited some skill in each <strong>of</strong> <strong>the</strong><br />
aforementioned basins when validated for <strong>the</strong> recent 2008 and 2009 Hurricane seasons, <strong>the</strong> skill<br />
<strong>of</strong> <strong>the</strong> RII was relatively low in <strong>the</strong> Atlantic basin and only in <strong>the</strong> low to moderate range in <strong>the</strong><br />
eastern North Pacific basin. Thus with support from <strong>the</strong> NOAA Joint Hurricane Testbed (JHT),<br />
research is currently being conducted to improve <strong>the</strong> operational RII by including predictors<br />
derived from three new sources <strong>of</strong> inner-core information. The first <strong>of</strong> <strong>the</strong>se three new sources is<br />
<strong>the</strong> time evolution <strong>of</strong> <strong>the</strong> structure <strong>of</strong> <strong>the</strong> inner-core as deduced using standard principlecomponent<br />
analysis <strong>of</strong> GOES infra-red (IR) imagery while <strong>the</strong> second is microwave-derived total<br />
precipitable water. The final source is lower tropospheric GFS model temperature and moisture<br />
data and sea-surface temperature estimates derived from an inner-core sea-surface temperaturecooling<br />
algorithm.<br />
In year 1 <strong>of</strong> this JHT proposal, an experimental version <strong>of</strong> <strong>the</strong> SHIPS rapid intensification<br />
index (RII) was developed for <strong>the</strong> Atlantic basin utilizing predictors from <strong>the</strong>se three new<br />
information sources. This new experimental version <strong>of</strong> <strong>the</strong> Atlantic RII was tested in real-time<br />
during <strong>the</strong> latter part <strong>of</strong> <strong>the</strong> 2010 Atlantic Hurricane Season for <strong>the</strong> first time. A verification <strong>of</strong><br />
<strong>the</strong>se real-time forecasts as well as those that were obtained by re-running cases that occurred<br />
prior to <strong>the</strong> commencement <strong>of</strong> <strong>the</strong>se tests using real-time GFS data and operational NHC track<br />
forecasts will be shown. More recently, an experimental version <strong>of</strong> <strong>the</strong> RII was also developed<br />
for <strong>the</strong> eastern North Pacific basin using predictors that were quite similar to those that were used<br />
to derive <strong>the</strong> experimental Atlantic version. The results <strong>of</strong> <strong>the</strong>se efforts will also be presented at<br />
<strong>the</strong> conference.<br />
Session 12 – Page 2
Status and plans for <strong>the</strong> development <strong>of</strong> a unified dropsonde<br />
quality assurance and visualization capability, ASPENV3<br />
Michael L. Black 1 , Charles L. Martin 2 ,<br />
Paul Flaherty 3 , Jackie Almeida 3 , Joseph E. Latham 4<br />
(Michael.Black@noaa.gov)<br />
1 NOAA/AOML/HRD; 2 Earth Observing Laboratory, NCAR;<br />
3 Aircraft Operations Center, MacDill AFB; 4 53 rd Wea<strong>the</strong>r Reconnaissance Squadron,<br />
In 2009 and 2010, <strong>the</strong> Joint Hurricane Testbed (JHT) funded a joint NOAA and NCAR project to<br />
develop a revised s<strong>of</strong>tware package to perform real-time quality control (QC) <strong>of</strong> dropsonde<br />
observations from AFRC and NOAA aircraft. The primary goal <strong>of</strong> <strong>the</strong> project is to provide a<br />
more robust editing and visualization capability than is currently available to ensure that realtime<br />
observational and research data from dropsonde observations are <strong>of</strong> <strong>the</strong> highest quality and<br />
as error-free as possible. The s<strong>of</strong>tware package combines <strong>the</strong> graphics capability and ease <strong>of</strong> use<br />
<strong>of</strong> NCAR’s current ASPEN s<strong>of</strong>tware with some <strong>of</strong> <strong>the</strong> additional editing capabilities and refined<br />
QC algorithms contained in NOAA’s Editsonde s<strong>of</strong>tware. The new s<strong>of</strong>tware suite operates on<br />
multiple computer platforms, incorporates publicly available graphics frameworks, and will be<br />
configurable to run in ei<strong>the</strong>r a real-time, basic mode or in an enhanced mode for post analyses <strong>of</strong><br />
<strong>the</strong> dropsonde data.<br />
An initial prototype s<strong>of</strong>tware package, ASPENV3, has been completed, will run in Windows,<br />
Mac OSX, or Linux computer operating systems, and is available for testing by experienced<br />
users. Additional components are currently being added and an <strong>of</strong>ficial release <strong>of</strong> <strong>the</strong> s<strong>of</strong>tware is<br />
expected to occur prior to <strong>the</strong> start <strong>of</strong> <strong>the</strong> 2011 hurricane season. A progress report on <strong>the</strong> stage<br />
<strong>of</strong> development and plans for testing and refining <strong>the</strong> s<strong>of</strong>tware will be given. A demonstration <strong>of</strong><br />
ASPENV3 will be presented and some <strong>of</strong> <strong>the</strong> new capabilities will be briefly discussed.<br />
Session 12 – Page 3
Advanced Applications <strong>of</strong> Monte Carlo Wind Probability Model:<br />
A Year 2 Joint Hurricane Testbed Project Update<br />
Mark DeMaria 1 , Robert DeMaria 2 , Andrea Schumacher 2 , Daniel Brown 3 ,<br />
Michael Brennan 3 , Richard Knabb 4 , Pablo Santos 5 , David Sharp 6 , John Knaff 1 and Stan Kidder 2<br />
(Mark.DeMaria@noaa.gov)<br />
1 NOAA/NESDIS; 2 CIRA, Colorado State University; 3 NOAA/NCEP/NHC;<br />
4 The Wea<strong>the</strong>r Channel; 5 NOAA/National Wea<strong>the</strong>r Service, Miami, FL;<br />
6 NOAA/National Wea<strong>the</strong>r Service, Melbourne, FL<br />
Under previous JHT support, a program for estimating <strong>the</strong> probability <strong>of</strong> occurrence <strong>of</strong> 34, 50,<br />
and 64 kt winds was developed by NESDIS and CIRA. A Monte Carlo (MC) method was<br />
utilized to combine <strong>the</strong> uncertainty in <strong>the</strong> track, intensity, and wind structure forecasts for<br />
tropical cyclones. The MC probability program was transitioned to NHC operations in 2006.<br />
In <strong>the</strong> current project, four new applications <strong>of</strong> <strong>the</strong> MC model were proposed including (1)<br />
Landfall timing and intensity distributions; (2) Methods for using <strong>the</strong> MC model to enhance<br />
WFO local products; (3) Probabilities integrated over coastal segments; (4) Automated guidance<br />
for issuing coastal watches and warnings. A prototype graphical user interface has been<br />
developed for items (1), (3), and (4) above, and examples will be presented. A validation <strong>of</strong> <strong>the</strong><br />
MC model for a large sample <strong>of</strong> cases for coastal and inland points was completed to help define<br />
probability thresholds needed for <strong>the</strong> WFO local application per item (2). Results from that study<br />
were presented last year, and will be very briefly summarized.<br />
Four refinements to <strong>the</strong> MC model code were also proposed. These include (1) A procedure to<br />
adjust <strong>the</strong> model time step for fast moving and small storms; (2) Modification <strong>of</strong> <strong>the</strong> azimuthal<br />
interpolation routine that occasionally leads to inconsistent probability values for 34, 50, and 64<br />
kt winds; (3) Evaluation <strong>of</strong> <strong>the</strong> spatial interpolation method that sometimes results in<br />
inconsistencies between <strong>the</strong> gridded and text probabilities; (4) Evaluation <strong>of</strong> <strong>the</strong> underlying wind<br />
radii model utilized by <strong>the</strong> MC model. Results from items (1) and (4) were presented last year, so<br />
<strong>the</strong> emphasis will be on results from (2) and (3).<br />
DISCLAIMER: The views, opinions, and findings in this report are those <strong>of</strong> <strong>the</strong> authors and<br />
should not be construed as an <strong>of</strong>ficial NOAA and/or U.S. Government position, policy, or<br />
decision.<br />
Session 12 – Page 4
A New Secondary Eyewall Formation Index; Transition to Operations and Quantification<br />
<strong>of</strong> Associated Hurricane Intensity and Structure Changes<br />
A Joint Hurricane Testbed Project (Year 2)<br />
Jim Kossin 1,2 , Matt Sitkowski 2,3 , and Chris Roz<strong>of</strong>f 2<br />
(james.kossin@noaa.gov)<br />
1 NOAA/NCDC, Asheville, NC; 2 Cooperative Institute for Meteorological Satellite Studies<br />
(CIMSS), University <strong>of</strong> Wisconsin; 3 Department <strong>of</strong> Atmospheric and Oceanic Sciences,<br />
University <strong>of</strong> Wisconsin<br />
Eyewall replacement cycles in hurricanes are generally associated with rapid and dramatic<br />
changes in wind structure and intensity. While <strong>the</strong> intensity fluctuations are usually transient and<br />
<strong>of</strong> particular concern when storms are near land, <strong>the</strong> broadening <strong>of</strong> <strong>the</strong> wind-field tends to be a<br />
long-lived change that has substantial impacts on shipping and marine interests because <strong>of</strong> <strong>the</strong><br />
associated increases in wave height, storm surge, and radius <strong>of</strong> 50 kt wind (R50). In fact, eyewall<br />
replacement cycles represent a highly efficient (and easily identifiable) pathway to storm growth.<br />
Despite <strong>the</strong> implications and known impacts <strong>of</strong> eyewall replacement cycles, objective tools to<br />
forecast <strong>the</strong>se events were not available prior to <strong>the</strong> 2010 hurricane season. Consequently,<br />
forecasters have relied on subjective methods for estimating <strong>the</strong> onset <strong>of</strong> <strong>the</strong>se events and<br />
adjusting intensity forecasts accordingly.<br />
In Year-1 <strong>of</strong> this Joint Hurricane Testbed project we transitioned a new objective model into<br />
operations at <strong>the</strong> National Hurricane Center, and <strong>the</strong> model was run in a real-time experimental<br />
mode during <strong>the</strong> 2010 season. The model provides probability <strong>of</strong> onset <strong>of</strong> an eyewall<br />
replacement cycle out to 48 hours based on observed and forecast environmental features and<br />
observed storm features (as measured with GOES infrared imagers). In <strong>the</strong> first part <strong>of</strong> this<br />
presentation, we will verify <strong>the</strong> model performance and skill for <strong>the</strong> 2010 season.<br />
In <strong>the</strong> ongoing Year-2 <strong>of</strong> this project, we are constructing and documenting <strong>the</strong> first general<br />
climatology <strong>of</strong> intensity and structure changes associated with eyewall replacement cycles. This<br />
climatology is based on low-level aircraft reconnaissance data and is being utilized to construct<br />
additional objective forecast tools. These tools will provide prognostic information about <strong>the</strong><br />
most likely intensity evolution based on measured environmental and storm features with <strong>the</strong><br />
primary goal <strong>of</strong> reducing intensity forecast error. Recent results <strong>of</strong> this part <strong>of</strong> <strong>the</strong> project will be<br />
introduced in <strong>the</strong> second part <strong>of</strong> this presentation.<br />
Session 12 – Page 5
ATCF Requirements, Intensity Consensus and Sea Heights Consistent with NHC Forecasts<br />
(Year 2)<br />
Charles R. Sampson 1 , Ann Schrader 1 , Efren Serra 1 , Paul Wittmann 2 , Hendrik Tolman 3 , Chris<br />
Sisko 4 , Chris Lauer 4 , Jessica Schauer 4 , John Knaff 5 , Mark DeMaria 5 , Andrea Schumacher 5<br />
(sampson@nrlmry.navy.mil)<br />
1 NRL; 2 FNMOC; 3 NOAA/NCEP; 4 NHC; 5 CIRA<br />
The Automated Tropical Cyclone Forecasting System (ATCF) is one <strong>of</strong> <strong>the</strong> core forecast<br />
systems at U.S. tropical cyclone forecast centers and has now been in operations at <strong>the</strong> NHC for<br />
twenty years. Modifications to <strong>the</strong> ATCF are relatively inexpensive, making it a preferred target<br />
platform for Joint Hurricane Testbed and Hurricane Forecast Improvement Project (HFIP)<br />
products and algorithms. This talk reviews progress in <strong>the</strong> second and final year <strong>of</strong> this ATCFfocused<br />
JHT project. The three parts <strong>of</strong> this project are to: 1) Address NHC User Requirements,<br />
2) perform studies with intensity consensus aids, and 3) to run real-time, evaluate and possibly<br />
implement an algorithm to produce sea heights consistent with NHC forecasts. This JHT project<br />
is on schedule. Additional funding for improvements to <strong>the</strong> ATCF in 2011 and beyond comes<br />
courtesy <strong>of</strong> HFIP.<br />
The views, opinions, and findings contained in this report are those <strong>of</strong> <strong>the</strong> authors and should not<br />
be construed as an <strong>of</strong>ficial National Oceanic and Atmospheric Administration or U.S.<br />
government position, policy, or decision.<br />
Session 12 – Page 6
Atlantic Warm Pool SST Bias in HYCOM<br />
Chunzai Wang 1 and Sang-Ki Lee 1,2<br />
(Chunzai.Wang@noaa.gov)<br />
1 NOAA/AOML; 2 CIMAS/University <strong>of</strong> Miami<br />
The rationale for this study is <strong>the</strong> recent scientific finding that <strong>the</strong> Atlantic warm pool (AWP)<br />
- a large body <strong>of</strong> warm water comprised <strong>of</strong> <strong>the</strong> Gulf <strong>of</strong> Mexico, <strong>the</strong> Caribbean Sea, and <strong>the</strong><br />
western tropical North Atlantic - may add a value to improving <strong>the</strong> simulation <strong>of</strong> Atlantic<br />
tropical cyclone (TC) in operational hurricane forecast models. In particular, recent studies using<br />
both observations and models have shown that a large AWP reduces <strong>the</strong> vertical wind shear and<br />
increases <strong>the</strong> convective available potential energy over <strong>the</strong> main development region for<br />
Atlantic hurricanes, and thus facilitates <strong>the</strong> formation and development <strong>of</strong> Atlantic TCs.<br />
Therefore, our ultimate goal is to improve <strong>the</strong> forecast <strong>of</strong> <strong>the</strong> formation and intensification <strong>of</strong><br />
Atlantic hurricanes in NCEP/EMC operational models, by improving <strong>the</strong> simulations <strong>of</strong> <strong>the</strong><br />
AWP in that model during <strong>the</strong> Atlantic hurricane season <strong>of</strong> June to November.<br />
In order to evaluate <strong>the</strong> simulation <strong>of</strong> <strong>the</strong> AWP in HYCOM, which is <strong>the</strong> ocean model<br />
component <strong>of</strong> <strong>the</strong> NCEP/EMC operational models, we have setup HYCOM for <strong>the</strong> Atlantic<br />
domain between 20 o S and 70 o N using RTOFS-Atlantic, <strong>the</strong> NCEP/EMC operational ocean<br />
model, as <strong>the</strong> basic platform. The HYCOM is <strong>the</strong>rmally coupled to an Atmospheric Mixed layer<br />
Model (AML) to allow physically more realistic <strong>the</strong>rmal interactions at <strong>the</strong> air-sea interface, thus<br />
to minimize <strong>the</strong>rmodynamic inconsistency at <strong>the</strong> air-sea interface. Our major finding is that <strong>the</strong><br />
HYCOM tends to create a large cold bias in <strong>the</strong> AWP region due to its inherent oceanic heat flux<br />
errors. Although <strong>the</strong> overall time evolution <strong>of</strong> <strong>the</strong> AWP bias is quite slow, a large cold SST bias<br />
with persistent spatial structure may emerge during a 5-day forecast, during which <strong>the</strong> RTOFS is<br />
not initialized. An important implication is that, since <strong>the</strong> RTOFS is used to initialize <strong>the</strong><br />
NCEP/EMC operational hurricane forecast model, <strong>the</strong> cold AWP SST bias can be introduced to<br />
<strong>the</strong> hurricane forecast model and thus negatively affect <strong>the</strong> hurricane forecast.<br />
Session 12 – Page 7
Tools for Coordinating Aircraft During Hurricane Field Campaigns<br />
Rich Blakeslee 1 , Michael Goodman 1 , John Hall 2 , Matt He 2 , Paul Meyer 1 , Michelle Garrett 2 ,<br />
Kathryn Regner 2 , Helen Conover 2 , Tammy Smith 2<br />
(richard.blakeslee@nasa.gov)<br />
1 National Aeronautics and Space Administration; 2 University <strong>of</strong> Alabama in Huntsville<br />
The NASA Real Time Mission Monitor (RTMM) is a situational awareness decision-support<br />
tool that integrates real time aircraft tracks, waypoints, satellite imagery, radar products, surface<br />
observations, model output parameters and airborne remote sensing variables in an easy to use<br />
and view web-based application. RTMM enables real time decision-making for mission<br />
scientists, pilots, mission managers, instrument scientists and program managers by providing<br />
up-to-date information about <strong>the</strong> wea<strong>the</strong>r, spacecraft, and <strong>the</strong> location, altitude and heading <strong>of</strong><br />
<strong>the</strong> aircraft.<br />
The Real Time Mission Monitor optimizes both airborne science experimental field campaigns<br />
and operational science aircraft missions. The second-generation version <strong>of</strong> RTMM is now fully<br />
integrated into a web browser portal and no longer relies on <strong>the</strong> standalone Google Earth<br />
application. The implementation in a web browser makes it easy for any authorized user<br />
anywhere with an Internet connection to follow and coordinate aircraft tracking during dynamic<br />
hurricane aircraft missions.<br />
The Real Time Mission Monitor is a proven tool having been used in many field experiments<br />
from arctic forest fire missions to soil moisture mapping as well as tracking <strong>the</strong> BP Gulf Oil spill.<br />
In <strong>the</strong> summer <strong>of</strong> 2010, RTMM was integral to <strong>the</strong> success <strong>of</strong> <strong>the</strong> PREDICT, GRIP, and IFEX<br />
coordinated manned and unmanned hurricane flights. An overview <strong>of</strong> <strong>the</strong> use <strong>of</strong> RTMM during<br />
<strong>the</strong> 2010 hurricane flights, its planned usage in 2011 and potential future manned and unmanned<br />
aircraft flights will be described. RTMM animations <strong>of</strong> <strong>the</strong> 2010 hurricane flights and<br />
demonstrations <strong>of</strong> RTMM and <strong>the</strong> pre-flight waypoint planning tool will be provided.<br />
Session 12 – Page 8
P<br />
O<br />
S<br />
T<br />
E<br />
R<br />
Poster Session<br />
S<br />
E<br />
S<br />
S<br />
I<br />
O<br />
N
Real-time radar processing in <strong>the</strong> 2010 Hurricane Season and plans for 2011<br />
John F. Gamache<br />
(John.Gamache@noaa.gov)<br />
NOAA/AOML/Hurricane Research Division<br />
During <strong>the</strong> 2010 Hurricane Season <strong>the</strong>re were milestones achieved concerning <strong>the</strong> NOAA WP-<br />
3D airborne tail Doppler radar (TDR) and its use to help initialize <strong>the</strong> Hurricane Wea<strong>the</strong>r<br />
Research and Forecasting Model (HWRF). One milestone was <strong>the</strong> use <strong>of</strong> <strong>the</strong> data in <strong>the</strong><br />
experimental version <strong>of</strong> <strong>the</strong> HWRF model a number <strong>of</strong> times during <strong>the</strong> season. Ano<strong>the</strong>r was <strong>the</strong><br />
first assimilation <strong>of</strong> data in a parallel run <strong>of</strong> <strong>the</strong> operational HWRF during Hurricane Tomas. To<br />
accomplish <strong>the</strong> latter assimilation, several organizations worked to complete <strong>the</strong> construction and<br />
test <strong>the</strong> operation <strong>of</strong> <strong>the</strong> data pipeline from <strong>the</strong> P3 TDR, consisting <strong>of</strong> <strong>the</strong> processing,<br />
compression, and transmission <strong>of</strong> <strong>the</strong> quality-controlled Doppler-radial velocity data via <strong>the</strong><br />
Aircraft Operations Center (AOC) to NCEP Central Operations (NCO). We will report briefly<br />
on <strong>the</strong> nature <strong>of</strong> this pipeline, and <strong>the</strong> success and problems encountered during <strong>the</strong> season in<br />
processing Doppler data in real time. We will also discuss <strong>the</strong> future plans for <strong>the</strong> radar as <strong>the</strong> P3<br />
radar processing system is changed from an older Sigmet RVP-5 system to <strong>the</strong> RVP-8 system.<br />
Poster Session – Page 1
Real-time Transmission <strong>of</strong> NOAA Tail Doppler Radar Data<br />
J Carswell 1 , P. Chang 2 , M. Mainelli 3 and J. Hill 4<br />
(carswell@remotesensingsolutions.com)<br />
1 Remote Sensing Solutions, 2 NOAA/NESDIS/STAR, 3 NOAA NCEP, 4 NOAA AOC<br />
The NOAA WP-3D aircraft provide X-band Doppler/reflectivity measurements <strong>of</strong> tropical<br />
storms and cyclones. Doppler measurements from volume backscatter precipitation pr<strong>of</strong>iles can<br />
provide critical observations <strong>of</strong> <strong>the</strong> horizontal winds as <strong>the</strong> precipitation advects with <strong>the</strong>se<br />
winds. In 2010, NOAA NESDIS, NOAA AOC and Remote Sensing Solutions teamed to capture<br />
<strong>the</strong>se pr<strong>of</strong>iles and send <strong>the</strong> radial Doppler pr<strong>of</strong>ile observations to National Wea<strong>the</strong>r Service in<br />
near real-time over satellite communication data link. The design <strong>of</strong> this transmission system<br />
included features to enhance <strong>the</strong> reliability and robustness <strong>of</strong> <strong>the</strong> data flow from <strong>the</strong> P-3 aircraft<br />
to <strong>the</strong> end user. The end objective is to provide <strong>the</strong>se Doppler pr<strong>of</strong>iles in a routine fashion to<br />
NWS and o<strong>the</strong>rs in <strong>the</strong> forecasting community for operational utilization in support <strong>of</strong> hurricane<br />
forecasting and warning.<br />
In this paper we present an overview <strong>of</strong> this work, accomplishments that were achieved in 2010<br />
and discuss plans for 2011 hurricane season.<br />
Poster Session – Page 2
Improved Hurricane-force Surface Winds and Rain Rate Retrievals<br />
with <strong>the</strong> Step Frequency Microwave Radiometer<br />
J Carswell 1 , P. Chang 2 , Z. Jelenak 2 and S. Frasier 3<br />
(carswell@remotesensingsolutions.com)<br />
1 Remote Sensing Solutions, 2 NOAA/NESDIS/STAR, 3 University <strong>of</strong> Massachusetts<br />
With <strong>the</strong> operational deployment <strong>of</strong> <strong>the</strong> Stepped Frequency Microwave Radiometer (SFMR),<br />
hurricane reconnaissance and research aircraft provide near real-time observations <strong>of</strong> <strong>the</strong> 10-m<br />
ocean surface wind speed both within and around tropical storms and cyclones. These data are<br />
used by hurricane specialists to assist in determining wind radii and maximum sustained winds -<br />
critical parameters for determining and issuing watches and warnings. These observations are<br />
also used for post storm analysis, model validation, and even ground truth for future satellitebased<br />
wind sensors. It is <strong>the</strong>refore imperative that any errors in <strong>the</strong>se observations be understood<br />
and reduced as much as possible.<br />
In previous studies, SFMR rain retrievals have been shown to exhibit a bias <strong>of</strong> 5 mm/hr and to<br />
under report <strong>the</strong> rain rate, suggesting that <strong>the</strong> SFMR rain absorption model requires<br />
improvement. To address this, we present fur<strong>the</strong>r studies documenting <strong>the</strong> problem, as well as a<br />
new rain absorption model. Using this new model in <strong>the</strong> SFMR retrieval process, significant<br />
improvements in both <strong>the</strong> wind speed and rain rate retrievals are achieved.<br />
Poster Session – Page 3
Collocated ASOS and WSR-88D Depict Collapsing Core and Maximum Wind Gust at<br />
Melbourne FL in <strong>the</strong> Eyewall <strong>of</strong> Hurricane Erin (1995)<br />
Keith G. Blackwell<br />
(kblackwell@usouthal.edu)<br />
Coastal Wea<strong>the</strong>r Research Center and<br />
Center for Hurricane Intensity and Landfalls Investigations (CHILI)<br />
Department <strong>of</strong> Earth Sciences, University <strong>of</strong> South Alabama<br />
Landfalling tropical cyclones <strong>of</strong>ten contain collapsing cores <strong>of</strong> heavy precipitation within <strong>the</strong>ir<br />
eyewalls. Several studies indicate <strong>the</strong> likely linkage between downburst-like features and strong<br />
wind gusts in hurricane eyewalls; however, very few surface-based measurements <strong>of</strong> winds<br />
associated with <strong>the</strong>se features actually exist. In <strong>the</strong>se studies, National Wea<strong>the</strong>r Service WSR-<br />
88D Archive Level II data were analyzed in search <strong>of</strong> elevated reflectivity regions exceeding 50<br />
dBZ and <strong>the</strong>n temporally examined for signs <strong>of</strong> vertical collapse, in some cases near or over<br />
surface wind observation sites.<br />
Holmes et al. (2006) presented an introductory glimpse into collapsing precipitation cores in<br />
hurricanes Ivan and Katrina; however no surface wind measurements were available in those<br />
areas to verify <strong>the</strong> actual strength <strong>of</strong> <strong>the</strong> wind within those features. Blackwell and Medlin<br />
(2008) produced a radar climatology <strong>of</strong> collapsing core frequency within all U.S. landfalling<br />
hurricane eyewalls between 1994 and 2007. This climatological study found that some storms<br />
were almost completely void <strong>of</strong> heavy eyewall convection and collapsing cores, whereby o<strong>the</strong>rs<br />
contained extremely prolific activity. One <strong>of</strong> <strong>the</strong> most prolific collapsing core producers was<br />
Hurricane Danny (1997) in Mobile Bay, AL. Blackwell (2009) presented an example <strong>of</strong> a<br />
possible collapsing core within Danny’s eyewall which produced a wind gust <strong>of</strong> 45 m s -1 (101<br />
mph) at <strong>the</strong> C-MAN station on Dauphin Island, AL. Blackwell et al. (2010) detailed ano<strong>the</strong>r<br />
collapsing core event in a spiral band <strong>of</strong> Hurricane Katrina which produced a reported wind gust<br />
to 122 mph on a docked ship and significant damage along <strong>the</strong> Mobile AL waterfront.<br />
In each <strong>of</strong> <strong>the</strong> above studies, surface wind measurements were sparse or nonexistent and none<br />
were collocated with <strong>the</strong> radar location; thus, near-surface radar information was not available<br />
near <strong>the</strong> surface observation. The current study depicts a collapsing core eyewall event in which<br />
<strong>the</strong> radar and wind observation sites are collocated, providing low-level radar detail. Melbourne,<br />
FL (KMLB) experienced <strong>the</strong> nor<strong>the</strong>astern eyewall <strong>of</strong> landfalling category 1 Hurricane Erin<br />
(1995) in <strong>the</strong> predawn hours <strong>of</strong> 2 August 1995. A large convective core <strong>of</strong> >50 dBZ reflectivity<br />
experienced a collapse from above 3000 m (~10,000 ft) to <strong>the</strong> surface as it approached and swept<br />
across <strong>the</strong> ASOS station. A hurricane-force wind gust <strong>of</strong> 34 m s -1 (76 mph) occurred with <strong>the</strong><br />
passage <strong>of</strong> this feature, representing <strong>the</strong> highest wind measured at that location during <strong>the</strong> storm.<br />
The adjacent WSR-88D clearly shows <strong>the</strong> descending reflectivity core and acceleration <strong>of</strong> <strong>the</strong><br />
near-surface winds as <strong>the</strong> feature approaches. The collocation <strong>of</strong> Doppler radar and surface wind<br />
measurements make this a unique and interesting event for study and clearly links a collapsing<br />
core with a strong hurricane wind gust. Details will be shown at <strong>the</strong> conference.<br />
Poster Session – Page 4
Wide Swath Radar Altimeter (WSRA) Wave Spectra from Hurricane Ike compared with<br />
WaveWatch III<br />
Ivan PopStefanija 1 , Edward J. Walsh 2<br />
(popstefanija@prosensing.com)<br />
1 ProSensing; 2 NOAA/ESRL/PSD<br />
The WSRA was first deployed aboard <strong>the</strong> NOAA WP-3D hurricane reconnaissance<br />
aircraft during <strong>the</strong> 2008 hurricane season. Raw data ga<strong>the</strong>red during several hurricane<br />
reconnaissance flights was processed into directional ocean wave spectra, demonstrating <strong>the</strong><br />
basic functionality <strong>of</strong> <strong>the</strong> WSRA. During <strong>the</strong> flight into Hurricane Ike on September 11,<br />
sufficient data were collected to provide an overview <strong>of</strong> <strong>the</strong> wave field variation throughout <strong>the</strong><br />
all regions <strong>of</strong> <strong>the</strong> storm.<br />
These WSRA-obtained wave field spectra are compared with <strong>the</strong> WaveWatch III (WW3)<br />
numerical wave model. The WW3 results were provided by Isaac Ginis and Brandon Reichl <strong>of</strong><br />
<strong>the</strong> University <strong>of</strong> Rhode Island. The WW3 wave field spectra were calculated for <strong>the</strong> time 1230<br />
UTC on September 11, which is <strong>the</strong> midpoint <strong>of</strong> <strong>the</strong> 5-hour WSRA raw data acquisition period.<br />
There is generally a good agreement between <strong>the</strong> WSRA observations and <strong>the</strong> WW3 predictions<br />
<strong>of</strong> <strong>the</strong> spatial variation <strong>of</strong> wave height around <strong>the</strong> hurricane. The poster will show segments <strong>of</strong><br />
WSRA wave topography throughout Hurricane Ike, as well as detailed comparisons <strong>of</strong> <strong>the</strong><br />
resulting directional wave spectra with <strong>the</strong> WW3 model predictions.<br />
Poster Session – Page 5
Storm Surge Measurement Potential <strong>of</strong> <strong>the</strong> Wide Swath Radar Altimeter<br />
Ivan PopStefanija 1 , Edward J. Walsh 2<br />
(popstefanija@prosensing.com)<br />
1 ProSensing; 2 NOAA/ESRL/PSD<br />
The Wide Swath Radar Altimeter (WSRA) has <strong>the</strong> potential to provide operational, targeted<br />
measurements <strong>of</strong> storm surge for land-falling hurricanes. The concept <strong>of</strong> airborne measurement<br />
<strong>of</strong> storm surge consists <strong>of</strong> subtracting <strong>the</strong> absolute altitude <strong>of</strong> <strong>the</strong> aircraft determined using <strong>the</strong><br />
Global Positioning System (GPS) from <strong>the</strong> WSRA-measured distance to <strong>the</strong> sea surface. The<br />
result <strong>of</strong> that simple calculation is <strong>the</strong> absolute elevation <strong>of</strong> <strong>the</strong> water for <strong>the</strong> particular point in<br />
time and space. Wright, et al. (2009) demonstrated <strong>the</strong> technique in a research mode using <strong>the</strong><br />
NASA Scanning Radar Altimeter (SRA) which has since been decommissioned.<br />
The absolute range calibration <strong>of</strong> <strong>the</strong> WSRA can be determined and maintained during <strong>the</strong> flights<br />
using tide gauges within Tampa Bay when returning from each operation, as well as flying by<br />
tide gauges in <strong>the</strong> vicinity <strong>of</strong> <strong>the</strong> landfall. The poster examines <strong>the</strong> range accuracy <strong>of</strong> <strong>the</strong> WSRA<br />
and demonstrates <strong>the</strong> absolute calibration technique using a data segment over Tampa Bay when<br />
N42RF was returning from a flight into Hurricane Ike on September, 11 2008. Historical SRA<br />
data are used to demonstrate <strong>the</strong> potential benefits <strong>of</strong> targeted storm surge measurements.<br />
Poster Session – Page 6
Direct Interpretation <strong>of</strong> COSMIC Refractivity Data in <strong>the</strong> Tropical Cyclone Environment<br />
Christopher M. Hill, Patrick J. Fitzpatrick, and Yee Lau<br />
(hillcm@gri.msstate.edu)<br />
Geosystems Research Institute, Mississippi State University, Stennis Space Center, MS<br />
This study continues to explore <strong>the</strong> utility <strong>of</strong> <strong>the</strong> Constellation Observing System for<br />
Meteorology, Ionosphere, and Climate (COSMIC) in measuring moisture in <strong>the</strong> vicinity <strong>of</strong><br />
tropical cyclones. From a formula relating GPS signal refractivity to temperature, pressure, and<br />
vapor pressure (Smith and Weintraub 1953, Kursinski et al. 1995), especially high (low) values<br />
<strong>of</strong> refractivity at a known pressure level correspond to high (low) vapor pressure in a relatively<br />
high temperature environment. The implication is that a relative measure <strong>of</strong> moisture can be<br />
attained with only refractivity at a known pressure level, and without specific knowledge <strong>of</strong><br />
temperature, in a tropical environment. The relation <strong>of</strong> refractivity to tropospheric<br />
<strong>the</strong>rmodynamics fur<strong>the</strong>r yields a critical value <strong>of</strong> refractivity below which water vapor saturation<br />
– and <strong>the</strong>refore clouds – cannot exist at a known pressure level.<br />
The above findings are applied in <strong>the</strong> evaluation <strong>of</strong> a June-September climatology <strong>of</strong> COSMIC<br />
refractivity over <strong>the</strong> tropical and subtropical eastern Atlantic Ocean, as well as in <strong>the</strong> evaluation<br />
<strong>of</strong> individual COSMIC refractivity pr<strong>of</strong>iles with varying proximity to select Atlantic tropical<br />
cyclones. Nomograms relating refractivity to pressure and temperature have been constructed to<br />
assist in <strong>the</strong> determination <strong>of</strong> moisture content for given values <strong>of</strong> refractivity and pressure.<br />
References:<br />
Kursinski, E. R., G. A. Hajj, K. R. Hardy, L. J. Romans, and J. T. Sch<strong>of</strong>ield, 1995: Observing<br />
tropospheric water vapor by radio occultation using <strong>the</strong> Global Positioning System, Geophys.<br />
Res. Lett., 22, 2365–2368, doi:10.1029/95GL02127.<br />
Smith, E. K., and S. Weintraub, 1953: The constants in <strong>the</strong> equation for atmospheric refractivity<br />
index at radio frequencies. Journal <strong>of</strong> Research <strong>of</strong> <strong>the</strong> National Bureau <strong>of</strong> Standards, Vol. 50, p.<br />
39-41.<br />
Poster Session – Page 7
Ocean’s Impact on <strong>the</strong> Intensity <strong>of</strong> Three Recent Typhoons (Fanapi, Malakas, and Megi) –<br />
Results from <strong>the</strong> ITOP Field Experiment<br />
I-I Lin 1 and Peter G. Black<br />
( peter.black.ctr@nrlmry.navy.mil)<br />
1 Department <strong>of</strong> Atmospheric Sciences, National Taiwan University, Taipei, Taiwan;<br />
2 Naval Research Laboratory, Monterey, USA<br />
2<br />
During <strong>the</strong> 20 August to 20 October 2010 ITOP field experiment, three typhoon cases,<br />
Fanapi, Malakas, and Megi were studied. Using airborne C130 dropwindsonde data, C130<br />
AXBT (Airborne Expendable Bathy<strong>the</strong>rmograph) data, in situ upper ocean <strong>the</strong>rmal structure data<br />
from <strong>the</strong> Argo floats, satellite sea surface temperature and altimetry data toge<strong>the</strong>r with an ocean<br />
mixed layer model, <strong>the</strong> impact <strong>of</strong> ocean’s <strong>the</strong>rmal structure to <strong>the</strong> intensity <strong>of</strong> <strong>the</strong>se 3 typhoons<br />
are investigated. It is found that all three typhoons passed over regions <strong>of</strong> similarly warm sea<br />
surface temperature (SST) <strong>of</strong> ~ 29.5 ˚ C. However, much distinction is found in <strong>the</strong> subsurface.<br />
Category-2 Typhoon Malakas passed over region <strong>of</strong> <strong>the</strong> shallowest subsurface warm layer, as<br />
characterised by <strong>the</strong> depth <strong>of</strong> <strong>the</strong> 26 ˚ C iso<strong>the</strong>rm (D26) <strong>of</strong> about 37 -40m and Upper Ocean Heat<br />
Content (UOHC) <strong>of</strong> ~ 38-44 kj/cm 2 . Category-3 typhoon Fanapi passed over region <strong>of</strong> moderate<br />
subsurface warm layer, with D26 <strong>of</strong> ~ 60-70m and UOHC <strong>of</strong> ~ 65-78 kj/cm 2 . Category-5<br />
typhoon Megi passed over region <strong>of</strong> <strong>the</strong> deepest subsurface warm layer, with D26 reaching 124-<br />
132m and UOHC reaching 136-138 kj/cm 2 . It is found that this distinction in <strong>the</strong> subsurface<br />
<strong>the</strong>rmal structure played critical role in <strong>the</strong> intensification <strong>of</strong> <strong>the</strong> three typhoon cases. Due to <strong>the</strong><br />
very deep D26 and high UOHC, very little typhoon-induced ocean cooling negative feedback<br />
(typically < 1˚ C) for Megi was found. This very minimal negative feedback enabled ample air -<br />
sea enthalpy flux supply to support Megi’s intensification. Based on <strong>the</strong> preliminary report from<br />
<strong>the</strong> Joint Typhoon Warning Center (JTWC), Megi’s peak intensity reached 160kts, a very high<br />
intensity not <strong>of</strong>ten observed even for category-5 typhoons. In contrast, though with very warm<br />
pre-typhoon SST <strong>of</strong> ~ 29.5 ˚ C, <strong>the</strong> subsurface ocean condition for Malakas and Fanapi was<br />
much less favourable. As a result, <strong>the</strong> subsurface cold water could be much easily entrained and<br />
upwelled to <strong>the</strong> surface to limit <strong>the</strong> intensification for Malakas and Fanapi. Finally, it was found<br />
that <strong>the</strong> very deep subsurface warm layer and high heat content over <strong>the</strong> region where Megi<br />
passed was about 10-30% higher than <strong>the</strong> climatological values. Preliminary results suggest <strong>the</strong><br />
possible contribution <strong>of</strong> <strong>the</strong> La Nina event in causing such warm anomaly over <strong>the</strong> western North<br />
Pacific in October 2010.<br />
Poster Session – Page 8
Coupled Air-Sea Observations in Tropical Cyclones during ITOP/TCS10<br />
Chiaying Lee and Shuyi S. Chen<br />
RSMAS/University <strong>of</strong> Miami<br />
The effects <strong>of</strong> <strong>the</strong> atmosphere-ocean coupling on tropical cyclone (TC) intensity have been<br />
studied in numerical models with limited air-sea observations. One <strong>of</strong> <strong>the</strong> most challenging<br />
problems in TC intensity forecasting is <strong>the</strong> lack <strong>of</strong> quantitative measure <strong>of</strong> <strong>the</strong> impact <strong>of</strong> air-sea<br />
coupling process on TC structure and intensity change. Observations from ITOP/TCS10<br />
provided a comprehensive data set in TCs with co-located atmospheric and oceanic<br />
measurements across <strong>the</strong> air-sea interface. One <strong>of</strong> <strong>the</strong> main objectives <strong>of</strong> ITOP10/TCS-10 is to<br />
measure air-sea fluxes as well as <strong>the</strong> boundary layer structure using co-located dropsondes and<br />
AXBTs. In this study we compare <strong>the</strong> coupled WRF (CWRF) model simulations <strong>of</strong> typhoons<br />
over <strong>the</strong> West Pacific with <strong>the</strong> ITOP/TCS10 observations to examine <strong>the</strong> presence <strong>of</strong> asymmetry<br />
in surface enthalpy fluxes over <strong>the</strong> storm-induced cold wake region, which causes a relatively<br />
shallow and stable boundary layer. A trajectory and tracer analysis in CWRF indicated that <strong>the</strong><br />
stable boundary layer results in less depletion <strong>of</strong> energy from inflow to convection, and <strong>the</strong>refore<br />
such boundary layer asymmetry has energetic influence on TC intensity and convective<br />
structure. By analyzing <strong>the</strong> dropsondes and AXBTs data from ITOP10/TCS10, we aim to<br />
evaluate/validate coupled model forecasts and fur<strong>the</strong>r test <strong>the</strong> effects <strong>of</strong> air-sea coupling<br />
processes on TC structure and intensity forecasts.<br />
Poster Session – Page 9
Coming soon: AMSU in GEO<br />
Bjorn Lambrigtsen<br />
(lambrigtsen@jpl.nasa.gov)<br />
Jet Propulsion Laboratory, California Institute <strong>of</strong> Technology<br />
As a result <strong>of</strong> NASA’s multi-million dollar investments in <strong>the</strong> development <strong>of</strong> <strong>the</strong> Geostationary<br />
Syn<strong>the</strong>tic Thinned Array Radiometer (GeoSTAR) at <strong>the</strong> Jet Propulsion Laboratory (JPL), <strong>the</strong><br />
technology required to build a geostationary microwave sounder – “AMSU in GEO” – is now<br />
sufficiently mature that a space mission can be initiated. A JPL-led effort is under way to<br />
develop a low-cost GeoSTAR mission under <strong>the</strong> new NASA “Ventures” program in partnership<br />
with NOAA and European colalborators. If a Ventures proposal is successful, <strong>the</strong> development<br />
could start in 2012, and launch as a hosted payload would take place in <strong>the</strong> 2016-2018 time<br />
frame. The exact timing depends on <strong>the</strong> availability <strong>of</strong> hosting oppurtunities. This mission will<br />
be focused on storms in <strong>the</strong> North Atlantic: hurricanes during <strong>the</strong> summer and mid-latitude<br />
storms <strong>the</strong> rest <strong>of</strong> <strong>the</strong> year. With data products ranging from AMSU-equivalent brightness<br />
temperatures to derived temperature, water vapor and reflectivity pr<strong>of</strong>iles, it will be possible to<br />
monitor <strong>the</strong> intensity and structure <strong>of</strong> storms continuously. Hurricane applications range from<br />
real-time detection <strong>of</strong> rapid intensification to accurate estimates <strong>of</strong> vortex location and <strong>the</strong><br />
structure <strong>of</strong> <strong>the</strong> inner core for enhanced forecast initialization, and this mission can contribute<br />
significantly to <strong>the</strong> Hurricane Forecast Improvement Project (HFIP). General numerical wea<strong>the</strong>r<br />
prediction is also expected to benefit from this mission, particularly from precipitation and<br />
height-registered wind-vector products. We discuss <strong>the</strong> status <strong>of</strong> <strong>the</strong> GeoSTAR development,<br />
plans for a Ventures mission, and opportunities to participate.<br />
Copyright 2011 California Institute <strong>of</strong> Technology. Government sponsorship acknowledged.<br />
Poster Session – Page 10
Assimilating COSMIC GPS RO data for Investigating TC<br />
Genesis in <strong>the</strong> Eastern Atlantic Region<br />
Keren Rosado and Sen Chiao<br />
Marine and Environmental Systems<br />
Florida Institute <strong>of</strong> Technology<br />
This study is aimed to investigate <strong>the</strong> impact <strong>of</strong> using Global Positioning System Radio<br />
Occultation (GPS RO) sounding data (i.e., Constellation Observing System for Meteorology,<br />
Ionosphere and Climate; COSMIC) for tropical cyclogenesis research. The Wea<strong>the</strong>r Research<br />
and Forecasting (WRF-ARW) model and <strong>the</strong> WRF data assimilation system (i.e., WRF 3DVAR)<br />
are employed to simulate tropical depression- 8 (i.e., TD-8) <strong>of</strong> 2006 when <strong>the</strong> African Easterly<br />
Wave (AEW) and vortex moved out over <strong>the</strong> Eastern Atlantic (12.5°N–18°W). A noteworthy<br />
feature was that Saharan dust outbreak was also observed during this period, which made this<br />
case more sophisticated. The time frame to be focused is from 1200 UTC 09 to 1200 UTC 12<br />
UTC 12, August 2006. The level 2 wetPrf COSMIC data is adopted in this research. A 72-hr<br />
integration is performed in order to better simulate <strong>the</strong> evolution <strong>of</strong> TD-8. The initial and time<br />
dependent lateral boundary conditions are derived from <strong>the</strong> NCEP final analysis (FNL) data. A<br />
3-domain nested simulation is configured with 30-km, 10-km and 3.3-km horizontal resolutions,<br />
respectively. The simulation results are evaluated using <strong>the</strong> African Monsoon Multidisciplinary<br />
Analysis (AMMA) field experiment as well as NASA TRMM MERG products. Statistical<br />
analyses (e.g., bias, absolute mean error, root mean square errors and correlation coefficients) are<br />
performed for quantitative comparisons. It is anticipated that <strong>the</strong> outcome from this research may<br />
fur<strong>the</strong>r advance our understanding <strong>of</strong> <strong>the</strong> role Saharan Air layer (SAL) in association with<br />
tropical cyclogenesis.<br />
Poster Session – Page 11
Sensitivities <strong>of</strong> air-ocean-wave coupling on <strong>the</strong> prediction <strong>of</strong> Hurricanes Frances and Ivan<br />
Sue Chen 1 , Travis Smith 2 , Saša Gaberšek 1 , Tim Campbell 2 , Shouping Wang 1 , James Doyle 1 , and<br />
Rick Allard 2<br />
1 Marine Science Division, Monterey<br />
2 Oceanography Division, Stennis<br />
Naval Research Laboratory<br />
A series <strong>of</strong> model runs were conducted to exam <strong>the</strong> sensitivities <strong>of</strong> air-ocean-wave coupling on<br />
<strong>the</strong> intensity and structure change <strong>of</strong> hurricanes Frances and Ivan as well as <strong>the</strong> associated ocean<br />
and wave response. The hurricane model used for this study is <strong>the</strong> newly developed six-way airocean-wave<br />
fully coupled COAMPS-TC. The coupling is achieved using <strong>the</strong> Earth System<br />
Modeling Framework to couple <strong>the</strong> COAMPS-TC with <strong>the</strong> Navy Coastal Ocean Model (NCOM)<br />
and Simulating WAves Nearshore (SWAN). Special in situ measurements <strong>of</strong> atmosphere, ocean,<br />
and wave during <strong>the</strong> Coupled Boundary Layer Air-Sea Transfer Experiment (CBLAS) field<br />
campaign sponsored by <strong>the</strong> <strong>Office</strong> <strong>of</strong> Naval Research were used to validate <strong>the</strong> model results.<br />
For <strong>the</strong> simulations <strong>of</strong> Hurricane Frances, it is found using a higher resolution ocean grid<br />
improved <strong>the</strong> magnitude <strong>of</strong> <strong>the</strong> trailing cold sea surface temperature anomaly forced by <strong>the</strong><br />
hurricane. The forecast sea temperature bias below <strong>the</strong> ocean mixed layer was fur<strong>the</strong>r reduced<br />
when <strong>the</strong> high-resolution ocean model initial condition was improved using <strong>the</strong> ocean data<br />
assimilation in <strong>the</strong> ocean spin-up period. In addition, <strong>the</strong> significant wave height bias was<br />
reduced if using <strong>the</strong> level-<strong>of</strong>f wind stress value from CBLAS instead <strong>of</strong> <strong>the</strong> original generation 3<br />
wind source term in SWAN. Including <strong>the</strong> wave feedback to <strong>the</strong> atmosphere also produced a<br />
much higher value <strong>of</strong> momentum drag near <strong>the</strong> eyewall region. The overall intensity and track<br />
forecast differences between <strong>the</strong> uncoupled and various coupled runs (one to six-way coupling)<br />
were found to be as large as 18 m/s and 10 nautical miles, respectively.<br />
For <strong>the</strong> hurricane Ivan study, a special ADCP data array collected by NRL is also used to<br />
evaluate <strong>the</strong> shallow and deep water current response. Including <strong>the</strong> wave Stokes’s drift, wave<br />
radiation stress, and wave bottom stress feedback improved <strong>the</strong> complex correlation coefficients<br />
and mean directional error for <strong>the</strong> ocean current. The wave spectrum comparison between<br />
SWAN and Scanning Radar Altimeter showed SWAN generated too much energy in long waves<br />
which in turns produced a larger significant wave height bias. These preliminary results indicate<br />
a more consistent treatment <strong>of</strong> momentum stress, sensible heat flux, and latent heat flux at <strong>the</strong><br />
air-sea interface may be needed in order to improve <strong>the</strong> forecast <strong>of</strong> <strong>the</strong> hurricane environment.<br />
The development <strong>of</strong> a new unified air-sea interface module jointly with NOAA, University <strong>of</strong><br />
Miami, and University <strong>of</strong> Rhode Island founded by National Oceanographic Partnership <strong>Program</strong><br />
is discussed.<br />
Poster Session – Page 12
Developing an Atlantic Ocean initialization based on <strong>the</strong> Navy Coupled Ocean Data<br />
Assimilation (NCODA) product for <strong>the</strong> operational GFDL and GFDN hurricane models<br />
Richard Yablonsky, Isaac Ginis, Seunghyon Lee, and Biju Thomas<br />
(ryablonsky@gso.uri.edu)<br />
Graduate School <strong>of</strong> Oceanography, University <strong>of</strong> Rhode Island<br />
Currently, NOAA’s operational GFDL hurricane model and <strong>the</strong> U.S. Navy’s operational GFDN<br />
hurricane model use a feature-based modeling technique along with <strong>the</strong> U.S. Navy’s Global Data<br />
Environmental Model (GDEM) monthly climatology for ocean initialization in <strong>the</strong> western<br />
North Atlantic basin. In o<strong>the</strong>r worldwide ocean basins, <strong>the</strong> GFDN hurricane model uses <strong>the</strong><br />
Navy Coupled Ocean Data Assimilation (NCODA) daily product for ocean initialization. Here,<br />
we will discuss <strong>the</strong> development an NCODA-based ocean initialization for <strong>the</strong> western North<br />
Atlantic basin and evaluate its performance against <strong>the</strong> feature-based/GDEM initialization with<br />
<strong>the</strong> ultimate goal <strong>of</strong> determining whe<strong>the</strong>r or not it is advantageous to replace <strong>the</strong> featurebased/GDEM<br />
initialization with <strong>the</strong> NCODA-based initialization in <strong>the</strong> Atlantic basin in <strong>the</strong><br />
GFDL and/or GFDN hurricane models.<br />
Poster Session – Page 13
Spatial Verification <strong>of</strong> Tropical Cyclone Model Track and Intensity Forecasts<br />
Timothy Marchok 1 and Arielle Alpert 2<br />
(timothy.marchok@noaa.gov)<br />
1 NOAA / GFDL; 2 Johns Hopkins University<br />
One component that is critical to <strong>the</strong> development <strong>of</strong> tropical cyclone modeling is <strong>the</strong> evaluation<br />
and verification <strong>of</strong> model forecasts. Models that perform well for track forecasting may or may<br />
not perform well for intensity forecasting, and vice versa. Likewise, a model that performs well<br />
in one ocean basin may have difficulty in ano<strong>the</strong>r. In addition, even within a given ocean basin,<br />
<strong>the</strong>re may be subregions within that basin where a model may exhibit better track or intensity<br />
forecasting skill. In this poster, we examine <strong>the</strong> spatial variability <strong>of</strong> track and intensity forecast<br />
performance within <strong>the</strong> Atlantic Basin for forecasts from various operational regional and global<br />
models for <strong>the</strong> 2006-2009 hurricane seasons.<br />
We present results for several different types <strong>of</strong> analyses. Due to <strong>the</strong> varying density <strong>of</strong> forecast<br />
track points across <strong>the</strong> basin, we performed Barnes analyses for model errors and biases in order<br />
to spatially smooth <strong>the</strong> data. Spatial error plots derived from <strong>the</strong>se analyses are shown which<br />
may be used for a qualitative overview, highlighting key areas <strong>of</strong> error among models. In<br />
addition, quantitative analyses are also included that detail track and intensity forecast<br />
performance over four subregions within <strong>the</strong> Atlantic Basin. Finally, we present results from an<br />
outlier analysis that determines, for each model, <strong>the</strong> geographic locations <strong>of</strong> two-, three- and<br />
four-sigma track and intensity forecast errors. Results from <strong>the</strong>se analyses may help forecasters<br />
and model developers alike to better understand some <strong>of</strong> <strong>the</strong> biases that exist in <strong>the</strong> various<br />
models.<br />
Poster Session – Page 14
Improving Ocean Model Performance in Coupled Hurricane Forecasts through Improved<br />
Initialization<br />
George R. Halliwell 1 , Lynn K. Shay 2 , Debra Willey 3 , Jodi Brewster 2 , Benjamin Jaimes 2 , Gustavo<br />
Goni 1<br />
(George.Halliwell@noaa.gov)<br />
1 Physical Oceanography Division, NOAA, Atlantic Oceanographic and Meteorological<br />
Laboratory<br />
2 Division <strong>of</strong> Meteorology and Physical Oceanography, RSMAS, University <strong>of</strong> Miami<br />
3 Cooperative Institute <strong>of</strong> Marine and Atmospheric Studies, University <strong>of</strong> Miami<br />
4 NOAA, Atlantic Oceanographic and Meteorological Laboratory<br />
The goal <strong>of</strong> <strong>the</strong> Shay-Halliwell JHT project is to improve <strong>the</strong> performance <strong>of</strong> ocean models<br />
for coupled hurricane forecasting. This goal will be achieved by improving <strong>the</strong> accuracy <strong>of</strong> ocean<br />
model initialization and improving ocean model physics and numerics. Based on our prior work,<br />
forecast SST depends so strongly on initialization accuracy that evaluation <strong>of</strong> ocean model<br />
upgrades cannot be reliably performed until significant initialization improvements are made.<br />
Candidate products that can be used to initialize ocean models include several real-time dataassimilative<br />
ocean analyses along with syn<strong>the</strong>tic upper-ocean temperature-salinity analyses<br />
derived from satellite observations (altimetry and SST). Unfortunately, evaluation and<br />
identification <strong>of</strong> optimum initialization products has been hindered by <strong>the</strong> relative lack <strong>of</strong> threedimensional<br />
synoptic observations <strong>of</strong> <strong>the</strong> ocean in comparison to <strong>the</strong> atmosphere.<br />
An unprecedented set <strong>of</strong> ocean observations was collected in <strong>the</strong> eastern Gulf <strong>of</strong> Mexico<br />
during spring and summer 2010 in response to <strong>the</strong> Deepwater Horizon oil spill. Nine synoptic<br />
surveys from a NOAA P-3 hurricane research aircraft were conducted by NOAA and<br />
UM/RSMAS between 8 May and 9 July, deploying AXBTs, AXCTDs, and AXCPs.<br />
NOAA/AOML and o<strong>the</strong>r institutions conducted extensive in-situ surveys <strong>of</strong> upper-ocean<br />
temperature, salinity, and currents on cruises. NOAA/AOML produced satellite-derived products<br />
(e.g. SST, SSH, surface currents) and also deployed surface drifters to provide surface<br />
measurements and track Lagrangian trajectories. An extensive set <strong>of</strong> moored observations was<br />
collected by <strong>the</strong> Minerals Management Service. This unprecedented regional dataset will enable<br />
a high-quality evaluation <strong>of</strong> potential ocean initialization products to be performed in a<br />
dynamically active region.<br />
In this presentation, six different products are evaluated, including three HYCOM analyses<br />
(Navy 0.08° global, Navy 0.04° GoM, NOAA/NCEP Atlantic RTOFS) and three o<strong>the</strong>r model<br />
types (NRL IASNFC NCOM, NCSU SABGOM ROMS, and NOAA/NOS NGOM POM).<br />
Evaluation <strong>of</strong> <strong>the</strong>se products through comparison to P-3 pr<strong>of</strong>iles and AOML cruise observations<br />
demonstrates that <strong>the</strong> Navy HYCOM products consistently display <strong>the</strong> smallest bias and RMS<br />
errors relative to observations. In contrast, <strong>the</strong> NOAA/EMC RTOFS HYCOM displayed <strong>the</strong><br />
largest bias and RMS errors as a result <strong>of</strong> known code problems. This problem has negatively<br />
impacted development <strong>of</strong> <strong>the</strong> HYCOM-HWRF coupled forecast model that uses RTOFS to<br />
provide initial fields. Fortunately, this problem should be cured when <strong>the</strong> planned transition <strong>of</strong><br />
RTOFS HYCOM to <strong>the</strong> Navy global HYCOM system at EMC occurs during 2011. As <strong>of</strong> this<br />
writing, <strong>the</strong> Navy global HYCOM system produces <strong>the</strong> smallest bias and RMS errors compared<br />
to observations in <strong>the</strong> eastern Gulf <strong>of</strong> Mexico.<br />
Poster Session – Page 15
Validation <strong>of</strong> Coupled Hurricane Atmosphere – Ocean Model (HyHWRF)<br />
Hyun-Sook Kim, D. Iredell, Y. Kwon, L. Liu, Q. Liu, C. Lozano, J. O’Connor, J. Sims, V.<br />
Tallapragada, B. Tuleya, Z. Zhan<br />
(hyun.sook.kim@noaa.gov)<br />
NOAA/NCEP/EMC<br />
Under a goal toward <strong>the</strong> next generation <strong>of</strong> operational HWRF (Hurricane Wea<strong>the</strong>r<br />
Research Forecasting) Model, a collaboration effort has been made for <strong>the</strong> past years between<br />
<strong>the</strong> Marine Modeling and Analysis Branch and HWRF teams to build a framework <strong>of</strong> state-<strong>of</strong><strong>the</strong>-art<br />
hurricane prediction model. HyHWRF includes air-sea interactive processes explicitly by<br />
coupling <strong>the</strong> atmospheric hurricane model HWRF to <strong>the</strong> ocean model HYCOM. In addition to<br />
<strong>the</strong> necessity <strong>of</strong> adopting physics-driven ocean model to provide a better realization <strong>of</strong> mesoscale<br />
sea surface temperature, for example, a motivation <strong>of</strong> <strong>the</strong> effort is to utilize unique leverage<br />
that is <strong>of</strong>fered by our organization NCEP (National Centers for Environmental Prediction). The<br />
hurricane HYCOM is nested to eddy-resolving, Atlantic basin model, RTOFS (Real-Time Ocean<br />
Forecast System). NCEP runs RTOFS daily in real-time, using data assimilation including<br />
remote-sensing, in-situ and moored measurements, and generates ocean products such as sea<br />
surface temperature and sub-ocean properties. This infrastructure provides tremendous efficiency<br />
to coupled system in running in real-time, owing to streamline supply <strong>of</strong> initial and boundary<br />
conditions.<br />
Since <strong>the</strong> HyHWRF system has reached to a maturity in 2008, hundreds <strong>of</strong> <strong>the</strong> Atlantic<br />
tropical cyclone (TC) predictions have been performed. Also have been conducted in parallel to<br />
operational HWRF real-time forecast and operational implementation test each year. The results<br />
exhibit a comparable or better forecast skill to operational HWRF. This poster documents<br />
validation <strong>of</strong> ocean simulations. Sea surface temperature, upper ocean structure as well as ocean<br />
cooling are evaluated against available data including AXBT (Airborne eXpendable Bathy<br />
Thermograph), AVHRR and AMSR-E remote-sensing data.<br />
Poster Session – Page 16
HWRF Model Diagnostic Improvements<br />
Janna O’Connor and Vijay Tallapragada<br />
(janna.oconnor@noaa.gov)<br />
NOAA/NCEP/EMC<br />
The hurricane team at EMC works to continually improve <strong>the</strong> HWRF model for each<br />
hurricane season. A crucial way <strong>of</strong> determining model behavior and potential areas <strong>of</strong><br />
improvement is through <strong>the</strong> HWRF diagnostics suite. The evolution <strong>of</strong> <strong>the</strong> HWRF model<br />
diagnostics will be detailed, specifically <strong>the</strong> previous season’s inclusion <strong>of</strong> model-simulated<br />
GOES infrared and water vapor images. Potential upgrades for <strong>the</strong> 2011 hurricane season are<br />
described and involve a diagnostic module comparing three models side by side through vertical<br />
cross sections <strong>of</strong> relative humidity and wind speed, streamlines, and surface winds. The use <strong>of</strong> a<br />
new module that retrieves relevant pressure level data from model grib files and inserts <strong>the</strong>m into<br />
an easy-to-read text file will also be explained. These upgrades coupled with <strong>the</strong> HWRF realtime<br />
statistics website will provide a new basis to assess model behavior and pinpoint areas <strong>of</strong><br />
improvement with <strong>the</strong> goal <strong>of</strong> making HWRF updates more efficient and effective.<br />
Poster Session – Page 17
Evaluating Experimental Models for Tropical Cyclone Forecasting in Support <strong>of</strong> <strong>the</strong><br />
Hurricane Forecast Improvement Project (HFIP)<br />
Paul A. Kucera, Barb G. Brown, Louisa Nance, Christopher L. Williams, Kathryn Crosby, and<br />
Michelle Harrold<br />
(pkucera@ucar.edu)<br />
National Center for Atmospheric Research/ Research Applications Laboratory<br />
In 2009, <strong>the</strong> National Center for Atmospheric Science (NCAR)/Research Applications<br />
Laboratory’s (RALs) Joint Numerical Testbed (JNT) <strong>Program</strong> formed a new entity called <strong>the</strong><br />
Tropical Cyclone Modeling Team (TCMT). The focus <strong>of</strong> this team is testing and evaluation <strong>of</strong><br />
experimental models for tropical cyclone forecasting. TCMT evaluations may include models<br />
that are ei<strong>the</strong>r in earlier stages <strong>of</strong> development or may not be intended for future operational<br />
application in <strong>the</strong> U.S. Much <strong>of</strong> this effort is sponsored by NOAA's Hurricane Forecast<br />
Improvement Project (HFIP). For <strong>the</strong> HFIP, <strong>the</strong> TCMT designs model evaluation experiments<br />
and provides general testing and evaluation <strong>of</strong> <strong>the</strong> various forecast models included in <strong>the</strong> HFIP<br />
annual forecasting demonstrations and retrospective experiments. Utilizing staff expertise in<br />
forecast verification, statistics, and atmospheric sciences, <strong>the</strong> TCMT is developing statistical<br />
approaches that are appropriate for evaluating a variety <strong>of</strong> tropical cyclone forecast attributes.<br />
These methods include new diagnostic tools to aid, for example, in <strong>the</strong> evaluation <strong>of</strong> track and<br />
intensity errors, precipitation and tropical cyclone structure forecasts. The TCMT also supports<br />
HFIP through o<strong>the</strong>r activities such as communicating results and providing a repository <strong>of</strong> model<br />
output and diagnostic information through a web-based data service site. The data service site<br />
will include model forecasts and some observational datasets as well as links and pointers to<br />
additional observational datasets. During 2010, <strong>the</strong> TCMT conducted an evaluation <strong>of</strong> a suite <strong>of</strong><br />
experimental models that were candidates for future inclusion into <strong>the</strong> operational forecasting<br />
system at <strong>the</strong> National Hurricane Center (NHC). This retrospective analysis was conducted<br />
using a subset storms selected by NHC from <strong>the</strong> 2008 and 2009 tropical storms and hurricanes<br />
observed in <strong>the</strong> Atlantic and Eastern Pacific basins. In summary, <strong>the</strong> TCMT focuses on<br />
developing new methods for <strong>the</strong> evaluation <strong>of</strong> hurricanes, on <strong>the</strong> evaluation <strong>of</strong> experimental<br />
model forecasts for <strong>the</strong> annual HFIP retrospective and demonstration experiments, and on<br />
developing a hurricane database from <strong>the</strong>se studies. An overview <strong>of</strong> TCMT activities along<br />
with a summary <strong>of</strong> results from <strong>the</strong> 2010 retrospective analysis will be given in <strong>the</strong> presentation.<br />
Poster Session – Page 18
A highly configurable vortex initialization method for tropical cyclones<br />
Eric D. Rappin, David S. Nolan and Sharanya J. Majumdar<br />
(erappin@rsmas.miami.edu)<br />
University <strong>of</strong> Miami, RSMAS<br />
In order to provide realistic numerical predictions <strong>of</strong> tropical cyclone (TC) structure and intensity<br />
change, an accurate specification <strong>of</strong> <strong>the</strong> initial TC structure in a high-resolution model is<br />
necessary. The current capabilities <strong>of</strong> observational data (particularly when aircraft are not<br />
present) and data assimilation schemes preclude this from being achievable without considerable<br />
<strong>the</strong>oretical effort and computational expense. For many research and forecasting applications, a<br />
convenient but imperfect solution is <strong>the</strong> initialization <strong>of</strong> <strong>the</strong> model with a syn<strong>the</strong>tic vortex.<br />
In this study, a customizable approach towards vortex initialization is employed, beginning with<br />
a user-specified, relocatable vortex in gradient wind balance that is constructed to be consistent<br />
with operationally estimated parameters. The tangential circulation can be extended upwards<br />
through a variety <strong>of</strong> idealized configurations <strong>of</strong> vertical structure. Next, a three-dimensional<br />
wind structure in <strong>the</strong> hurricane boundary layer is derived using Monin-Obukhov similarity<br />
<strong>the</strong>ory, based on <strong>the</strong> gradient wind pr<strong>of</strong>ile, variations in boundary layer depth, surface<br />
momentum flux and eddy viscosity. Finally, <strong>the</strong> relative humidity in <strong>the</strong> tropical cyclone can be<br />
configured. In <strong>the</strong> future, <strong>the</strong> mid- and upper-tropospheric secondary circulation will be derived<br />
from analyses based on satellite-derived atmospheric motion vectors.<br />
Simulations using <strong>the</strong> Wea<strong>the</strong>r Research and Forecasting (WRF) model will be presented. It is<br />
proposed that a well-constructed initial vortex will serve as a convenient benchmark against<br />
which new, sophisticated data assimilation schemes can be evaluated.<br />
Poster Session – Page 19
Diagnosis <strong>of</strong> Operational Model Track Forecast Error for Hurricane Ike (2008)<br />
Michael J. Brennan 1 and Sharanya J. Majumdar 2<br />
(Michael.brennan@noaa.gov)<br />
1 NOAA/NWS/NCEP/NHC; 2 RSMAS Division <strong>of</strong> Meteorology and Physical Oceanography,<br />
University <strong>of</strong> Miami<br />
The National Hurricane Center (NHC) issues track forecasts every six hours for all active<br />
tropical cyclones in its area <strong>of</strong> responsibility. These forecasts are made at projection times <strong>of</strong> 12,<br />
24, 36, 48, 72, 96, and 120 hours. On 9 September 2008 track forecast errors from numerical<br />
model track guidance and <strong>the</strong> NHC’s <strong>of</strong>ficial forecast for Hurricane Ike increased substantially<br />
compared to errors from forecasts during <strong>the</strong> previous couple <strong>of</strong> days. This period <strong>of</strong> elevated<br />
track error occurred three to four days prior to Ike’s Texas landfall early on 13 September.<br />
During this time, much <strong>of</strong> <strong>the</strong> track model guidance and <strong>the</strong> <strong>of</strong>ficial NHC forecasts demonstrated<br />
a southward bias, taking <strong>the</strong> center <strong>of</strong> Ike to a landfall location along <strong>the</strong> central or sou<strong>the</strong>rn<br />
Texas coast, instead <strong>of</strong> <strong>the</strong> upper Texas coast near Houston/Galveston where landfall ultimately<br />
occurred. The average error <strong>of</strong> <strong>the</strong> NHC 72-h track forecasts issued on 9 September was 92.8<br />
nm, a 38% increase in <strong>the</strong> average error compared to <strong>the</strong> NHC 96-h track forecasts issued on <strong>the</strong><br />
previous day (66.8 nm). Errors from many <strong>of</strong> <strong>the</strong> track models were even larger; <strong>the</strong> average<br />
72-h forecast error for <strong>the</strong> interpolated GFS (GFSI) model on 9 September was 131.5 nm. This<br />
increase in track forecast error occurred during a critical time when federal, state, and local<br />
government agencies were making mitigation and disaster response decisions.<br />
Examination <strong>of</strong> <strong>the</strong> 500-hPa height analyses from <strong>the</strong> members <strong>of</strong> <strong>the</strong> NCEP Global<br />
Ensemble Forecast System (GEFS) at 0000 UTC 9 September 2008 show significant spread in<br />
<strong>the</strong> strength <strong>of</strong> <strong>the</strong> mid-level subtropical ridge over <strong>the</strong> sou<strong>the</strong>rn United States north <strong>of</strong> Ike.<br />
Ensemble members that showed a stronger (weaker) ridge north <strong>of</strong> Ike during <strong>the</strong> model<br />
integration moved Ike on a track far<strong>the</strong>r to <strong>the</strong> left (right) <strong>of</strong> <strong>the</strong> track <strong>of</strong> <strong>the</strong> GEFS ensemble<br />
mean, which was close to <strong>the</strong> actual track <strong>of</strong> Ike. Given <strong>the</strong>se observations, an experiment was<br />
performed where <strong>the</strong> initial conditions in <strong>the</strong> GFS run from 0000 UTC 9 September were altered<br />
to slightly weaken <strong>the</strong> ridge north <strong>of</strong> Ike. Results from this experiment showed Ike moving<br />
significantly to <strong>the</strong> right <strong>of</strong> <strong>the</strong> operational GFS forecast from that time and closer to <strong>the</strong><br />
observed track <strong>of</strong> <strong>the</strong> hurricane. Additional experiments perturbing o<strong>the</strong>r synoptic scale features<br />
possibly impacting <strong>the</strong> track <strong>of</strong> Ike had limited impact on <strong>the</strong> hurricane’s track. These results<br />
suggest that <strong>the</strong> evolution <strong>of</strong> <strong>the</strong> subtropical ridge was critical to determining Ike’s ultimate<br />
track. This case also represents an instance where a single-model ensemble system provided<br />
value over <strong>the</strong> typically superior multi-model consensus aids for TC track forecasting.<br />
Poster Session – Page 20
An Update on <strong>the</strong> Status <strong>of</strong> FNMOC Projects to Improve Tropical Cyclone Forecasting<br />
Carey Dickerman 1 ; Paul Wittmann 1 ; Buck Sampson 2 ; Ben Ruston 2<br />
1 Fleet Numerical Meteorology and Oceanography Center; 2 Naval Research Laboratory, Marine<br />
Meteorology Division<br />
This poster will describe <strong>the</strong> progress <strong>of</strong> four projects at Fleet Numerical Meteorology and<br />
Oceanography Center (FNMOC) aimed at improving tropical cyclone forecasting. Two <strong>of</strong> <strong>the</strong><br />
studies relate to <strong>the</strong> Geophysical Fluid Dynamics Laboratory (GFDL) hurricane model (GFDN)<br />
that has provided operational guidance since 1996 for storms in all basins, including <strong>the</strong> Indian<br />
Ocean and Sou<strong>the</strong>rn Hemisphere (Rennick, 1999). This makes GFDN <strong>the</strong> only moveable<br />
tropical cyclone model running in all tropical oceanic basins worldwide.<br />
The first study investigates <strong>the</strong> relationship between forecast track error in nautical miles and<br />
intensity error in knots. Specifically, <strong>the</strong> study attempts to identify whe<strong>the</strong>r or not <strong>the</strong>re is a<br />
relationship between track error and intensity error. The second study, specific to GFDN,<br />
analyzes <strong>the</strong> sensitivity <strong>of</strong> wind radii on track and intensity error. Particularly poor “outlier”<br />
forecasts during <strong>the</strong> 2010 season have been identified for analysis. The goal <strong>of</strong> <strong>the</strong> study is to<br />
isolate if <strong>the</strong> size <strong>of</strong> <strong>the</strong> 34-knot wind radii used to initialize GFDN have an important effect on<br />
<strong>the</strong> track and intensity forecasts.<br />
The third component <strong>of</strong> this poster is an overview <strong>of</strong> <strong>the</strong> status <strong>of</strong> tropical cyclone (TC) wave<br />
modeling at FNMOC. The prediction <strong>of</strong> TC wind-generated waves have long been a major<br />
concern for US Navy vessels and installations. Currently, wave models such as <strong>the</strong> Wave<br />
Prediction Model (WAM) and Wave Watch III (WW3) models (Tolman, et al., 2007) are driven<br />
by individual Numerical Wea<strong>the</strong>r Prediction models such as <strong>the</strong> Navy Operational Global<br />
Atmospheric Prediction System (NOGAPS) model (Rosmond, et al., 2002) or <strong>the</strong> Coupled<br />
Ocean/Atmosphere Mesoscale Prediction System (COAMPS) model (Naval Research Lab,<br />
2003). The TC track and intensity forecasts by <strong>the</strong>se models may differ significantly from <strong>the</strong><br />
<strong>of</strong>ficial track issued by JTWC and NHC. Hence, <strong>the</strong> waves forecast will be inconsistent with <strong>the</strong><br />
<strong>of</strong>ficial track. The goal <strong>of</strong> this project is to create a wave forecast consistent with <strong>the</strong> <strong>of</strong>ficial<br />
track. The method used to do this is as follows. 1) Interpolate <strong>the</strong> wind radii from <strong>the</strong> <strong>of</strong>ficial<br />
track to a high resolution grid. 2) Remove <strong>the</strong> TC vortex from <strong>the</strong> global NWP model (NOGAPS<br />
or GFS). 3) Blend <strong>the</strong> high resolution interpolated winds into <strong>the</strong> background wind field. 4)<br />
Force <strong>the</strong> WW3 wave model, on a regional grid, using <strong>the</strong> blended wind grids. Results will be<br />
detailed in <strong>the</strong> poster.<br />
The fourth project that is described in this poster details <strong>the</strong> method <strong>of</strong> data assimilation and its<br />
potential effect on improving TC forecasting. The assimilation <strong>of</strong> Global Positioning System<br />
(GPS) bending angle has been a positive constraint on <strong>the</strong> moisture and temperature fields<br />
between 8 and 30 km (Healy, et al., 2007). After <strong>the</strong> GPS bending angle assimilation was added<br />
to <strong>the</strong> NAVDAS-AR (Xu, Rosmond, Daley et al., 2005) system it was possible to increase <strong>the</strong><br />
spectral coverage from radiance data from all microwave and infrared sounders. The process is<br />
detailed in <strong>the</strong> poster.<br />
Poster Session – Page 21
Improving <strong>the</strong> Assimilation <strong>of</strong> High-Resolution Satellite Wind Data into Mesoscale<br />
Prediction Models<br />
Ting-Chi Wu 1 , Hui Liu 2 , Christopher S. Velden 3 ,<br />
Sharanya J. Majumdar 1 and Jeffrey Anderson 2<br />
(twu@rsmas.miami.edu)<br />
1 University <strong>of</strong> Miami, RSMAS; 2 National Center for Atmospheric Research;<br />
3 University <strong>of</strong> Wisconsin, CIMSS<br />
Given that tropical cyclones (TC) spend most <strong>of</strong> <strong>the</strong>ir lifetimes over <strong>the</strong> ocean, <strong>the</strong> assimilation<br />
<strong>of</strong> high-resolution satellite data is necessary to provide accurate model analyses <strong>of</strong> <strong>the</strong> TC<br />
structure and its environment. An example is cloud-derived Atmospheric Motion Vectors<br />
(AMVs) prepared hourly by CIMSS, with additional AMVs from rapid-scan mode included<br />
when available. The Ensemble Kalman Filter (EnKF) in <strong>the</strong> Wea<strong>the</strong>r Research and Forecasting<br />
(WRF) model is used to assimilate <strong>the</strong>se high-frequency and high-resolution satellite data.<br />
The case chosen for this study is Typhoon Sinlaku (2008) during its period <strong>of</strong> intensification. In<br />
order to evaluate <strong>the</strong> influence <strong>of</strong> assimilating <strong>the</strong> experimental AMV data, a ‘control’ EnKF<br />
cycle is first produced with <strong>the</strong> assimilation <strong>of</strong> conventional observations (radiosonde, aircraft<br />
data, JTWC advisory TC position and operational JMA cloud winds). Next, a parallel EnKF<br />
cycle that also includes <strong>the</strong> experimental CIMSS AMVs is computed over <strong>the</strong> life cycle <strong>of</strong><br />
Sinlaku. In order to <strong>of</strong>fer a benchmark for <strong>the</strong> EnKF, a deterministic WRF run initialized from<br />
ECMWF is also produced.<br />
Both <strong>the</strong> ‘Control’ and ‘experimantal CIMSS-AMV’ ensemble forecasts generally produce lower<br />
track errors than <strong>the</strong> deterministic run. Additionally, <strong>the</strong> ensemble forecasts exhibit a shorter<br />
spin-up time than <strong>the</strong> deterministic run in terms <strong>of</strong> intensity, with stronger wind structures. A<br />
comparison between <strong>the</strong> structures <strong>of</strong> Sinlaku in <strong>the</strong> respective EnKF analyses will be presented,<br />
and analyzed with respect to dropwindsonde observations during <strong>the</strong> TCS-08/T-PARC field<br />
campaign. The influence <strong>of</strong> assimilating <strong>the</strong> experimental CIMSS-AMV datasets on <strong>the</strong><br />
ensemble forecasts <strong>of</strong> Sinlaku will also be presented.<br />
Poster Session – Page 22
Diagnosing initial condition sensitivity <strong>of</strong> Typhoon Sinlaku (2008) and Hurricane Ike<br />
(2008)<br />
William A. Komaromi, Sharanya J. Majumdar and Eric D. Rappin<br />
(wkomaromi@rsmas.miami.edu)<br />
Rosenstiel School <strong>of</strong> Marine and Atmospheric Science, University <strong>of</strong> Miami<br />
An examination <strong>of</strong> <strong>the</strong> sensitivity <strong>of</strong> numerical simulations <strong>of</strong> tropical cyclone (TC) track<br />
to perturbations in <strong>the</strong> initial conditions has been conducted for Typhoon Sinlaku (2008) and<br />
Hurricane Ike (2008). Balanced perturbations <strong>of</strong> different amplitude, spatial scale and location<br />
were created via a modification <strong>of</strong> local relative vorticity at a chosen location and depth. For<br />
each TC, 5-day Wea<strong>the</strong>r Research and Forecasting (WRF) model track predictions are compared<br />
to an unperturbed (“control”) simulation. The control simulations replicate forecast errors<br />
evident in <strong>the</strong> operational models specific to <strong>the</strong> chosen TCs, including a premature recurvature<br />
in <strong>the</strong> forecast for Sinlaku and a landfall too far south along <strong>the</strong> Texas coast for Ike.<br />
In <strong>the</strong> case <strong>of</strong> Typhoon Sinlaku (2008), <strong>the</strong> premature recurvature in <strong>the</strong> control<br />
simulation is found to be corrected by a variety <strong>of</strong> initial perturbations, including <strong>the</strong> weakening<br />
<strong>of</strong> an upper-level low directly to its north and <strong>the</strong> weakening <strong>of</strong> a remote shortwave trough in <strong>the</strong><br />
mid-latitude storm track. It is suggested that one or both <strong>of</strong> <strong>the</strong> shortwaves may have been<br />
initialized too strongly. In <strong>the</strong> second case, Hurricane Ike (2008) initialized four days prior to its<br />
landfall in Texas, <strong>the</strong> forecasts were not sensitive to most remote perturbations. The primary<br />
corrections to <strong>the</strong> track <strong>of</strong> Ike arose from a weakening <strong>of</strong> a mid-level ridge directly to its north,<br />
and <strong>the</strong> streng<strong>the</strong>ning <strong>of</strong> a shortwave trough in <strong>the</strong> mid-latitudes. For both Sinlaku and Ike,<br />
targets selected objectively by <strong>the</strong> Ensemble Transform Kalman Filter (ETKF) were <strong>of</strong>ten but<br />
not always consistent with <strong>the</strong> most sensitive regions found in this study.<br />
The methodology employed by this study may be used retrospectively by <strong>the</strong> research<br />
and operational communities to <strong>of</strong>fer suggestions on <strong>the</strong> wea<strong>the</strong>r features in which <strong>the</strong> initial<br />
analysis required improvement, via a combination <strong>of</strong> improved modelling, observational<br />
coverage or data assimilation. The diagnostic technique may also be used to improve<br />
understanding <strong>of</strong> objective sensitivity methods, such as Singular Vectors and <strong>the</strong> ETKF, and<br />
<strong>the</strong>ir limitations.<br />
Poster Session – Page 23
Testing <strong>of</strong> a New Parametric Tropical Cyclone Wind Model for Implementation<br />
in <strong>the</strong> Gradient Wind Asymmetric Vortex Algorithm (GWAVA)<br />
to Drive Storm Surge Prediction Models<br />
Craig A. Mattocks 1 , Vincent T. Wood 2<br />
(cmattock@rsmas.miami.edu<br />
1 University <strong>of</strong> Miami/Rosenstiel School <strong>of</strong> Marine and Atmospheric Science;<br />
2 NOAA/OAR/National Severe Storms Laboratory<br />
A new tropical cyclone wind model,<br />
developed at <strong>the</strong> National Severe Storms<br />
Laboratory (NSSL), is presented that is<br />
primarily designed to depict realisticlooking<br />
tangential wind pr<strong>of</strong>iles that can<br />
better fit <strong>the</strong> wind structure around a tropical<br />
cyclone. The parametric wind pr<strong>of</strong>ile<br />
employs five key parameters: maximum<br />
tangential wind, radius <strong>of</strong> maximum<br />
tangential wind (RMW), and three powerlaw<br />
exponents that shape different portions<br />
<strong>of</strong> <strong>the</strong> velocity pr<strong>of</strong>ile. One <strong>of</strong> <strong>the</strong> exponents<br />
explicitly controls <strong>the</strong> broadness and<br />
sharpness <strong>of</strong> <strong>the</strong> peak locally in <strong>the</strong> annular<br />
zone that encompasses <strong>the</strong> tangential wind<br />
maximum.<br />
To assess <strong>the</strong> performance <strong>of</strong> <strong>the</strong> new<br />
parametric wind model, gridded H*Wind<br />
horizontal wind analyses for Tropical Storm<br />
Dolly (2008), Hurricanes Katrina (2005),<br />
Ike (2008), Danielle (2010), Earl (2010),<br />
and Igor (2010) were used as input. These<br />
tropical cyclones were chosen because <strong>the</strong><br />
wind fields are highly asymmetric. The<br />
gridded fields were interpolated using a<br />
bilinear interpolation technique to construct<br />
each radial pr<strong>of</strong>ile <strong>of</strong> total wind speed from<br />
<strong>the</strong> storm center defined in a cylindrical<br />
coordinate system. At each <strong>of</strong> 360 radial<br />
pr<strong>of</strong>iles, optimization <strong>of</strong> <strong>the</strong> initial five<br />
model parameters was performed using <strong>the</strong><br />
Levenberg-Marquardt method that solves<br />
<strong>the</strong> nonlinear least squares problem for<br />
Poster Session – Page 24<br />
curve-fitting applications. The calculated<br />
root-mean-square errors were computed to<br />
evaluate <strong>the</strong> accuracy <strong>of</strong> <strong>the</strong> fitted and<br />
analytical tangential wind pr<strong>of</strong>iles. Using <strong>the</strong><br />
fitted model parameters, a two-dimensional<br />
wind field was reconstructed by<br />
interpolating <strong>the</strong> 360 radial pr<strong>of</strong>iles to <strong>the</strong><br />
Cartesian coordinate system. The parametric<br />
wind model has shown considerable skill in<br />
accurately replicating tropical cyclone wind<br />
fields that compare favorably with those in<br />
<strong>the</strong> H*Wind analyses (Fig. 1). This versatile<br />
wind model will soon be implemented in<br />
GWAVA to improve <strong>the</strong> wind forcing that<br />
drives storm surge prediction models.<br />
Fig. 1. Fit <strong>of</strong> <strong>the</strong> NSSL tropical cyclone<br />
parametric wind model to a horizontal wind field<br />
(kt) from an H*Wind analysis for Hurricane Ike<br />
(2008). Blue circle indicates <strong>the</strong> limited region<br />
in which <strong>the</strong> winds are fitted. TC stands for<br />
tropical cyclone
Objective Diagnosis <strong>of</strong> <strong>the</strong> Eyewall Replacement Cycle in Mature Tropical Cyclones<br />
Elizabeth R. Sanabia and Nicholas P. Celone<br />
(sanabia@usna.edu)<br />
United States Naval Academy<br />
Typhoon Sinlaku underwent an eyewall replacement cycle shortly before making landfall<br />
over Taiwan in September 2008 during <strong>the</strong> Tropical Cyclone Structure – 2008 (TCS-08) field<br />
program. Eyewall replacement cycles in tropical cyclones are <strong>of</strong>ten associated with intensity<br />
fluctuations and increased predictability challenges (Willoughby et al. 1982). Currently,<br />
microwave satellite imagery is an accepted and <strong>of</strong>ten effective means by which to detect various<br />
stages in <strong>the</strong> eyewall replacement cycle; however, <strong>the</strong> near 12-h temporal resolution and hit-ormiss<br />
spatial sampling <strong>of</strong> microwave sensors are insufficient to capture <strong>the</strong> detailed evolution <strong>of</strong><br />
<strong>the</strong> eyewall replacement cycle process, which frequently lasts less than 24 h (Kossin and<br />
Sitkowski 2009).<br />
Here, <strong>the</strong> eyewall replacement cycle during TY Sinlaku is examined using differences in<br />
water vapor and infrared satellite brightness temperatures from geostationary sensors to detect<br />
deep convection that penetrates <strong>the</strong> tropopause (Fritz and Laszlo 1993; Olander and Velden<br />
2009). The geostationary data are transformed into a cylindrical grid about <strong>the</strong> storm center, and<br />
<strong>the</strong> water vapor – infrared differences are examined over varying radial bands. A new diagnostic<br />
technique is <strong>the</strong>n used to map this deep convection over time. In <strong>the</strong> case <strong>of</strong> Typhoon Sinlaku,<br />
<strong>the</strong> deep convection is mapped during a 72-h period that includes <strong>the</strong> eyewall replacement cycle<br />
and provides clear evidence <strong>of</strong> inner eyewall decay as well as outer eyewall development and<br />
subsequent contraction. These results are compared with o<strong>the</strong>r satellite data and TCS-08 aircraft<br />
observations, and links between <strong>the</strong> evolution <strong>of</strong> deep convection and changes in intensity are<br />
assessed.<br />
The eyewall mapping technique is <strong>the</strong>n extended to o<strong>the</strong>r cases to examine <strong>the</strong> potential<br />
for improving intensity forecast accuracy during eyewall replacement cycles. While diagnostic<br />
in nature, this eyewall mapping technique may be applied on a real-time basis and provide <strong>the</strong><br />
forecaster with unique, objective insight regarding <strong>the</strong> evolution <strong>of</strong> a tropical cyclone throughout<br />
its lifecycle and be <strong>of</strong> particular use in <strong>the</strong> diagnosis <strong>of</strong> eyewall replacement cycles. The<br />
technique may also provide new insights into <strong>the</strong> behavior <strong>of</strong> deep convection and possible<br />
correlation to periods <strong>of</strong> rapid intensification and rapid decay.<br />
_____________<br />
Fritz, S., and I. Laszlo, 1993: Detection <strong>of</strong> water vapor in <strong>the</strong> stratosphere over very high<br />
clouds in <strong>the</strong> tropics. J. Geophys. Res., 98 (D12), 22,959-22,967.<br />
Kossin, J. P., and M. Sitkowski, 2009: An objective model for identifying secondary<br />
eyewall formation in hurricanes. Mon. Wea. Rev, 137, 876-892.<br />
Olander, T. L. and C. S. Velden, 2009: Tropical cyclone convection and intensity<br />
analysis using differenced infrared and water vapor imagery. Wea. Forecasting,<br />
24, 1558-1572.<br />
Willoughby, H. E., J. A. Clos, and M. G. Shoreibah, 1982: Concentric eye walls, secondary wind<br />
maxima, and <strong>the</strong> evolution <strong>of</strong> <strong>the</strong> hurricane vortex. J. Atmos. Sci., 39, 395–411.<br />
Poster Session – Page 25
Climatology <strong>of</strong> Hot Towers in Tropical Cyclone's Inner Cores and Rainbands Based on 12-<br />
year TRMM Data<br />
Cheng Tao and Haiyan Jiang<br />
(ctao003@fiu.edu)<br />
Department <strong>of</strong> Earth & Environment, Florida International University<br />
Recent studies have shown that hot towers may be an indicator <strong>of</strong> tropical cyclone (TC)<br />
genesis and intensification. Using a 12-year (December 1997 - December 2009) Tropical<br />
Rainfall Measuring Mission (TRMM) tropical cyclone precipitation feature (TCPF) database, hot<br />
towers in TCs are identified by using <strong>the</strong> TRMM PR observed maximum 20 dBZ echo height<br />
reaching four different reference heights, i.e., 14 km, NCEP reanalysis derived tropopause<br />
height, Level <strong>of</strong> Neutral Buoyancy calculated using NCEP sounding and surface equivalent<br />
potential temperatureθ e , Level <strong>of</strong> Neutral Buoyancy calculated usingθ e at 925 and 1000 mb,<br />
whichever is greater. The common properties <strong>of</strong> <strong>the</strong>se extreme convective systems are examined<br />
in terms <strong>of</strong> geographical locations, different TC intensities, and different TC regions, i.e., <strong>the</strong><br />
inner core (IC) region, <strong>the</strong> inner rainband region (IB), and <strong>the</strong> outer rainband region (OB). It is<br />
found that 13.2% <strong>of</strong> TC precipitation features reach 14 km, and 2.6% <strong>of</strong> <strong>the</strong>m may even<br />
penetrate 16 km. Hot towers in TCs are more frequent in <strong>the</strong> Western North Pacific basin than<br />
any o<strong>the</strong>r TC-prone basins. The percentage <strong>of</strong> precipitation features with one or more hot towers<br />
is greater in <strong>the</strong> IC region than in <strong>the</strong> IB and OB regions by a factor <strong>of</strong> 10-20, depending on<br />
which reference height is used. It is also found that hot towers in <strong>the</strong> IC region have a higher<br />
mean maximum height <strong>of</strong> 20 and 40 dBZ echo, stronger ice scattering signature than in<br />
rainbands regions, no matter which reference height is used. The percentage <strong>of</strong> features with hot<br />
towers increases as TC intensity increases. The mean maximum height <strong>of</strong> 40 dBZ echo is higher<br />
in hurricanes than in tropical storms and tropical depressions.<br />
Poster Session – Page 26
Quantitative Comparison <strong>of</strong> Precipitation Algorithms in Tropical Cyclones<br />
Joseph P. Zagrodnik and Haiyan Jiang<br />
(jzagr001@fiu.edu)<br />
Department <strong>of</strong> Earth and Environment, Florida International University<br />
The Tropical Rainfall Measurement Mission (TRMM) has been collecting Tropical<br />
Cyclone (TC) rainfall measurements since 1997. The Tropical Cyclone related Precipitation<br />
Feature (TCPF) database has been developed to process raw pixel-level satellite measurements<br />
into specific events that can be quickly sorted and compared. In addition, a semi-manual method<br />
has been used to divide 12 years <strong>of</strong> TC rainfall data into inner core (IC), inner rainband (IB) and<br />
outer rainband (OB) regions. The database consists <strong>of</strong> over 13,000 TC overpasses from<br />
December 1997 through December 2009. Using TCPF data, two TRMM rainfall retrieval<br />
algorithms are compared: The Version 6 TRMM Precipitation Radar (PR) 2A25 algorithm and<br />
<strong>the</strong> Version 6 TRMM Microwave Imager (TMI) 2A12 algorithm.<br />
In this study, <strong>the</strong> differences in tropical cyclone (TC) rainfall algorithms are evaluated in<br />
terms <strong>of</strong> physical location, storm intensity, sub-regions inside <strong>the</strong> storm (eyewall or rain bands,<br />
stratiform or convective), and <strong>the</strong> diurnal cycle. Consistent with previous studies, considerable<br />
differences are found to exist between <strong>the</strong> algorithms. For all TCs over oceans, <strong>the</strong> TMI 2A12<br />
algorithm produces <strong>the</strong> most volumetric rainfall, as it contains <strong>the</strong> highest mean rain rates in all<br />
TC intensity categories. The PR 2A25 algorithm contains a higher percentage <strong>of</strong> light (< 5 mms -<br />
1 ) rain rates, but compensates with a greater total rain area. The difference in rainfall algorithms<br />
is most significant in TC inner cores. Total volumetric rain was found to be highest in <strong>the</strong> for <strong>the</strong><br />
PR 2A25 algorithm in TC inner cores, while <strong>the</strong> TMI 2A12 algorithm produces <strong>the</strong> highest<br />
volumetric rain for TC inner bands and outer bands.<br />
Poster Session – Page 27
Numerical Studies <strong>of</strong> Lower Boundary Forcing on Tropical Storm Fay (2008) over<br />
Sou<strong>the</strong>rn Florida<br />
Travis L. Washington and Sen Chiao<br />
(Twashington2008@my.fit.edu)<br />
Department <strong>of</strong> Marine and Environmental Systems<br />
Florida Institute <strong>of</strong> Technology<br />
This study is aimed to investigate <strong>the</strong> track and intensity changes <strong>of</strong> Tropical Storm Fay as it<br />
moved across south Florida. The maximum wind speed was achieved around 1800 UTC 19<br />
August when <strong>the</strong> center was near <strong>the</strong> western side <strong>of</strong> Lake Okeechobee. The overages <strong>of</strong><br />
precipitation in <strong>the</strong> days before landfall left <strong>the</strong> soil moisture saturated ahead <strong>of</strong> TS Fay. Yet, <strong>the</strong><br />
warmer SST over <strong>the</strong> lake as well as <strong>the</strong> west coast <strong>of</strong> Florida may have played a role in<br />
maintaining <strong>the</strong> intensity <strong>of</strong> <strong>the</strong> storm. It is our working hypo<strong>the</strong>sis that <strong>the</strong> storm moved near<br />
Lake Okeechobee, and intensified or closely held its intensity due to high soil moisture, and<br />
warmer SST over Lake Okeechobee and <strong>the</strong> west coast <strong>of</strong> Florida.<br />
The simulations are performed using <strong>the</strong> Wea<strong>the</strong>r Research and Forecasting (WRF-ARW) model<br />
with 30, 10 and 3.3 km nested domains to examine our hypo<strong>the</strong>sis. The FNL and <strong>the</strong> twelfthdegree<br />
RTG_SST analysis are adopted as <strong>the</strong> initial and lateral boundary conditions. The<br />
preliminary results demonstrate that <strong>the</strong> high-resolution simulation is able to recapture <strong>the</strong> track<br />
and deepening rate <strong>of</strong> <strong>the</strong> storm while passing through south Florida. The sensitivity experiments<br />
<strong>of</strong> land surface characters and SST in this case illustrate <strong>the</strong>ir impacts on <strong>the</strong> intensity and track<br />
<strong>of</strong> TS Fay during and after landfall. To fur<strong>the</strong>r investigate <strong>the</strong> intensity changes experiment using<br />
<strong>the</strong> TC bogus approach were performed. The simulated results demonstrate that using <strong>the</strong> TC<br />
bogus approach <strong>the</strong> storm can effectively reach <strong>the</strong> intensity (e.g., low pressure center) as <strong>the</strong><br />
NHC recorded. Never<strong>the</strong>less, <strong>the</strong> simulated track may still need to be improved.<br />
Poster Session – Page 28
Vertical Wind Shear Impacts on Hurricane Structure Deduced from Airborne-Doppler<br />
and HWRF Databases<br />
Paul Reasor 1 , Rob Rogers 1 , Sylvie Lorsolo 2 , Sundararaman Gopalakrishnan 1 ,<br />
John Gamache 1 , Frank Marks 1<br />
(paul.reasor@noaa.gov)<br />
1 NOAA/AOML/HRD, 2 CIMAS/HRD<br />
We will present <strong>the</strong> application <strong>of</strong> a newly-constructed database <strong>of</strong> radar-derived winds in<br />
hurricanes to <strong>the</strong> examination <strong>of</strong> structural characteristics <strong>of</strong> vertically sheared systems. At<br />
present, <strong>the</strong> database consists <strong>of</strong> over 150 passes <strong>of</strong> NOAA aircraft through hurricanes <strong>of</strong> varying<br />
strength. Metrics are developed to quantify <strong>the</strong> structure, including local shear, vortex tilt, and<br />
low-azimuthal-wavenumber wind components. A shear-relative composite analysis is performed,<br />
stratified according to large-scale shear magnitude, vortex strength and vortex size. As expected,<br />
stronger shear and weaker vortex strength tend to yield greater vortex tilt and a more pronounced<br />
quasi-steady vertical velocity asymmetry. Stronger vortices in particular exhibit a preference for<br />
tilt to <strong>the</strong> left <strong>of</strong> <strong>the</strong> large-scale, deep-layer shear vector.<br />
A similar analysis has been applied to a database <strong>of</strong> over 100 HWRF ICs with 9 km<br />
horizontal grid spacing. The HWRF IC database reproduces many aspects <strong>of</strong> shear-induced<br />
structure revealed in <strong>the</strong> Doppler database. This analysis is being extended to forecast fields<br />
using HRD’s experimental HWRF model at 3-km resolution. These results will be presented at<br />
<strong>the</strong> conference with <strong>the</strong> aim <strong>of</strong> clarifying HWRF’s representation <strong>of</strong> <strong>the</strong> vortex-shear interaction<br />
relative to that depicted by <strong>the</strong> radar database.<br />
Poster Session – Page 29
Is hurricane rapid intensification possible<br />
from <strong>the</strong> energy released inside <strong>of</strong> a convective burst?<br />
Owen A. Kelley 1 , Jeffrey B. Halverson, 2 and John Stout 1<br />
(Owen.Kelley@nasa.gov)<br />
1 NASA Goddard Space Flight; 2 University <strong>of</strong> Maryland Baltimore County<br />
When a hurricane intensifies, <strong>the</strong> NHC forecast discussion sometimes mentions particularly<br />
vigorous convection being observed in <strong>the</strong> eyewall. When Hurricane Earl (2010) was<br />
intensifying to category 4 on its approach toward <strong>the</strong> U.S., <strong>the</strong> NHC discussion stated: "THE<br />
EYE HAS CONTINUED TO CLEAR AND IS SURROUNDED BY CLOUD TOPS TO -70<br />
DEGREES CENSIUS OR COLDER" [5 PM AST 30 Aug 2010]. Forecasters may mention such<br />
bursts <strong>of</strong> eyewall convection because <strong>the</strong>y are common in infrared satellite animations <strong>of</strong><br />
intensifying hurricanes. Or perhaps forecasters mention convective bursts because some <strong>of</strong> <strong>the</strong><br />
intensity forecast schemes that forecasters rely on take into account <strong>the</strong> vigor <strong>of</strong> eyewall<br />
convection through various empirical parameterizations. It is still a subject <strong>of</strong> debate, however,<br />
what physical mechanisms connect convective bursts with energy flowing into <strong>the</strong> hurricane's<br />
tangential wind field.<br />
Even before <strong>the</strong>re is scientific consensus on <strong>the</strong>se physical mechanisms, it would be helpful to<br />
estimate what energy conservation and o<strong>the</strong>r <strong>the</strong>rmodynamic considerations permit in terms <strong>of</strong> a<br />
convective burst's effect on hurricane intensity. This study provides such a <strong>the</strong>rmodynamic<br />
estimate, incorporating recently collected satellite datasets, modeling studies, and analyses <strong>of</strong><br />
multi-instrument wind observations.<br />
First, satellite observations provide estimates <strong>of</strong> <strong>the</strong> net amount <strong>of</strong> condensation occurring inside<br />
<strong>of</strong> a vigorous eyewall cell. Net condensation is proportional to net latent heat release. Making<br />
reasonable assumptions, a convective burst (a series <strong>of</strong> vigorous cells) could release 6e17 J <strong>of</strong><br />
latent heat into <strong>the</strong> eyewall every 12 hours, in excess <strong>of</strong> <strong>the</strong> amount <strong>of</strong> latent heat that would<br />
have been released in <strong>the</strong> eyewall in <strong>the</strong> absence <strong>of</strong> a convective burst. Convective bursts have<br />
been observed to persist for 9 to 48 hours. Second, modeling studies provide estimates <strong>of</strong> <strong>the</strong><br />
efficiency with which latent heat released in <strong>the</strong> eyewall may be transformed into increased<br />
kinetic energy <strong>of</strong> <strong>the</strong> hurricane's tangential wind. A 5% to 7% efficiency is consistent with<br />
recent modeling studies. Third, an examination <strong>of</strong> wind analyses provides a mapping between<br />
changes in kinetic energy and changes in surface wind intensity. An experimental extension <strong>of</strong><br />
<strong>the</strong> H*wind analysis to three dimensions suggests a power-law relation between initial and final<br />
kinetic energy (KE) and initial and final surface wind intensity (I): KE f / KE i = ( I f / I i ) 1.34 .<br />
Putting <strong>the</strong>se three pieces toge<strong>the</strong>r, this study estimates that intensification at <strong>the</strong> rate <strong>of</strong> 11−19 m<br />
s -1 (21−37 kt) in 12 hours could result from <strong>the</strong> extra amount <strong>of</strong> latent heat that <strong>the</strong> convective<br />
burst releases inside <strong>of</strong> <strong>the</strong> eyewall. As a point <strong>of</strong> reference, rapid intensification is <strong>of</strong>ten<br />
considered ≥15 m s -1 (30 kt) in 24 hours, and some convective bursts persist for several days.<br />
Poster Session – Page 30
Hurricanes: Science and Society – an online resource collaboratively developed by<br />
scientists, education and outreach pr<strong>of</strong>essionals, and educators<br />
Isaac Ginis, G. Scowcr<strong>of</strong>t, R. M. Yablonsky, C. W. Knowlton, H. Morin,<br />
(iginis@gso.uri.edu)<br />
Graduate School <strong>of</strong> Oceanography, University <strong>of</strong> Rhode Island<br />
There are many models for engaging scientists in education and outreach activities that can assist<br />
<strong>the</strong>m in achieving broader impacts <strong>of</strong> <strong>the</strong>ir research. Successful models provide <strong>the</strong> participating<br />
scientists with an opportunity to contribute <strong>the</strong>ir expertise in such a way that <strong>the</strong>re are long<br />
lasting effects and/or useful products from <strong>the</strong>ir engagement. These kinds <strong>of</strong> experiences<br />
encourage <strong>the</strong> scientific community to continue participating in education and outreach activities.<br />
Hurricanes: Science and Society is an education and outreach program funded by <strong>the</strong> National<br />
Science Foundation that has successfully assisted scientists in broadening <strong>the</strong> impacts <strong>of</strong> <strong>the</strong>ir<br />
work. It has produced a new online educational resource (Hurricanes: Science and Society<br />
website) that was launched in October 2010. This multi-disciplinary tool has been developed<br />
with <strong>the</strong> guidance and input from a panel <strong>of</strong> leading U.S. hurricane researchers and <strong>the</strong><br />
participation <strong>of</strong> U.S. formal and informal science educators.<br />
This educational resource is expected to become a classroom tool for those both teaching and<br />
learning hurricane science. It contains information tailored for specific audiences including<br />
middle school through undergraduate educators and students, <strong>the</strong> general public, and <strong>the</strong> media.<br />
In addition to <strong>the</strong> website, a 12-page publication for policymakers and o<strong>the</strong>r stakeholders has<br />
been produced along with an accompanying CD-ROM/DVD to assist formal and informal<br />
science educators in maximizing <strong>the</strong> use <strong>of</strong> this new resource. Hurricanes: Science and Society<br />
can play a substantial role in <strong>the</strong> effort to educate both students and adults about <strong>the</strong> science and<br />
impacts <strong>of</strong> hurricanes and <strong>the</strong> importance <strong>of</strong> pre-hurricane planning and mitigation.<br />
http://www.hurricanescience.org<br />
Poster Session – Page 31
The influence <strong>of</strong> cyclones on <strong>the</strong> BP oil spill<br />
Pat Fitzpatrick, Yee Lau, Chris Hill, and Haldun Karan<br />
(fitz@gri.msstate.edu)<br />
Geosystems Research Institute, Mississippi State University<br />
The Deepwater Horizon oil spill impacted <strong>the</strong> Mississippi River Delta, Barataria Bay, <strong>the</strong> barrier<br />
islands east <strong>of</strong> Louisiana, and <strong>the</strong> Alabama and Florida coast for an extended period <strong>of</strong> time from<br />
May through July. However, <strong>the</strong> Rigolets and western Mississippi coast were impacted for a<br />
briefer period from late June to early July. An important component to understanding <strong>the</strong> oil<br />
transport is to distinguish <strong>the</strong> influences behind this apex moment. A simulation was conducted<br />
for <strong>the</strong> period 20 June to 10 July 2010 to understand this inland transport.<br />
The simulation was based on a Lagrangian particle tracker with random walk diffusion. Input<br />
consisted <strong>of</strong> latitude and longitude positions <strong>of</strong> oil-contaminated parcels, wind, current, and a<br />
large array <strong>of</strong> random numbers. In addition, new parcels were released at <strong>the</strong> damaged Macondo<br />
rig location at each time step. Twenty-five parcels are released at each position, and when<br />
combined with <strong>the</strong> diffusion coefficient (set to 10m 2 s -1 ), resulted in a realistic spread <strong>of</strong> <strong>the</strong><br />
parcels with time. The initial parcel locations were subjectively determined based on a<br />
combination <strong>of</strong> NASA MODIS satellite imagery, SAR imagery, NOAA oil trajectory maps, and<br />
<strong>the</strong> NOAA/NESDIS Satellite Analysis Branch (SAB) experimental surface oil analysis. The<br />
parcels were advected at 80% <strong>of</strong> <strong>the</strong> ocean current speed and at 3% <strong>of</strong> <strong>the</strong> wind speed. Bilinear<br />
interpolation was applied every timestep to determine <strong>the</strong> currents and winds at each parcel. The<br />
pseudo-random numbers were uniformly distributed between 0 and 1 and generated by <strong>the</strong><br />
Mersenne Twister algorithm. The initial seed was randomly obtained from machine noise.<br />
The 10-m wind and near-surface ocean currents were provided from NAVOCEANO’s 3-km<br />
Navy Coastal Ocean Model (NCOM) in <strong>the</strong> Intra-Americas Sea (AMSEAS) domain, with<br />
atmospheric forcing from COAMPS. The wind forcing was validated against buoys using<br />
statistical and vector correlation techniques, concluding that <strong>the</strong> winds were reasonably accurate.<br />
An examination <strong>of</strong> NCOM data, <strong>the</strong> oil spill simulation, buoy data, wea<strong>the</strong>r reanalysis maps, tide<br />
gauge data, scatterometer data, and HF radar currents show that two wea<strong>the</strong>r systems altered <strong>the</strong><br />
currents and water levels such that oil was pushed into <strong>the</strong> western Mississippi Sound and <strong>the</strong><br />
Rigolets. An easterly wind fetch from intensifying Hurricane Alex provided <strong>the</strong> first inland push,<br />
followed by a westward-drifting non-tropical low which had formed <strong>of</strong>f <strong>the</strong> western edge <strong>of</strong> a<br />
Gulf cold front. In both cases, a weak pressure gradient was replaced by strong easterly winds<br />
which not only switched alongshore westerly coastal currents to an easterly direction, but also<br />
increased inland water levels by 0.6-0.8 m as mini-surge events. These results showed that<br />
cyclones can dramatically alter oil transport, even by fringe effects. The study also showed that<br />
this modeling formulation was capable <strong>of</strong> reproducing <strong>the</strong> oil spill transport and is being used in<br />
follow-up BP research.<br />
Poster Session – Page 32
SATellite Intensity CONsensus (SATCON) Evaluation and Recent Changes<br />
Derrick Herndon 1 , Chris Velden 1 , Jeffrey Hawkins 2<br />
1 Univ. Wisconsin Cooperative Institute for Meteorological Satellite Studies (CIMSS);<br />
2 Naval Research Laboratory - Monterey<br />
The SATellite CONsensus (SATCON) algorithm developed at CIMSS objectively combines<br />
Tropical Cyclone (TC) intensity estimates analyzed from satellite infrared and microwave-based<br />
methods to produce a weighted consensus estimate which is more skillful than <strong>the</strong> individual<br />
members. SATCON provides <strong>the</strong> TC forecaster with <strong>the</strong> ability to quickly reconcile differences<br />
in objective intensity methods, and as a comparative guidance tool for evaluating subjective<br />
Dvorak estimates. Real-time SATCON estimates have been provided to NHC, BOM and JTWC<br />
along with o<strong>the</strong>r TC forecast agencies as part <strong>of</strong> a demonstration phase since <strong>the</strong> 2008 TC<br />
season.<br />
Current members <strong>of</strong> SATCON include <strong>the</strong> CIMSS ADT along with <strong>the</strong> CIMSS and CIRA<br />
AMSU algorithms. Each member <strong>of</strong> SATCON is weighted based on that member’s performance<br />
in a given situation (eye size, intensity, infrared scene type, etc.). Separate weights are used for<br />
minimum pressure and maximum wind estimates. The SATCON algorithm logic and weighting<br />
structures were developed using coincident reconnaissance aircraft data from storms in <strong>the</strong><br />
Atlantic, Eastern Pacific and Western Pacific. To date, we have accrued 562 cases when all three<br />
SATCON members were available and matched up with recon data. This dataset is divided into a<br />
dependent development sample, and an independent validation sample using a “leave every o<strong>the</strong>r<br />
case out” approach.<br />
In addition to updating <strong>the</strong> consensus weight structure as new cases become available, a number<br />
<strong>of</strong> recent changes have been made to fur<strong>the</strong>r improve <strong>the</strong> MSW estimates. These upgrades, as<br />
well as <strong>the</strong> resultant performance statistics, will be summarized in <strong>the</strong> poster. Fur<strong>the</strong>r information<br />
on SATCON can be found at:<br />
http://cimss.ssec.wisc.edu/tropic2/real-time/satcon/<br />
Poster Session – Page 33
A Methodology for Incorporating Hurricane Forecast Errors into Decision-Support<br />
Systems for Energy and Utility Companies<br />
A. B. Schumacher 1 , S. M. Quiring 2<br />
(schumacher@cira.colostate.edu)<br />
1 Cooperative Institute for Research in <strong>the</strong> Atmosphere;<br />
2 Department <strong>of</strong> Geography, Texas A&M University<br />
A variety <strong>of</strong> decision-support systems, such as those employed by energy and utility<br />
companies, utilize <strong>the</strong> National Hurricane Center (NHC) forecasts <strong>of</strong> track and intensity to<br />
inform operational decision-making as a hurricane approaches. Changes in hurricane intensity<br />
and track, especially just prior to landfall, can negatively impact <strong>the</strong> accuracy <strong>of</strong> <strong>the</strong>se decisionsupport<br />
systems. This study demonstrates how <strong>the</strong> Monte Carlo wind speed probability<br />
(MCWSP) can be applied to develop probabilistic estimates <strong>of</strong> <strong>the</strong> impact <strong>of</strong> <strong>the</strong> approaching<br />
storm. Our methodology utilizes <strong>the</strong> 1000 individual forecast realizations generated by <strong>the</strong><br />
MCWSP algorithm, instead <strong>of</strong> <strong>the</strong> wind speed probabilities, coupled with a power outage model<br />
to generate a distribution <strong>of</strong> power outage predictions for three past storms. Based on power<br />
outage data from a Gulf Coast utility company we found that <strong>the</strong> ensemble average was a better<br />
predictor <strong>of</strong> damage to <strong>the</strong> power system than predictions made using <strong>the</strong> <strong>of</strong>ficial National<br />
Hurricane Center forecast. We believe that this methodology can be used to incorporate<br />
information about tropical cyclone forecast errors into decision support systems that utilize NHC<br />
track and intensity data.<br />
Poster Session – Page 34
What might a global TC reanalysis project look like?<br />
Paula Ann Hennon 1 , Ken Knapp 2<br />
(paula.hennon@noaa.gov)<br />
1 STG, Inc.; 2 NOAA/NCDC/RSAD<br />
Tropical cyclone intensity, distribution and frequency significantly impact life and property.<br />
Understanding <strong>the</strong>se aspects <strong>of</strong> cyclones, however, requires a uniformly constructed dataset. The<br />
International Best Track Archive for Climate Stewardship project has provided a centralized<br />
collection <strong>of</strong> TC best track data. Despite efforts to minimize discontinuities in IBTrACS,<br />
inhomogeneities remain caused by changes in instrumentation, personnel, forecast agencies and<br />
operational procedures, which has led to a catalog <strong>of</strong> storms that is incongruous. To ameliorate<br />
this issue, efforts are underway in <strong>the</strong> North Atlantic to perform a reanalysis <strong>of</strong> storm intensity,<br />
however no global effort is currently in progress.<br />
We plan to build upon work already in progress by NHC and HRD in conjunction with <strong>the</strong><br />
National Climatic Data Center to facilitate <strong>the</strong> development <strong>of</strong> and to archive a record <strong>of</strong> reanalyzed<br />
global TC intensity. NCDC is uniquely positioned to facilitate this project given <strong>the</strong><br />
datasets and expertise on hand. IBTrACS is a global inventory <strong>of</strong> known tropical cyclones, while<br />
<strong>the</strong> HURSAT dataset is a collection <strong>of</strong> all satellite brightness temperatures from polar and<br />
geostationary satellites for <strong>the</strong> storms in IBTrACS. Using <strong>the</strong>se NCDC resources, <strong>the</strong> Dvorak<br />
technique can be applied to estimate TC intensity during <strong>the</strong> satellite era.<br />
NCDC’s extensive archive <strong>of</strong> in-situ data already in <strong>the</strong> process <strong>of</strong> being modernized by <strong>the</strong><br />
Climate Data Modernization <strong>Program</strong> as well as data in <strong>the</strong> paper archives at yet to be discovered<br />
can be made available to <strong>the</strong> global tropical cyclone research community, but necessitates a<br />
coordinated multi-agency effort.<br />
What should we DO<br />
with this data?<br />
Poster Session – Page 35
Getting <strong>the</strong> Surge Message Across<br />
Betty Hearn Morrow 1 , Jeff Lazo 2 , Jamie Rhome 3<br />
(betty@bmorrow.com)<br />
1 SocResearch Miami; 2 NCAR; 3 NOAA/NHC<br />
Major initiatives are underway to improve storm surge forecasting – and to find better ways to<br />
communicate surge risk to vulnerable coastal residents. Evidence continues to reveal that <strong>the</strong><br />
public under-recognizes <strong>the</strong> dangers <strong>of</strong> storm surge. The most recent example is that 15,000<br />
people did not evacuate from Galveston Island for Hurricane Ike in spite <strong>of</strong> a forecast <strong>of</strong> up to 20<br />
feet <strong>of</strong> storm surge. The message regarding <strong>the</strong> 200+ deaths on <strong>the</strong> Mississippi coast from<br />
Hurricane Katrina’s surge was somehow lost.<br />
Acknowledgement <strong>of</strong> <strong>the</strong> need to better understand how people view forecasts and warnings has<br />
resulted in several on-going initiatives within <strong>the</strong> climate and wea<strong>the</strong>r enterprise including <strong>the</strong><br />
social sciences portion <strong>of</strong> NOAA’s Storm Surge Roadmap project and several projects on<br />
Communicating Hurricane Information funded by <strong>the</strong> National Science Foundation. Research<br />
with coastal citizens, local emergency managers and o<strong>the</strong>rs provides evidence that a major<br />
portion <strong>of</strong> <strong>the</strong> population does not understand <strong>the</strong> surge hazard adequately to take appropriate<br />
action. If improvements are not made in <strong>the</strong> public’s understanding <strong>of</strong> storm surge threat,<br />
extensive loss <strong>of</strong> life is likely to occur. Considerable research within numerous fields and<br />
disciplines from <strong>the</strong> social sciences has contributed to a better understanding <strong>of</strong> how people<br />
perceive and react to risk. This presentation will provide an overview <strong>of</strong> <strong>the</strong> research followed by<br />
a discussion <strong>of</strong> several initiatives underway within NOAA to improve <strong>the</strong> public’s understanding<br />
<strong>of</strong> <strong>the</strong> storm surge threat.<br />
Poster Session – Page 36