Fire in the West - Western Forestry Leadership Coalition
Fire in the West - Western Forestry Leadership Coalition
Fire in the West - Western Forestry Leadership Coalition

You also want an ePaper? Increase the reach of your titles
YUMPU automatically turns print PDFs into web optimized ePapers that Google loves.
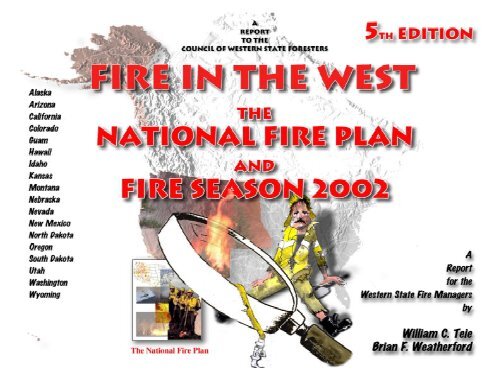
<strong>Fire</strong> <strong>in</strong> <strong>the</strong> <strong>West</strong>, <strong>the</strong> Series<br />
The first edition of <strong>Fire</strong> <strong>in</strong> <strong>the</strong> <strong>West</strong> was published <strong>in</strong> 1998. It was <strong>in</strong>tended to<br />
be a report to <strong>the</strong> Council of <strong>West</strong>ern State Foresters on <strong>the</strong> status of wildland fires<br />
<strong>in</strong> <strong>the</strong> <strong>West</strong>. For <strong>the</strong> first time, a person could f<strong>in</strong>d <strong>in</strong>formation on <strong>the</strong> authorities,<br />
responsibilities and fire protection systems for each of <strong>the</strong> seventeen western state<br />
forestry agencies as well as <strong>the</strong> numbers of fires and acres burned <strong>in</strong> <strong>the</strong> western<br />
states.<br />
In <strong>the</strong> spr<strong>in</strong>g of 2000, <strong>the</strong> <strong>West</strong>ern State <strong>Fire</strong> Managers commissioned a special<br />
study on <strong>the</strong> extent of <strong>the</strong> Wildland/Urban Interface <strong>Fire</strong> Problem <strong>in</strong> <strong>the</strong> <strong>West</strong>. The<br />
third edition of <strong>Fire</strong> <strong>in</strong> <strong>the</strong> <strong>West</strong> was published <strong>in</strong> September of that year. This<br />
report could not have been more timely, because that year <strong>the</strong> <strong>West</strong> burned and <strong>the</strong><br />
wildland/urban <strong>in</strong>terface problem “smacked” us <strong>in</strong> <strong>the</strong> face.<br />
The fourth <strong>in</strong> <strong>the</strong> series of <strong>Fire</strong> <strong>in</strong> <strong>the</strong> <strong>West</strong> documented <strong>the</strong> 2000 fire season.<br />
In this edition <strong>the</strong> federal agency statistics were added, thus really present<strong>in</strong>g <strong>the</strong> full<br />
impacts of fire <strong>in</strong> <strong>the</strong> <strong>West</strong>.<br />
<strong>Fire</strong> <strong>in</strong> <strong>the</strong> <strong>West</strong> will never be a “best seller,” but it has become <strong>the</strong> document<br />
of choice when you want to know someth<strong>in</strong>g about <strong>the</strong> extent that wildland fires<br />
play a key roles <strong>in</strong> <strong>the</strong> <strong>West</strong>ern environment.<br />
Additional Copies<br />
Copies of <strong>Fire</strong> <strong>in</strong> <strong>the</strong> <strong>West</strong> can be purchased from Deer Valley Press. Write or<br />
call Deer Valley Press, 5125 Deer Valley Road, Rescue, CA 95672 or telephone<br />
(530) 676-7401. You can also f<strong>in</strong>d <strong>the</strong>m on <strong>the</strong> “web” at www.deervalleypress.com.
TO: Council of <strong>West</strong>ern State Foresters<br />
FROM: <strong>West</strong>ern State <strong>Fire</strong> Managers,<br />
May 15, 2003<br />
It is an honor to aga<strong>in</strong> provide <strong>the</strong> Council of <strong>West</strong>ern<br />
State Foresters with <strong>the</strong> most complete look at <strong>the</strong> extent and<br />
complexity of <strong>the</strong> wildland fire protection <strong>in</strong> <strong>the</strong> <strong>West</strong>. In this,<br />
<strong>the</strong> 5 th edition of <strong>Fire</strong> <strong>in</strong> <strong>the</strong> <strong>West</strong>, <strong>the</strong>re is special focus on <strong>the</strong><br />
implementation of <strong>the</strong> National <strong>Fire</strong> Plan <strong>in</strong> <strong>the</strong> <strong>West</strong> and a<br />
review of <strong>the</strong> disastrous 2002 fire season.<br />
Some of <strong>the</strong> key po<strong>in</strong>ts that will be highlighted and<br />
supported with facts are:<br />
• The number of fires and acres burned is on <strong>the</strong> <strong>in</strong>crease.<br />
• There will be bigger, more damag<strong>in</strong>g and costlier fires.<br />
• The National <strong>Fire</strong> Plan is provid<strong>in</strong>g much needed fund<strong>in</strong>g,<br />
but it will not last forever, and most of <strong>the</strong> funds are not<br />
be<strong>in</strong>g expended on long-term or permanent fixes to <strong>the</strong><br />
fuel buildup, <strong>the</strong> wildland/urban <strong>in</strong>terface fire problem<br />
and to forest health.<br />
Your fire managers hope this edition of <strong>Fire</strong> <strong>in</strong> <strong>the</strong> <strong>West</strong> is<br />
of value to you and <strong>the</strong>y want to extend <strong>the</strong>ir thanks for <strong>the</strong><br />
cont<strong>in</strong>u<strong>in</strong>g support you give <strong>the</strong>m.<br />
S<strong>in</strong>cerely,<br />
Wayne F. Ch<strong>in</strong>g, Chair<br />
<strong>West</strong>ern State <strong>Fire</strong> Managers<br />
1
Executive Summary<br />
• <strong>Fire</strong> is an <strong>in</strong>tegral part of <strong>the</strong> natural environment <strong>in</strong> <strong>the</strong> <strong>West</strong>. In <strong>Fire</strong> Season 2002,<br />
nearly 40,000 wildfires burned nearly seven million acres <strong>in</strong> <strong>the</strong> seventeen western states,<br />
destroyed hundreds of structures, and killed 21 firefighters <strong>in</strong> <strong>the</strong> <strong>West</strong>.<br />
• All levels of government – federal, state, and local – are ei<strong>the</strong>r directly, or <strong>in</strong>directly,<br />
<strong>in</strong>volved <strong>in</strong> mitigat<strong>in</strong>g <strong>the</strong> wildfire problem, especially <strong>in</strong> <strong>the</strong> wildland/urban <strong>in</strong>terface.<br />
Here, where human improvements are mixed with flammable natural vegetation, lives,<br />
natural resources and property are threatened by <strong>in</strong>creas<strong>in</strong>gly severe wildfires.<br />
• A variety of federal, state, and local government agencies (as well as forest protective<br />
associations) provide wildland fire protection <strong>in</strong> <strong>the</strong> <strong>West</strong>. A variety of protection systems<br />
are provided by <strong>the</strong> 17 western states, rang<strong>in</strong>g from full-scale sophisticated wildland fire<br />
departments to <strong>in</strong>adequate attempts to provide fire prevention education and <strong>in</strong>teragency<br />
coord<strong>in</strong>ation with staff<strong>in</strong>g and fund<strong>in</strong>g. Most states are somewhere <strong>in</strong> between, with not<br />
enough fund<strong>in</strong>g to do <strong>the</strong> job effectively. Fund<strong>in</strong>g mechanisms for <strong>the</strong> state forestry agencies<br />
vary, with many of <strong>the</strong> rural states nearly totally dependent on State <strong>Fire</strong> Assistance<br />
funds from <strong>the</strong> federal government. Local government fire departments rely primarily on<br />
property taxes, benefit assessment fees, or <strong>in</strong> <strong>the</strong> rural all-volunteer fire departments,<br />
donations. There are nearly 6,500 local government fire departments <strong>in</strong> <strong>the</strong> <strong>West</strong>. These<br />
departments are frequently <strong>the</strong> <strong>in</strong>itial attack force on many wildfires and <strong>the</strong> primary<br />
source of resources for structure protection dur<strong>in</strong>g major wildfires.<br />
• The major federal wildland fire agencies have a variety of management goals that <strong>in</strong>fluence<br />
decisions made dur<strong>in</strong>g manag<strong>in</strong>g wildfires on <strong>the</strong> lands <strong>the</strong>y control. State and local<br />
fire protection agencies charged with <strong>the</strong> protection of small parcels <strong>in</strong> multiple ownerships<br />
must be committed to immediate control and ext<strong>in</strong>guishment (i.e. suppression) of<br />
wildfires. As wildfires do not respect jurisdictional or property ownership boundaries,<br />
<strong>the</strong>re are times when adm<strong>in</strong>istrative and operational conflicts can arise between agencies.<br />
Table of Contents<br />
Executive Summary<br />
Wildland <strong>Fire</strong> Protection<br />
Levels of Government (9)<br />
Areas of Responsibility (10)<br />
Protection Schemes (11)<br />
Fund<strong>in</strong>g Sources and Levels (12)<br />
Local <strong>Fire</strong> Departments (13)<br />
Wildland/Urban Interface (14)<br />
Roles and Responsibilities (17)<br />
Suppression Policies (41)<br />
<strong>Fire</strong> Environment (45)<br />
National <strong>Fire</strong> Plan<br />
Competitive Grants (68)<br />
Communities at Risk (70)<br />
Urban Watershed at Risk (80)<br />
Healthy Forests Initiative (97)<br />
Drought and <strong>Fire</strong> Season 2002<br />
Drought and Forest <strong>Fire</strong>s (101)<br />
The 2002 <strong>Fire</strong> Season (105)<br />
Safety and Stategy (114)<br />
Why <strong>Fire</strong>s Will Get Bigger (117)<br />
Major <strong>Fire</strong>s (121)<br />
2002 Statistics (149)<br />
Appendices<br />
Wildland/Urban Interface (190)<br />
Federal Land Ownership (195)<br />
WUI <strong>Fire</strong> History (205)<br />
• Interagency cooperation us<strong>in</strong>g <strong>the</strong> Incident Command System (ICS), Unified Command,<br />
and Multi-Agency Coord<strong>in</strong>at<strong>in</strong>g System (MACS) are <strong>the</strong> key tools for successful<br />
mitigation of major wildfire emergencies. Potential conflicts need to be addressed prior to<br />
3
<strong>the</strong> fire with clear, comprehensive <strong>in</strong>teragency agreements and operat<strong>in</strong>g plans. Jo<strong>in</strong>t<br />
tra<strong>in</strong><strong>in</strong>g, exercises, and command teams <strong>in</strong>volv<strong>in</strong>g all fire agencies provide economy of<br />
scale and assure jurisdictional agency <strong>in</strong>put.<br />
Many factors have been <strong>in</strong>volved <strong>in</strong><br />
“creat<strong>in</strong>g” <strong>the</strong> unhealthy forest<br />
condition <strong>in</strong> <strong>the</strong> <strong>West</strong>.<br />
Homeowners must accept <strong>the</strong><br />
responsibility to provide protection<br />
for <strong>the</strong>ir homes.<br />
• Long-term drought, logg<strong>in</strong>g, <strong>the</strong> exclusion of fire, human development, and a variety of<br />
o<strong>the</strong>r factors have created a situation where most western forests are overstocked, unhealthy,<br />
and at greater risk of catastrophic wildfire than ever before. Wildfires now burn<br />
more <strong>in</strong>tensely, are more resistant to control, and cause greater damage, especially dur<strong>in</strong>g<br />
drought conditions. Extensive preparation and follow-up are necessary to effectively<br />
re<strong>in</strong>troduce (prescribed) fire to <strong>the</strong> ecosystem to improve forest health or reduce fire<br />
danger. These <strong>in</strong>clude large scale tree th<strong>in</strong>n<strong>in</strong>g, brush crush<strong>in</strong>g, and control l<strong>in</strong>e construction,<br />
followed by treatment of emergent undesirable species and plant<strong>in</strong>g of desirable<br />
species. Air quality regulations and <strong>the</strong> threat of civil liability are also h<strong>in</strong>drances to expanded<br />
use of prescribed fire to restore ecosystem health. To be of strategic value, most<br />
fuel reduction projects need to be cooperative, <strong>in</strong>volv<strong>in</strong>g multiple agencies and<br />
landowners.<br />
• The primary values at risk from wildfire, <strong>in</strong> order of priority, are: (1) human health and<br />
safety; (2) critical watersheds/resources (urban water supply, community <strong>in</strong>frastructure,<br />
community economic stability, communities <strong>the</strong>mselves); and, (3) natural resources and<br />
<strong>in</strong>dividual homes. An area of contention between all levels of government has been who is<br />
responsible for protect<strong>in</strong>g structures from encroach<strong>in</strong>g wildfires There is only one correct<br />
answer: everybody; federal, state, and local governments, property owners, and communities<br />
(both urban and rural) all have an important stake <strong>in</strong> wildfire prevention and control.<br />
Homeowners <strong>in</strong> <strong>the</strong> wildland have to accept <strong>the</strong> responsibility to use ignition-resistant<br />
roof<strong>in</strong>g and provide defensible space so that fire suppression forces have a greater chance<br />
of success. Whole communities need to assume responsibility for improv<strong>in</strong>g <strong>the</strong>ir own<br />
protection by provid<strong>in</strong>g fuelbreaks, add<strong>in</strong>g fire defense improvements, and fund<strong>in</strong>g adequate<br />
fire protection. Local governments need to adopt plann<strong>in</strong>g and development regulations<br />
that will reduce <strong>the</strong> exposure of improvements <strong>in</strong> <strong>the</strong> wildland/urban <strong>in</strong>terface to<br />
wildfire and to provide an adequate level of fire protection. State governments need to take<br />
<strong>the</strong> lead <strong>in</strong> provid<strong>in</strong>g an appropriate level of wildfire protection on non-federal lands,<br />
especially <strong>in</strong> <strong>the</strong> wildland/urban <strong>in</strong>terface. The federal agencies need to provide an adequate<br />
level of protection on federal lands, especially those adjo<strong>in</strong><strong>in</strong>g <strong>the</strong> wildland/urban<br />
<strong>in</strong>terface.<br />
4
• The National <strong>Fire</strong> Plan (NFP) is a coord<strong>in</strong>ated federal response to <strong>the</strong> devastat<strong>in</strong>g fire<br />
season of 2000 that seeks to augment federal wildfire protection capability and provide<br />
<strong>in</strong>creased fund<strong>in</strong>g to state and local government agencies to reduce fire hazard and risk,<br />
and to improve wildfire protection capabilities, especially <strong>in</strong> <strong>the</strong> wildland/urban <strong>in</strong>terface<br />
(WUI). The Healthy Forests Initiative attempts to more efficiently employ commercial and<br />
non-commercial harvest methods that can reduce fire danger, improve forest health, and<br />
contribute to local economic growth. <strong>Fire</strong>Wise helps communities organize for large-scale<br />
hazard reduction projects <strong>in</strong> <strong>the</strong> wildland/urban <strong>in</strong>terface. All seventeen western States<br />
have received NFP fund<strong>in</strong>g for a wide variety of projects. The most popular types of<br />
projects are public education,<br />
fuelbreaks, and mechanical<br />
th<strong>in</strong>n<strong>in</strong>g. Many of <strong>the</strong> projects<br />
are cooperative, <strong>in</strong>volv<strong>in</strong>g<br />
multiple government agencies,<br />
community groups, property<br />
owners, public utilities, etc.<br />
Communities-at-risk like Bend<br />
(OR), Spokane (WA), Flagstaff<br />
(AZ), and Oakhurst (CA)<br />
have leveraged federal grant<br />
money with private grants,<br />
cooperate sponsorships, and<br />
volunteer peoplepower to<br />
achieve a common end.<br />
• There is a need for a collaborative<br />
process for identify<strong>in</strong>g<br />
and prioritiz<strong>in</strong>g communities-at-risk<br />
and a standard<br />
methodology for assess<strong>in</strong>g risk<br />
of communities <strong>in</strong> order to<br />
achieve maximum benefit<br />
from limited resources available<br />
under <strong>the</strong> National <strong>Fire</strong><br />
Plan. Flagstaff, AZ is probably<br />
National <strong>Fire</strong> Plan Fund<strong>in</strong>g, by State<br />
Base Fund<strong>in</strong>g (Formula)<br />
State <strong>Fire</strong> Assistance<br />
5<br />
Federal Grants for Fiscal Year 2002<br />
The National <strong>Fire</strong> Plan is <strong>the</strong> federal<br />
response to <strong>Fire</strong> Season 2000.<br />
Alaska $335,609 3.4% $895,391 3.9% $283,657 5.1% $96,628 1.2% $1,611,285 3.5%<br />
Arizona* $897,000 9.1% $2,221,500 9.7% $376,000 6.8% $455,750 5.7% $3,950,250 8.6%<br />
California* $1,000,210 10.1% $937,770 4.1% $954,072 17.3% $662,000 8.3% $3,554,052 7.7%<br />
Colorado* $994,304 10.1% $3,630,435 15.9% $669,643 12.2% $544,000 6.9% $5,838,382 12.7%<br />
Hawaii* $380,651 3.9% $115,480 0.5% $200,599 3.6% $15,000 0.2% $711,730 1.5%<br />
Idaho* $486,800 4.9% $3,530,700 15.5% $184,400 3.3% $935,575 11.8% $5,137,475 11.1%<br />
Kansas $495,000 5.0% $60,000 0.3% $181,000 3.3% $33,537 0.4% $769,537 1.7%<br />
Montana* $603,700 6.1% $1,140,067 5.0% $378,713 6.9% $854,030 10.8% $2,976,510 6.5%<br />
Nebraska* $467,100 4.7% $28,000 0.1% $143,000 2.6% $101,416 1.3% $739,516 1.6%<br />
Nevada* $307,000 3.1% $1,999,936 8.8% $157,681 2.9% $873,928 11.0% $3,338,545 7.2%<br />
New Mexico $72,500 0.7% $2,110,500 9.3% $193,300 3.5% $484,517 6.1% $2,860,817 6.2%<br />
North Dakota* $195,500 2.0% $0 0.0% $407,900 7.4% $228,597 2.9% $831,997 1.8%<br />
Oregon $1,041,395 10.6% $2,953,209 12.9% $416,390 7.6% $816,939 10.3% $5,227,933 11.3%<br />
South Dakota* $584,100 5.9% $346,000 1.5% $197,000 3.6% $222,000 2.8% $1,349,100 2.9%<br />
Utah* $381,134 3.9% $427,000 1.9% $229,229 4.2% $760,000 9.6% $1,797,363 3.9%<br />
Wash<strong>in</strong>gton $383,395 3.9% $1,490,000 6.5% $384,221 7.0% $385,226 4.9% $2,642,842 5.7%<br />
Wyom<strong>in</strong>g* $463,000 4.7% $846,602 3.7% $151,300 2.7% $466,456 5.9% $1,927,358 4.2%<br />
O<strong>the</strong>r(1) $766,300 $80,000 0.4% $0 $0 $846,300<br />
Total $9,854,698 $22,812,590 $5,508,105 $7,935,599 $46,110,992<br />
$32,667,288<br />
Competitive Grants<br />
Volunteer <strong>Fire</strong> Assistance Rural <strong>Fire</strong> Assistance TOTAL (2)<br />
National Total $51,727,402<br />
$10,419,113 $9,942,744 $72,089,259<br />
Source: FY 2002 Performance Report - National <strong>Fire</strong> Plan, January 2003; * <strong>in</strong>dividual state records; (1) Guam and American Samoa, CNMI and o<strong>the</strong>r Pacific<br />
Islands; (2) Not all of <strong>the</strong>se funds are adm<strong>in</strong>istered by <strong>the</strong> State Forester.
The damages to watersheds impact<br />
urban areas miles from <strong>the</strong> fire.<br />
Major fires were <strong>the</strong> result of<br />
decadent forest health and drought.<br />
a model community for <strong>the</strong> comb<strong>in</strong>ed issues of forest health and fire hazard reduction <strong>in</strong><br />
<strong>the</strong> wildland/urban <strong>in</strong>terface. Here overstocked, decadent p<strong>in</strong>e forests surround a thriv<strong>in</strong>g<br />
city with normal high fire danger exacerbated by cont<strong>in</strong>u<strong>in</strong>g drought. A strong coalition of<br />
government agencies, corporate sponsors, and community associations is mak<strong>in</strong>g excellent<br />
progress <strong>in</strong> its attempt to restore forest health and reduce fire hazard <strong>in</strong> <strong>the</strong> metropolitan<br />
area.<br />
• One of <strong>the</strong> most important values at risk from wildfire, urban watershed, was highlighted<br />
<strong>in</strong> 2002 when <strong>the</strong> Hayman <strong>Fire</strong> burned much of <strong>the</strong> Denver watershed on <strong>the</strong> South Platte<br />
River. Many millions of dollars must be <strong>in</strong>vested to reduce erosion and siltation and to<br />
protect <strong>the</strong> municipal water system from potential damage. A severe storm and flood could<br />
<strong>in</strong>capacitate <strong>the</strong> water system for millions of people. The same potential exists <strong>in</strong> hundreds<br />
of western communities. Everybody benefits from watershed fire protection or suffers from<br />
lack of it.<br />
• <strong>Fire</strong> Season 2002 was busy, <strong>in</strong>tense, and difficult throughout <strong>the</strong> <strong>West</strong>, and punctuated by<br />
record-sized fires <strong>in</strong> Arizona, Colorado, and Oregon. Major fires were <strong>the</strong> result of decadent<br />
forest health and<br />
drought. Despite <strong>the</strong> severity<br />
of <strong>the</strong> fire season and <strong>the</strong><br />
scope of damages, <strong>the</strong>re were<br />
some success stories. Often<br />
crown fires were controlled<br />
when <strong>the</strong>y reached a completed<br />
th<strong>in</strong>n<strong>in</strong>g projects,<br />
prov<strong>in</strong>g <strong>the</strong> effectiveness of<br />
<strong>the</strong> concept of fuel reduction;<br />
much of <strong>the</strong> NFP project<br />
work is targeted at wildland/<br />
urban <strong>in</strong>terface communities<br />
that are at greatest risk from<br />
wildfire; and cooperative<br />
efforts improved <strong>the</strong> level of<br />
fire protection <strong>in</strong> many areas.<br />
6
• <strong>Fire</strong>fighter safety should cont<strong>in</strong>ue to be emphasized, but not to <strong>the</strong> extent of employ<strong>in</strong>g<br />
avoidance strategies. <strong>Fire</strong> Order #1: “Fight fire aggressively, but provide for safety first”<br />
needs to be reemphasized.<br />
• <strong>Fire</strong>s will cont<strong>in</strong>ue to get<br />
bigger, costlier, and more<br />
damag<strong>in</strong>g due to exist<strong>in</strong>g<br />
and worsen<strong>in</strong>g wea<strong>the</strong>r and<br />
fuel conditions, wildland/<br />
urban <strong>in</strong>terface spread,<br />
<strong>in</strong>adequate pre-suppression,<br />
failed suppression actions,<br />
strategic and tactical limitations,<br />
legal constra<strong>in</strong>ts,<br />
philosophical differences,<br />
and human factors.<br />
• <strong>Fire</strong> Season 2003 and<br />
years ahead, may be as bad<br />
or worse, depend<strong>in</strong>g on variable wea<strong>the</strong>r conditions, especially if, as is predicted, <strong>the</strong><br />
drought cont<strong>in</strong>ues <strong>in</strong> <strong>the</strong> <strong>West</strong>. Structure loss will cont<strong>in</strong>ue to be high, as <strong>the</strong> wildland/<br />
urban <strong>in</strong>terface cont<strong>in</strong>ues to expand.<br />
Wildland fires <strong>in</strong> <strong>the</strong> <strong>West</strong> will get<br />
bigger, costlier and be more<br />
damag<strong>in</strong>g.<br />
Structure loss will cont<strong>in</strong>ue to be<br />
high!<br />
7
Acknowledgments<br />
<strong>West</strong>ern State <strong>Fire</strong> Managers<br />
Joe Stam, AK<br />
David Behrens, AZ<br />
Jim Wright, CA<br />
Rich Homann, CO<br />
Wayne Ch<strong>in</strong>g, HI<br />
Brian Shiplett, ID<br />
Casey McCoy, KS<br />
Tim Murphy, MT<br />
Don <strong>West</strong>over, NE<br />
Bob Ashworth, NV<br />
Frank Smith, NM<br />
Mike Santucci, ND<br />
Bill Lafferty, OR<br />
Steve Hasenohrl, SD<br />
David Dalrymple, UT<br />
Skip Simmons, WA<br />
Ray Weidenhaft, WY<br />
The authors wish to acknowledge <strong>the</strong> assistance of <strong>the</strong> <strong>West</strong>ern State <strong>Fire</strong> Managers;<br />
without <strong>the</strong>ir help this report would not be possible. We would also like to thank <strong>the</strong> follow<strong>in</strong>g<br />
<strong>in</strong>dividuals who graciously contributed <strong>the</strong>ir time, knowledge and experience to this report:<br />
Arizona:<br />
Kev<strong>in</strong> Boness and Russ Shumate, ASLD <strong>Fire</strong> Management Division<br />
Ken Butler and George Leech, BIA Ft. Apache Agency<br />
Brian Cottam, Greater Flagstaff Forests Partnership<br />
Colorado:<br />
Jim Hubbard and Chuck Dennis, Colorado State Forest Service<br />
Idaho:<br />
Mike Tennery, Idaho Department of Lands<br />
Larry Isenberg and Lori Barnes, <strong>Fire</strong>Smart Kootenai County<br />
Roberta Black, Kootenai County Local Emergency Plann<strong>in</strong>g Committee<br />
Peggy Polichio, Idaho Department of Lands and Idaho National Forest<br />
Montana:<br />
Paula Rosenthal, Montana Department of Natural Resources Conservation<br />
Sherry Devl<strong>in</strong>, <strong>the</strong> Missoulian.<br />
Oregon:<br />
Dan Thorpe, Oregon Department of <strong>Forestry</strong><br />
Chief Bret Fillis, Applegate Valley Rural <strong>Fire</strong> Protection District No. 9<br />
Greg Chandler and Brian Keat<strong>in</strong>g, BLM Medford District.<br />
Council of <strong>West</strong>ern State Foresters<br />
Jeff Jahnke, Liaison with <strong>the</strong> <strong>West</strong>ern State Foresters<br />
Jim Lawrence, <strong>West</strong>ern <strong>Forestry</strong> Coord<strong>in</strong>ation Center<br />
8
Introduction<br />
Before we beg<strong>in</strong> discuss<strong>in</strong>g <strong>the</strong> National <strong>Fire</strong> Plan and <strong>the</strong> extent of <strong>the</strong> 2002 fire season,<br />
we need to present some background on <strong>the</strong> fire problem <strong>in</strong> <strong>the</strong> <strong>West</strong> and how each of <strong>the</strong><br />
wildland firefight<strong>in</strong>g agencies is organized.<br />
<strong>Fire</strong> <strong>in</strong> <strong>the</strong> <strong>West</strong> was first published to document <strong>the</strong> extent and nature of wildfire <strong>in</strong> <strong>the</strong><br />
<strong>West</strong>ern United States. It for <strong>the</strong> first time documented <strong>the</strong> numbers of fires, by size class and<br />
type, for <strong>the</strong> 17 western states. It also described <strong>the</strong> authorities and responsibilities of each of<br />
<strong>the</strong> state forestry organizations. The first edition of <strong>Fire</strong> <strong>in</strong> <strong>the</strong> <strong>West</strong> was published <strong>in</strong> 1998, and<br />
with<strong>in</strong> it <strong>the</strong>re was also <strong>the</strong> first attempt to def<strong>in</strong>e levels of wildland fire protection.<br />
<strong>Fire</strong> <strong>in</strong> <strong>the</strong> <strong>West</strong> is a report to <strong>the</strong><br />
Council of <strong>West</strong>ern State Foresters<br />
on <strong>the</strong> status of fire <strong>in</strong> <strong>the</strong> <strong>West</strong>.<br />
Wildland <strong>Fire</strong> Protection <strong>in</strong> <strong>the</strong> <strong>West</strong><br />
<strong>Fire</strong> is an <strong>in</strong>tegral part of <strong>the</strong> natural environment of <strong>the</strong> <strong>West</strong>ern United States. Each year<br />
thousands of fires damage or destroy hundreds of thousands of acres of grass, brush, and timber.<br />
More and more frequently, structures are destroyed and lives put at risk by wildfire throughout<br />
<strong>the</strong> <strong>West</strong>. <strong>Fire</strong> respects no governmental boundaries, so it crosses <strong>the</strong>m regularly. The follow<strong>in</strong>g<br />
def<strong>in</strong>itions will give <strong>the</strong> reader a basic understand<strong>in</strong>g of <strong>the</strong> complications <strong>in</strong>volved with wildland<br />
fire protection.<br />
<strong>Fire</strong> is an important part of <strong>the</strong> natural<br />
environment.<br />
Levels of Government<br />
In <strong>the</strong> United States, <strong>the</strong>re are three basic levels of government: local, state and federal.<br />
Each level of government has different authorities and responsibilities.<br />
• Local government is def<strong>in</strong>ed as <strong>in</strong>corporated cities, counties, boroughs, or special districts.<br />
There are thousands of local entities <strong>in</strong> <strong>the</strong> <strong>West</strong>, most of which have <strong>the</strong>ir own fire authority<br />
or agency. The protection of life and property is <strong>the</strong> primary function of a local government<br />
fire department. The vast majority of local fire agencies are not adequately tra<strong>in</strong>ed or<br />
equipped to fight wildland fires.<br />
9
• State governments address <strong>the</strong> wildfire issue <strong>in</strong> vary<strong>in</strong>g ways. Several states have adopted<br />
laws that direct <strong>the</strong> State Forester to provide wildland fire protection and provide fund<strong>in</strong>g,<br />
personnel, and equipment to deliver services. O<strong>the</strong>r states give <strong>the</strong> responsibility of provid<strong>in</strong>g<br />
wildland fire protection to <strong>the</strong> State Forester, but do not provide fund<strong>in</strong>g for such protection.<br />
Only Nevada has given it’s State Forester <strong>the</strong> responsibility to provide protection to <strong>the</strong> same<br />
level as traditional local government fire departments. In most states, <strong>the</strong>re may be more than<br />
one state agency that has some role to play <strong>in</strong> wildland fire protection. There are <strong>the</strong> State<br />
Forester, <strong>the</strong> State Emergency Services agency, <strong>the</strong> National Guard, and <strong>the</strong> State <strong>Fire</strong> Marshal,<br />
to name a few.<br />
Shar<strong>in</strong>g protection responsibilities<br />
between agencies is common.<br />
• Federal land management agencies provide differ<strong>in</strong>g levels of wildland fire protection depend<strong>in</strong>g<br />
on <strong>the</strong>ir authorities and responsibilities. The levels of fire protection provided by <strong>the</strong><br />
USDA Forest Service and <strong>the</strong> USDI Bureau of Land Management differ from that provided<br />
by <strong>the</strong> USDI National Park Service, simply because <strong>the</strong>ir missions are different.<br />
In some cases, <strong>the</strong> various authorities and responsibilities between federal, state and local<br />
agencies may be overlapp<strong>in</strong>g and <strong>in</strong> conflict. This can lead to confusion and frustration. The<br />
wildland fire protection problem is fur<strong>the</strong>r compounded by <strong>the</strong> fact that <strong>the</strong>se types of fires<br />
know no boundaries.<br />
Areas of Responsibility<br />
There are many different areas of responsibility. The area of responsibility for a city or<br />
special district is easily def<strong>in</strong>ed; it is <strong>the</strong> area with<strong>in</strong> <strong>the</strong> city limits or district. The area of<br />
responsibility for a federal agency is <strong>the</strong> land <strong>the</strong>y adm<strong>in</strong>ister. The area of responsibility for a<br />
State is usually most complex. This area, called state responsibility area, is def<strong>in</strong>ed <strong>in</strong> a piece<br />
of legislation that places “qualifiers” on <strong>the</strong> land. It may be land owned by <strong>the</strong> State, or all<br />
forested lands with<strong>in</strong> <strong>the</strong> State that are not with<strong>in</strong> an <strong>in</strong>corporated city or owned by <strong>the</strong> federal<br />
government, or all privately owned forested lands.<br />
A direct protection area is that area of <strong>the</strong> State where State forces provide direct fire<br />
protection. The direct protection area usually <strong>in</strong>cludes state responsibility area, but it also may<br />
<strong>in</strong>clude lands of ano<strong>the</strong>r agency that it protects under <strong>the</strong> authority of a cooperative agreement.<br />
The best example of this type of protection is when a state protects federal lands that are adjacent<br />
to state protected lands, or when <strong>the</strong> Forest Service protects private lands with<strong>in</strong> <strong>the</strong> national<br />
forest.<br />
10
A local protection area is an area where <strong>the</strong> State has not<br />
declared it has a direct responsibility. This may be nonforested<br />
areas with<strong>in</strong> a city or fire district. The primary fire<br />
protection responsibility <strong>in</strong> <strong>the</strong>se areas lies with a local governmental<br />
entity, or <strong>the</strong>re may be no protection at all.<br />
Protection Schemes (State <strong>Forestry</strong> Agencies)<br />
To fully understand <strong>the</strong> extent of <strong>the</strong> wildland fire protection<br />
<strong>in</strong> <strong>the</strong> <strong>West</strong>, <strong>the</strong>re has to be a discussion of <strong>the</strong> various<br />
types of protection provided by <strong>the</strong> States. As mentioned, <strong>the</strong>re<br />
is a vast difference <strong>in</strong> <strong>the</strong> authorities, responsibilities, and <strong>the</strong><br />
levels of protection provided (Figure 1). There are three general<br />
types of wildland fire protection provided by <strong>the</strong> States:<br />
• Direct Protection – A State is provid<strong>in</strong>g direct protection<br />
when it provides fund<strong>in</strong>g for personnel and equipment to<br />
protect it’s state responsibility area. There is a command<br />
authority and direct employment of firefight<strong>in</strong>g personnel<br />
designated to provide protection. Examples: Alaska, California,<br />
Idaho, Montana, Oregon, and Wash<strong>in</strong>gton.<br />
Area Protected (<strong>in</strong> acres)<br />
Direct Cooperative Coord<strong>in</strong>ation Total<br />
Alaska 151,695,898 151,695,898<br />
Arizona 22,200,000 22,200,000<br />
California 31,174,492 11,000,000 42,174,492<br />
Colorado 25,958,109 15,474,870 41,432,979<br />
Hawaii 850,000 3,306,300 4,156,300<br />
Idaho 6,025,690 6,025,690<br />
Kansas 46,400,000 46,400,000<br />
Montana 5,164,927 45,309,480 50,474,407<br />
Nebraska 49,083,520 49,083,520<br />
Nevada 11,999,791 20,919,540 32,919,331<br />
New Mexico 42,500,000 42,500,000<br />
North Dakota 31,878,661 31,878,661<br />
Oregon 11,300,000 2,300,000 13,600,000<br />
South Dakota 949,117 47,000,000 47,949,117<br />
Utah 15,000,000 15,000,000<br />
Wash<strong>in</strong>gton 12,637,000 12,637,000<br />
Wyom<strong>in</strong>g 4,237,000 24,863,000 29,100,000<br />
• Cooperative Protection – A state is provid<strong>in</strong>g cooperative<br />
protection when it provides fund<strong>in</strong>g for <strong>the</strong> protection of it’s<br />
state responsibility area, but provides <strong>the</strong> protection us<strong>in</strong>g<br />
o<strong>the</strong>r agencies’ forces under a cooperative agreement. There<br />
is a command authority and limited firefight<strong>in</strong>g forces, but<br />
<strong>the</strong> primary firefight<strong>in</strong>g forces are ano<strong>the</strong>r agency’s employees.<br />
Examples: Arizona, New Mexico and Utah.<br />
• Coord<strong>in</strong>ated Protection – A State is provid<strong>in</strong>g coord<strong>in</strong>ated<br />
protection when it does not have fund<strong>in</strong>g to provide suppression activities, but provides coord<strong>in</strong>ation of<br />
wildland fire prevention activities and suppression efforts throughout <strong>the</strong> State. <strong>Fire</strong> protection of<br />
privately owned lands is <strong>the</strong> responsibility of local agencies. Examples: North Dakota, Kansas, and<br />
Nebraska.<br />
11<br />
261,992,024 138,309,480 238,925,891 639,227,395<br />
Figure 1. Each State def<strong>in</strong>es its responsibility differently. If <strong>the</strong> State establishes<br />
a direct protection area and provides fund<strong>in</strong>g and resources to protect it, this is<br />
direct protection. O<strong>the</strong>r States may take <strong>the</strong> responsibility to assist <strong>in</strong> protection,<br />
but use forces from o<strong>the</strong>r agencies to protect <strong>the</strong> area...this is considered<br />
cooperative protection. The third type of protection is coord<strong>in</strong>ated protection.<br />
This is when <strong>the</strong> State has given <strong>the</strong> State Forester broad responsibilities, but<br />
limited fund<strong>in</strong>g to provide <strong>the</strong> protection.
The States use various sources to<br />
fund fire protection.<br />
There may be hybrids of <strong>the</strong>se three types of protection. An example is Montana. They<br />
provide direct protection to 5 million acres of privately or State owned lands, but <strong>the</strong>y also<br />
provide cooperative protection on 45 million acres of non-forested private lands <strong>in</strong> <strong>the</strong> eastern<br />
part of <strong>the</strong> State.<br />
Fund<strong>in</strong>g Sources and Levels of Protection<br />
The States use various sources to fund fire protection (Figure 2). Some use general fund<br />
revenues, o<strong>the</strong>rs use fees collected specifically for wildland fire protection. California is unique<br />
<strong>in</strong> that it contracts with local entities to provide municipal type fire protection services, but can<br />
use <strong>the</strong>se forces to supplement it’s wildland fire protection operations. Nevada is unique also <strong>in</strong><br />
that <strong>the</strong>y have <strong>the</strong> responsibility to provide full service fire protection <strong>in</strong> specific areas, just as<br />
any municipal fire department would.<br />
The federal government also provides State and<br />
local entities with funds. There are two USDA<br />
Forest Service grant programs, State <strong>Fire</strong> Assistance<br />
(previously know as <strong>the</strong> Rural <strong>Fire</strong> Prevention and<br />
Control Program) used to fund certa<strong>in</strong> State fire<br />
programs, and Volunteer <strong>Fire</strong> Assistance (previously<br />
know as <strong>the</strong> Rural Community <strong>Fire</strong> Protection<br />
Program) used to fund rural fire protection programs.<br />
Volunteer <strong>Fire</strong> Assistance and State <strong>Fire</strong><br />
Assistance are match<strong>in</strong>g grant programs adm<strong>in</strong>istered<br />
by <strong>the</strong> various State Foresters. There is also a<br />
new USDI grant program, Rural <strong>Fire</strong> Assistance,<br />
that is available.<br />
Figure 2. Wildland fire protection can be very complicated. There may be areas where <strong>the</strong> protection<br />
responsibilities overlap and may even be <strong>in</strong> conflict. Local authority is usually <strong>the</strong> simplest. State<br />
responsibilities differ with each State and usually overlay local government. Federal protection<br />
responsibilities differ between <strong>the</strong> agencies, and <strong>the</strong> federal government provides some fund<strong>in</strong>g to <strong>the</strong><br />
States and volunteer organizations <strong>in</strong> <strong>the</strong> <strong>West</strong>.<br />
Fund<strong>in</strong>g Levels<br />
The fund<strong>in</strong>g of <strong>the</strong> various State forestry organizations<br />
varies as widely as <strong>the</strong>ir authorities. California<br />
has by far <strong>the</strong> largest program. The millions<br />
<strong>the</strong>y are budgeted covers <strong>the</strong> cost of one of <strong>the</strong><br />
largest fire protection programs <strong>in</strong> <strong>the</strong> world.<br />
12
Federal fund<strong>in</strong>g is a significant source of fund<strong>in</strong>g for several States. The loss of this<br />
money to <strong>the</strong> States would jeopardize <strong>the</strong>ir programs. Each year <strong>the</strong> <strong>West</strong>ern States receive<br />
several million dollars under <strong>the</strong> State <strong>Fire</strong> Assistance<br />
program. Also, <strong>the</strong> federal government funds a limited<br />
number of volunteer fire operations.<br />
Local Government <strong>Fire</strong> Departments<br />
Every State forestry organization attempts to ma<strong>in</strong>ta<strong>in</strong><br />
good work<strong>in</strong>g relationships with <strong>the</strong> fire departments<br />
with<strong>in</strong> <strong>the</strong>ir State. The number of fire departments varies<br />
greatly <strong>in</strong> <strong>the</strong> <strong>West</strong>. Hawaii has only seven to deal with<br />
where California has over 900 fire departments <strong>in</strong> <strong>the</strong><br />
State. There are over 6,000 local fire departments <strong>in</strong> <strong>the</strong><br />
<strong>West</strong>ern States (Figure 3). The actual number of fire<br />
departments is actually decreas<strong>in</strong>g, due to consolidations.<br />
Several States rely totally on local departments to<br />
suppress wildland fires with<strong>in</strong> <strong>the</strong> State. In <strong>the</strong> rema<strong>in</strong><strong>in</strong>g<br />
States, <strong>the</strong> local fire departments are used for <strong>in</strong>itial attack,<br />
and when <strong>the</strong> situation becomes critical <strong>the</strong> fire departments<br />
are called upon to provide depth to <strong>the</strong> fire attack.<br />
Local fire departments often play a major role <strong>in</strong><br />
protect<strong>in</strong>g structures that are be<strong>in</strong>g threatened by a wildland/urban<br />
<strong>in</strong>terface fire. None of <strong>the</strong> western States can<br />
adequately deal with a wildland/urban <strong>in</strong>terface fire situation<br />
without <strong>the</strong> assistance of local fire departments and<br />
<strong>the</strong> cooperation of <strong>the</strong> Federal land management agencies.<br />
In some parts of <strong>the</strong> <strong>West</strong>, rural fire departments are not<br />
supported by tax<strong>in</strong>g authorities.<br />
Number of Local<br />
<strong>Fire</strong> Departments<br />
Alaska 288<br />
Arizona 252<br />
California 927<br />
Colorado 398<br />
Hawaii 7<br />
Idaho 170<br />
Kansas 673<br />
Montana 412<br />
Nebraska 490<br />
Nevada 211<br />
New Mexico 359<br />
North Dakota 396<br />
Oregon 438<br />
South Dakota 364<br />
Utah 230<br />
Wash<strong>in</strong>gton 560<br />
Wyom<strong>in</strong>g 235<br />
6,410<br />
Figure 3. Local fire departments play a<br />
vital role <strong>in</strong> <strong>the</strong> protection of each state’s<br />
wildland resources. They especially come<br />
<strong>in</strong>to play for structure protection dur<strong>in</strong>g a<br />
wildland/urban <strong>in</strong>terface fire.<br />
Local fire departments are key<br />
resources for <strong>in</strong>itial attack and<br />
structure protection.<br />
13
The Wildland/Urban Interface<br />
The wildland/urban <strong>in</strong>terface fire<br />
problem is not just a problem <strong>in</strong><br />
California...it is a problem <strong>in</strong> <strong>the</strong> <strong>West</strong>.<br />
The wildland/urban <strong>in</strong>terface fire problem has existed for hundreds of years. As early as<br />
1793 <strong>the</strong> Governor of Upper and Lower California issued a proclamation that “prohibited all<br />
k<strong>in</strong>ds of burn<strong>in</strong>g, not only <strong>in</strong> <strong>the</strong> vic<strong>in</strong>ity of towns, …which cause some<br />
detriment…”. In <strong>the</strong> last 50 years <strong>the</strong> problem has become more complex<br />
as <strong>the</strong> population has grown and more development has moved<br />
<strong>in</strong>to <strong>the</strong> wildlands. Start<strong>in</strong>g with <strong>the</strong> Bel Air <strong>Fire</strong> <strong>in</strong> 1961,<br />
California became a focal po<strong>in</strong>t for this new fire problem,<br />
where forest or brush fires moved <strong>in</strong>to, and<br />
sometimes through, residential subdivisions,<br />
destroy<strong>in</strong>g large numbers of homes. In <strong>the</strong> last 20<br />
years of <strong>the</strong> Twentieth Century, <strong>the</strong> wildland/urban<br />
<strong>in</strong>terface fire problem began to appear <strong>in</strong> such<br />
geographically diverse areas as central Florida,<br />
eastern Wash<strong>in</strong>gton, central Colorado, and even<br />
Long Island, New York. Now, each fire season<br />
seems to produce several major wildfires somewhere<br />
<strong>in</strong> <strong>the</strong> United States, and especially <strong>in</strong> <strong>the</strong><br />
<strong>West</strong>, that destroy large numbers of homes or<br />
o<strong>the</strong>r build<strong>in</strong>gs.<br />
Def<strong>in</strong>itions<br />
The wildland/urban <strong>in</strong>terface is any area where humans and <strong>the</strong>ir developments meet or<br />
are <strong>in</strong>termixed with wildland fuels. These locations can be as different as <strong>the</strong> p<strong>in</strong>e forests of<br />
Flagstaff, <strong>the</strong> brush fields of San Bernard<strong>in</strong>o, <strong>the</strong> palmetto thickets of Orlando, or <strong>the</strong> maple<br />
forests of Boston. Anywhere that build<strong>in</strong>gs are erected <strong>in</strong> <strong>the</strong> woods, sooner or later, wildfire<br />
will be a threat to those build<strong>in</strong>gs.<br />
In recent years, fire professionals have developed standardized term<strong>in</strong>ology to describe<br />
four different wildland/urban <strong>in</strong>terface conditions: Interface, Intermix, Occluded, and Rural<br />
(See Appendix for complete def<strong>in</strong>itions). These common descriptors allow for <strong>in</strong>terchange of<br />
data and ideas among fire professionals from different regions on how to mitigate this grow<strong>in</strong>g<br />
wildland/urban <strong>in</strong>terface fire problem.<br />
14
Responsibilities<br />
Historically, protect<strong>in</strong>g structures (especially houses) from fire has<br />
been a function of local government, ei<strong>the</strong>r through volunteer fire<br />
departments <strong>in</strong> small towns, or full-time paid firefighters <strong>in</strong> large<br />
cities. In <strong>the</strong> post WWII period of expansion of wildland fire<br />
protection <strong>in</strong> <strong>the</strong> US, wildland firefight<strong>in</strong>g became a separate<br />
dist<strong>in</strong>ct specialty fire profession. After all, fight<strong>in</strong>g fire <strong>in</strong><br />
<strong>the</strong> forest was very different than fight<strong>in</strong>g a fire <strong>in</strong> a<br />
house. Thus, municipal firefighters learned how to fight<br />
house fires and wildland firefighters learned how to<br />
fight wildfires, and seldom did <strong>the</strong> two meet.<br />
Wildfires destroy homes every year.<br />
As <strong>the</strong> houses spread <strong>in</strong>to <strong>the</strong> wildlands,<br />
however, conflicts arose over whose responsibility it was (both physically<br />
and f<strong>in</strong>ancially) to protect structures from encroach<strong>in</strong>g wildfires.<br />
The federal wildland fire agencies did not want to bear <strong>the</strong> rapidly<br />
<strong>in</strong>creas<strong>in</strong>g costs of structure protection <strong>in</strong> <strong>the</strong> wildland/urban <strong>in</strong>terface,<br />
and local government did not want to have to bear <strong>the</strong> costs of sav<strong>in</strong>g<br />
houses from fires managed, and sometimes created, by <strong>the</strong> feds. Nei<strong>the</strong>r<br />
side wanted to absorb <strong>the</strong> cost of <strong>the</strong> specialized tra<strong>in</strong><strong>in</strong>g and<br />
equipment necessary to allow <strong>the</strong>ir firefighters to fight <strong>the</strong> o<strong>the</strong>r k<strong>in</strong>d<br />
of fire. State wildfire agencies were frequently caught <strong>in</strong> <strong>the</strong> middle,<br />
try<strong>in</strong>g to broker deals for enough structural fire resources to save a<br />
community with no assurance if and by whom <strong>the</strong>se resource would be<br />
paid. Frequently Federal Emergency Management Agency funds have been<br />
used to pay <strong>the</strong> cost of try<strong>in</strong>g to save a house from a wildfire as well as <strong>the</strong><br />
cost of rebuild<strong>in</strong>g <strong>the</strong> house when that effort failed.<br />
As <strong>the</strong> wildland/urban <strong>in</strong>terface fire problem cont<strong>in</strong>ues to spread, fire<br />
professionals from all agencies have found it necessary to better prepare to<br />
jo<strong>in</strong>tly participate <strong>in</strong> <strong>the</strong> protection of structures and communities from wildfires.<br />
Federal wildland fire management teams have learned to call upon<br />
municipal fire officers for <strong>the</strong> expertise and resources needed to prepare and<br />
execute effective structure protection plans dur<strong>in</strong>g major wildfires. In some<br />
15
states, <strong>in</strong>teragency agreements have decided <strong>in</strong> advance who will have not only <strong>the</strong> physical<br />
responsibility for structure protection, but also <strong>the</strong> f<strong>in</strong>ancial responsibility.<br />
Adequate clearance is key!<br />
Solutions<br />
The key to successful fire operations <strong>in</strong> <strong>the</strong> wildland/urban <strong>in</strong>terface is for all jurisdictional<br />
agencies to agree <strong>in</strong> advance to <strong>the</strong>ir specific roles and levels of f<strong>in</strong>ancial commitment <strong>in</strong><br />
<strong>the</strong> event of a wildfire. The most promis<strong>in</strong>g solutions to <strong>the</strong> wildland/urban <strong>in</strong>terface fire problem<br />
<strong>in</strong> <strong>the</strong> <strong>West</strong> are com<strong>in</strong>g from communities where federal, state, and local government fire<br />
agencies have banded toge<strong>the</strong>r with community associations, local bus<strong>in</strong>ess, and service organizations<br />
to educate homeowners about <strong>the</strong> issue, sponsor projects to reduce fire hazards <strong>in</strong> <strong>the</strong><br />
<strong>in</strong>terface, and preplan a jo<strong>in</strong>t response to wildfires.<br />
The <strong>Fire</strong>Wise project has provided hundreds of<br />
community leaders <strong>the</strong> tools to undertake wildfire<br />
mitigation projects. State forestry agencies are us<strong>in</strong>g<br />
grant fund<strong>in</strong>g from a variety of sources to educate<br />
<strong>in</strong>dividual property owners on <strong>the</strong> importance of<br />
creat<strong>in</strong>g and ma<strong>in</strong>ta<strong>in</strong><strong>in</strong>g defensible space around<br />
<strong>the</strong>ir homes, and to underwrite local community<br />
efforts <strong>in</strong> fire hazard reduction, especially <strong>the</strong> creation<br />
of community fuelbreaks and th<strong>in</strong>n<strong>in</strong>g of<br />
forests <strong>in</strong> and near communities.<br />
The wildland/urban <strong>in</strong>terface fire problem is<br />
widespread and complex, and <strong>the</strong> local solutions<br />
will be successful only when all of <strong>the</strong> parties<br />
assume <strong>the</strong>ir fair share of <strong>the</strong> responsibility.<br />
16
Roles and Responsibilities<br />
<strong>Fire</strong> is part of <strong>the</strong> <strong>West</strong>. It is a good friend when used properly. It is an enemy when it kills,<br />
destroys property, watersheds, soils and livelihoods. Each of <strong>the</strong> states have developed fire<br />
protection systems that match <strong>the</strong>ir need. Each of <strong>the</strong> wildland fire agencies <strong>in</strong> <strong>the</strong> <strong>West</strong> has<br />
different roles and responsibilities, as determ<strong>in</strong>ed by legislation and adm<strong>in</strong>istrative regulations<br />
at both <strong>the</strong> federal and state levels.<br />
Federal Wildland Agencies<br />
The five federal land management agencies have different missions for stewardship of<br />
<strong>the</strong> public lands under <strong>the</strong>ir jurisdiction, some aspects of which may h<strong>in</strong>der traditional fire<br />
control methods or treat fire differently than adjacent/affected neighbors. These agencies and<br />
<strong>the</strong>ir fire missions are:<br />
• USDA Forest Service (FS): Adm<strong>in</strong>isters National Forest System Lands with objectives<br />
rang<strong>in</strong>g from <strong>in</strong>tensive specific uses (e.g. recreation, timber production) to wilderness<br />
preservation, to protection of rare and endangered species. <strong>Fire</strong> is sometimes<br />
viewed as a management tool to help meet planned resource management objectives.<br />
Personnel are tra<strong>in</strong>ed as wildland (not structural) firefighters and an extensive fire<br />
protection <strong>in</strong>frastructure exists <strong>in</strong> <strong>the</strong> <strong>West</strong>.<br />
The federal wildland agencies<br />
adm<strong>in</strong>ister over 650 million acres <strong>in</strong><br />
<strong>the</strong> <strong>West</strong>.<br />
• USDI Bureau of Land Management (BLM): Adm<strong>in</strong>isters public doma<strong>in</strong> lands,<br />
which <strong>in</strong> many cases <strong>in</strong> <strong>the</strong> <strong>West</strong> are lands unsuitable for grow<strong>in</strong>g commercial timber<br />
and are grass, sage, and brush-covered rangelands used historically primarily for livestock<br />
graz<strong>in</strong>g. Land use objectives range from <strong>in</strong>tensive special use (e.g. m<strong>in</strong><strong>in</strong>g, oil<br />
production, recreation) to protection of endangered species. <strong>Fire</strong> is viewed as a management<br />
tool to help meet preplanned natural resource objectives. Personnel are tra<strong>in</strong>ed as<br />
wildland (not structural) firefighters and a significant fire protection <strong>in</strong>frastructure exists<br />
<strong>in</strong> geographically separated areas of significant landhold<strong>in</strong>gs. Much BLM land receives<br />
primary wildland fire protection from state or local government fire agencies due to its<br />
be<strong>in</strong>g scattered, small parcels.<br />
• USDI National Park Service (NPS): Adm<strong>in</strong>isters national parks, monuments, and<br />
recreation areas with a primary mission of preservation of natural resources or historic<br />
artifacts. <strong>Fire</strong> is viewed as a natural part of <strong>the</strong> ecosystem and human <strong>in</strong>tervention is<br />
17
discouraged, except to protect lives and valuable improvements on <strong>the</strong> land. Because it often<br />
has “exclusive jurisdiction”, most NPS firefighters are tra<strong>in</strong>ed and properly equipped to<br />
provide both wildland and structural fire protection services, as well as emergency medical<br />
care. Its fire protection <strong>in</strong>frastructure varies with <strong>the</strong> size and public use of <strong>the</strong> specific<br />
location and is widely scattered.<br />
The federal wildland agencies are not<br />
responsible for <strong>the</strong> protection of<br />
structures.<br />
• USDI Fish and Wildlife Service (FWS): Adm<strong>in</strong>isters National Wildlife Refuges with a<br />
primary mission to protect habitat for wildlife. <strong>Fire</strong> is seen as a habitat management tool <strong>in</strong><br />
some ecosystems, but because of <strong>the</strong> small size of most refuges, wildfire from outside<br />
sources can be a significant threat to <strong>the</strong> whole refuge and is aggressively controlled. With<br />
<strong>the</strong> exception of a few very large refuges, <strong>the</strong> FWS has few tra<strong>in</strong>ed wildland fire personnel<br />
and a m<strong>in</strong>imal amount of fire protection equipment, rely<strong>in</strong>g for most fire protection on<br />
neighbor<strong>in</strong>g state or local government fire agencies.<br />
Federal Land Ownership Data<br />
Forest Service<br />
Bur of Land<br />
Management<br />
Bur of Indian<br />
Affairs<br />
Fish and<br />
Wildlife<br />
Service<br />
• USDI Bureau of Indian Affairs (BIA): Adm<strong>in</strong>isters Indian Reservations with <strong>the</strong> primary<br />
goal of protect<strong>in</strong>g and provid<strong>in</strong>g resources that contribute to <strong>the</strong> social and economic<br />
well be<strong>in</strong>g of numerous tribes of Native Americans. <strong>Fire</strong> is used as a management tool to<br />
meet specific planned resource management objectives and wildfire is controlled as a public<br />
Areas, <strong>in</strong> acres.<br />
National<br />
Park Service<br />
Dept of<br />
Defense<br />
18<br />
O<strong>the</strong>r<br />
Federal<br />
TOTAL<br />
Alaska 22,004,745 86,908,060 1,140,410 76,321,037 52,891,681 1,677,718 22,851 240,966,502<br />
Arizona 11,250,693 14,252,778 20,718,207 1,716,858 2,629,633 1,219,717 2,751 51,790,637<br />
California 20,627,691 14,556,074 191,020 323,642 4,615,013 1,753,493 434,695 42,501,628<br />
Colorado 14,501,592 8,296,512 32,835 81,574 574,689 415,473 358,175 24,260,850<br />
Hawaii 1 0 0 288,511 220,410 127,734 1,627 638,283<br />
Idaho 20,442,651 11,847,328 55,700 76,068 86,866 14,402 1,067,840 33,590,855<br />
Kansas 108,175 0 40,234 58,332 698 143,447 97,088 447,974<br />
Montana 16,872,610 8,060,382 1,074,907 1,153,013 1,221,314 2,540 316,204 28,700,970<br />
Nebraska 352,133 6,580 66,469 172,360 5,863 18,703 119,139 741,247<br />
Nevada 5,815,856 47,844,391 1,233,000 2,318,069 165,500 484,965 1,699,739 59,561,520<br />
New Mexico 9,326,599 12,770,569 8,349,148 384,251 371,827 3,180,226 453,865 34,836,485<br />
North Dakota 1,105,779 59,717 866,896 487,654 71,640 2,112 1,273,320 3,867,118<br />
Oregon 15,664,078 16,223,739 796,588 557,479 194,859 31,072 133,625 33,601,440<br />
South Dakota 2,013,628 279,869 5,002,056 198,086 263,629 890 60,455 7,818,613<br />
Utah 8,112,462 22,877,713 2,331,094 419,169 2,015,426 939,973 660,613 37,356,450<br />
Wash<strong>in</strong>gton 9,174,956 370,110 2,602,254 186,369 1,932,401 433,251 752,979 15,452,320<br />
Wyom<strong>in</strong>g 9,258,281 18,383,926 1,889,532 86,486 2,393,198 9,512 815,841 32,836,776<br />
TOTAL 166,631,930 262,737,748 46,390,350 84,828,958 69,654,647 10,455,228 8,270,807 648,969,668<br />
nuisance. Only <strong>the</strong> largest reservations<br />
have tra<strong>in</strong>ed fire personnel and fire<br />
protection equipment. Many small<br />
reservations receive primary fire protection<br />
from state or local government fire<br />
agencies. A recent development is <strong>the</strong><br />
<strong>in</strong>creased economic vigor of those tribes<br />
that have developed cas<strong>in</strong>os, which<br />
provide enough revenue that several<br />
tribal governments have developed <strong>the</strong>ir<br />
own <strong>in</strong>dependent fire departments.<br />
The roles and responsibilities of <strong>the</strong><br />
wildland fire (state forestry) agencies <strong>in</strong><br />
each of <strong>the</strong> 17 western states are outl<strong>in</strong>ed<br />
<strong>in</strong> <strong>the</strong> next section of this report.
State <strong>Forestry</strong> Agency<br />
Responsibilities and Protection Systems<br />
19
Alaska Division of <strong>Forestry</strong> - The Alaska Division of <strong>Forestry</strong> is a<br />
division with<strong>in</strong> <strong>the</strong> Department of Natural Resources.<br />
Responsibility<br />
The Commissioner of <strong>the</strong> Department of Natural Resources is charged with ...<strong>the</strong> protection<br />
of forested land <strong>in</strong> <strong>the</strong> State from fire and o<strong>the</strong>r destructive agents …commensurate with<br />
<strong>the</strong> value of <strong>the</strong> resources at risk, for <strong>the</strong> natural resources and watersheds on land that is<br />
owned privately, by <strong>the</strong> State, or by a municipality.<br />
The Commissioner has directed that...<strong>the</strong> Division of <strong>Forestry</strong> will provide for <strong>the</strong> protection<br />
of <strong>the</strong> natural surface resources, man-made improvements and human life from <strong>the</strong> threat<br />
of wildland fire for all lands under State and private ownership, with <strong>the</strong> exception of: (A.)<br />
Private land protected by <strong>the</strong> Federal government as enacted by law; (B.) Any land with<strong>in</strong> a<br />
borough or municipality whose organized fire department has accepted protection responsibility.<br />
Protection System<br />
The Alaska Division of <strong>Forestry</strong> is responsible for <strong>the</strong> protection of 151.7 million acres.<br />
The USDI, Bureau of Land Management through it’s Alaska <strong>Fire</strong> Service, protects 192 million<br />
acres and <strong>the</strong> USDA, Forest Service protects <strong>the</strong> 26 million acres of federal lands with<strong>in</strong> <strong>the</strong><br />
national forests.<br />
The Division employs 22 full-time employees and hires over 160 temporary or seasonal<br />
firefighters. Dur<strong>in</strong>g <strong>the</strong> peak fire season period, <strong>the</strong> Division staffs 37 eng<strong>in</strong>e companies and<br />
operates or contracts for 2 airtankers, 2 air attacks, 4 fixed w<strong>in</strong>g aircraft, and 7 helicopters.<br />
In an effort to improve efficiency and effectiveness, <strong>the</strong> Division of <strong>Forestry</strong> entered <strong>in</strong>to a<br />
cooperative agreement with <strong>the</strong> USDI, Bureau of Land Management to divide <strong>the</strong> State <strong>in</strong>to two<br />
direct protection areas. The Bureau provides wildland fire protection to all of <strong>the</strong> federal, state,<br />
and private lands <strong>in</strong> <strong>the</strong> north part of <strong>the</strong> State and <strong>the</strong> Division provides protection <strong>in</strong> <strong>the</strong> south.<br />
The Forest Service cont<strong>in</strong>ues to protect <strong>the</strong>ir own land.<br />
20
State statutes provide that cities and boroughs may provide structural fire protection with<strong>in</strong><br />
<strong>the</strong>ir jurisdiction or with<strong>in</strong> specifically formed service areas. Even though <strong>the</strong> Division’s area of<br />
responsibility overlaps with local jurisdictional areas, <strong>the</strong> protection services provided by both<br />
governmental entities do not normally conflict with each o<strong>the</strong>r except when a wildland fire (<strong>the</strong><br />
State’s responsibility) threatens a structure (<strong>the</strong> local jurisdiction’s responsibility).<br />
To enhance <strong>the</strong> wildland fire protection with<strong>in</strong> <strong>the</strong> Division’s direct protection area, <strong>the</strong>y<br />
have entered <strong>in</strong>to cooperative fire protection agreements with 56 city and borough fire agencies.<br />
The ma<strong>in</strong> purpose of <strong>the</strong>se agreements is to provide assistance to <strong>the</strong> Division when a fire<br />
occurs <strong>in</strong> <strong>the</strong> area or to provide protection dur<strong>in</strong>g <strong>the</strong> “non-fire season” periods when <strong>the</strong> Division<br />
does not staff it’s fire equipment. There are 288 organized fire departments <strong>in</strong> <strong>the</strong> State.<br />
<strong>Fire</strong> Activity<br />
Alaska averages just over 300 wildland fires and burns just under 227,000 acres a year.<br />
The annual acreage burned varies significantly from 16,585 acres <strong>in</strong> 1995 to over a million<br />
acres <strong>in</strong> 1997. Debris burn<strong>in</strong>g is <strong>the</strong> s<strong>in</strong>gle most frequent cause at 33 percent, with miscellaneous<br />
as <strong>the</strong> second highest causal rate at 24 percent. An average of 91 percent of fires were<br />
conta<strong>in</strong>ed at under 10 acres with an average fire size of 0.51 acres. The average size of fires<br />
over 10 acres was 7,058 acres. Alaska is unique <strong>in</strong> it’s size <strong>in</strong> that it constitutes over 25 percent<br />
of <strong>the</strong> total acres <strong>in</strong> all of <strong>the</strong> 17 <strong>West</strong>ern States.<br />
Dur<strong>in</strong>g <strong>Fire</strong> Season 2002, Alaska had 399 fires that burned 802,515 acres, well above <strong>the</strong><br />
10-year average for both numbers and acres.<br />
21
Arizona <strong>Fire</strong> Management Division - The Arizona <strong>Fire</strong> Management<br />
Division is a division of <strong>the</strong> Arizona State Land Department.<br />
Responsibility<br />
The State of Arizona has declared ...The State Forester shall have <strong>the</strong> authority to prevent<br />
and suppress any wildfires on State and private lands located outside <strong>in</strong>corporated municipalities<br />
and, if subject to cooperative agreements, on o<strong>the</strong>r lands located <strong>in</strong> this State or <strong>in</strong> o<strong>the</strong>r<br />
States, Mexico and Canada (Arizona revised Statute 37-623). The Division has <strong>the</strong> responsibility<br />
to protect 22,447,000 acres of <strong>the</strong> State.<br />
Protection System<br />
The Arizona <strong>Fire</strong> Management Division ma<strong>in</strong>ta<strong>in</strong>s Cooperative Intergovernmental Agreements<br />
or Jo<strong>in</strong>t Powers Agreements with various local, state and federal agencies for <strong>the</strong> response<br />
of over 1,000 eng<strong>in</strong>e companies to suppress fires under <strong>the</strong> State’s jurisdiction. There are<br />
approximately 250 organized fire departments <strong>in</strong> <strong>the</strong> State.<br />
<strong>Fire</strong> Activity<br />
Arizona averages just over 450 wildland fires and burns about 14,000 acres a year. The ten<br />
year statistics show that <strong>the</strong> number of fires have decl<strong>in</strong>ed over <strong>the</strong> last ten years. In 1995, <strong>the</strong>y<br />
had 796 fires, whereas <strong>in</strong> 1998, <strong>the</strong>y had about a 50 percent reduction to 396 fires. The annual<br />
acreage burned varies from 3,057 acres <strong>in</strong> 1997 to 630,075 acres <strong>in</strong> 1995. Miscellaneous is <strong>the</strong><br />
s<strong>in</strong>gle most frequent cause at 51 percent of fires, with lightn<strong>in</strong>g as <strong>the</strong> second highest causal rate<br />
at 16 percent. An average of 83 percent of fires were conta<strong>in</strong>ed at under 10 acres with an average<br />
size of 1.1 acres. The average size of fires over 10 acres was just under 439 acres.<br />
In <strong>Fire</strong> Season 2002, Arizona had 530 fires that burned 46,645 acres, well above <strong>the</strong> 5-year<br />
average. Lightn<strong>in</strong>g fires were about average and “miscellaneous” cont<strong>in</strong>ued to be <strong>the</strong> lead<strong>in</strong>g<br />
fire cause. The Rodeo-Chediski <strong>Fire</strong> (468,638 acres) which started on <strong>the</strong> BIA’s Fort Apache<br />
Agency, was <strong>the</strong> largest fire <strong>in</strong> Arizona’s recorded history.<br />
22
California Department of <strong>Forestry</strong> and <strong>Fire</strong> Protection - The<br />
California Department of <strong>Forestry</strong> and <strong>Fire</strong> Protection is part of <strong>the</strong> State’s Resources<br />
Agency.<br />
Responsibility<br />
The California Department of <strong>Forestry</strong> and <strong>Fire</strong> Protection (CDF) is required to protect<br />
State and privately owned watershed lands as designated by <strong>the</strong> State’s Board of <strong>Forestry</strong>. The<br />
law def<strong>in</strong>es watershed lands as...lands covered wholly or <strong>in</strong> part by forests or by trees produc<strong>in</strong>g<br />
or capable of produc<strong>in</strong>g forest products. Lands covered wholly or <strong>in</strong> part by timber, brush,<br />
undergrowth, or grass, whe<strong>the</strong>r of commercial value or not, which protect <strong>the</strong> soil from excessive<br />
erosion, retard runoff of water or accelerate water percolation... Lands <strong>in</strong> areas which are<br />
pr<strong>in</strong>cipally used or useful for range or forage purposes, which are contiguous to <strong>the</strong> lands<br />
described (above) (PRC 4126). The follow<strong>in</strong>g lands are excluded from State protection...Lands<br />
owned or controlled by <strong>the</strong> federal government or any agency of <strong>the</strong> federal government. Lands<br />
with<strong>in</strong> <strong>the</strong> exterior boundaries of any city...(PRC 4127). Roughly one-third of <strong>the</strong> State is<br />
classed as “state responsibility area,” or about 31.3 million acres.<br />
The Department directly protects about 27.7 million acres. Some of this acreage <strong>in</strong>cludes<br />
land managed by <strong>the</strong> USDA Forest Service, and <strong>the</strong> USDI Bureau of Land Management. The<br />
“state responsibility area” that is not protected by CDF is ei<strong>the</strong>r protected by various federal<br />
agencies or several local fire agencies know as “contract counties.”<br />
The Department has <strong>the</strong> authority via cooperative agreements, to provide full-service fire<br />
protection to cities, counties, and fire districts. Such contracts add an additional 11 million acres<br />
to CDF’s direct protection responsibilities.<br />
Protection System<br />
The Department fields a force of close to 17,000 firefighters (3,800 full-time fire professionals,<br />
foresters, and adm<strong>in</strong>istrative personnel; 1,400 seasonal firefighters; 5,500 local agency<br />
volunteers under CDF control; 2,600 State Volunteers <strong>in</strong> Prevention; and over 3,800 <strong>in</strong>mate and<br />
ward firefighters). This force of firefighters operate 1,025 eng<strong>in</strong>e companies (336 funded by <strong>the</strong><br />
23
State, and 689 locally funded and controlled by CDF), 21 airtankers, 10 helicopters, 13 air<br />
attack aircraft, 58 <strong>in</strong>itial attack bulldozer companies, and 195 Type 1 fire crews.<br />
<strong>Fire</strong> Activity<br />
California averages just about 6,000 wildland fires and burns about 128,000 acres a year.<br />
The five year statistics show that <strong>the</strong> number of fires <strong>in</strong> California are fairly consistent from<br />
year-to-year.. The annual acreage burned varies from 57,788 acres <strong>in</strong> 1997 to 277,750 acres <strong>in</strong><br />
1999. Equipment use is <strong>the</strong> s<strong>in</strong>gle most frequent cause at 37 percent, with miscellaneous as <strong>the</strong><br />
second highest causal rate at 33 percent. An average of 95 percent of fires are conta<strong>in</strong>ed at<br />
under 10 acres with an average size of 0.47 acres. The average size of fires over 10 acres was<br />
1,250 acres. The California Department of <strong>Forestry</strong> and <strong>Fire</strong> Protection responds to over<br />
290,000 calls for help each year with <strong>the</strong> vast majority of <strong>the</strong>se calls (51 percent) be<strong>in</strong>g for<br />
medical assistance.<br />
In <strong>Fire</strong> Season 2002, California had 5,759 wildfires that burned 112,810 acres, slightly<br />
below <strong>the</strong> 5-year average. That total <strong>in</strong>cluded five Class G fires, which averaged about 16,000<br />
acres.<br />
The worst fires <strong>in</strong> California <strong>in</strong> 2002 were <strong>the</strong> McNally <strong>Fire</strong> (150,696 acres) on <strong>the</strong> Sequoia<br />
National Forest and <strong>the</strong> P<strong>in</strong>es <strong>Fire</strong> (61,690 acres) <strong>in</strong> <strong>the</strong> CDF’s San Diego Unit.<br />
24
Colorado State Forest Service - The Colorado State Forest Service is<br />
a State agency with<strong>in</strong> <strong>the</strong> Colorado State University System<br />
Responsibility<br />
State of Colorado statutes declare ...It is State policy of this State to prevent and control<br />
forest fires on or threaten<strong>in</strong>g <strong>the</strong> forest land of <strong>the</strong> State (public or private) <strong>in</strong> order to preserve<br />
forest and o<strong>the</strong>r natural resources....and prevent loss of life and damage to property from<br />
wildfires and o<strong>the</strong>r conflagrations (23-30-301). The actual fire suppression action is provided<br />
by over 400 fire protection districts, rural fire departments, and sheriff departments.<br />
The responsibility for <strong>the</strong> suppression of wildland fires is assigned to <strong>the</strong> Sheriff of each<br />
Colorado County. The Sheriff ... <strong>in</strong> case of any forest or prairie fire, is to assume charge <strong>the</strong>reof<br />
or to assist o<strong>the</strong>r governmental authorities <strong>in</strong> such emergencies for controll<strong>in</strong>g or ext<strong>in</strong>guish<strong>in</strong>g<br />
such fires...The State forester may assume <strong>the</strong> duty with concurrence of <strong>the</strong> Sheriff (30-10-513).<br />
Protection System<br />
The Colorado State Forest Service protects cooperatively with <strong>the</strong> County Sheriffs approximately<br />
41 million acres of <strong>the</strong> State. Initial calls go directly to <strong>the</strong> Sheriff’s Office or an<br />
<strong>in</strong>teragency dispatch center. The Colorado State Forest Service may respond with a l<strong>in</strong>e officer<br />
and may assume control upon mutual agreement of <strong>the</strong> County Sheriff and <strong>the</strong> State Forester.<br />
The Colorado State Forest Service provides 140 federal excess property eng<strong>in</strong>es to local<br />
fire departments and county sheriffs for use <strong>in</strong> fight<strong>in</strong>g wildland fires. In addition, 16 stateowned<br />
eng<strong>in</strong>es are available and over 1720 fire department eng<strong>in</strong>es are listed on resource<br />
forms. The state ma<strong>in</strong>ta<strong>in</strong>s cooperative agreements with various federal wildland fire agencies,<br />
county sheriff departments, and fire departments. The State also ma<strong>in</strong>ta<strong>in</strong>s a seasonal contract<br />
for s<strong>in</strong>gle eng<strong>in</strong>e airtanker(s) that can be used by local firefighters.<br />
<strong>Fire</strong> Activity<br />
Colorado averages just over 2,300 wildland fires that burn just under 82,000 acres a year<br />
on State and private land. The five-year statistics show that <strong>the</strong> number of fires <strong>in</strong> Colorado has<br />
25
<strong>in</strong>creased s<strong>in</strong>ce 1999. The annual acreage burned varies significantly from 10,282 acres <strong>in</strong> 1998<br />
to over 244,000 <strong>in</strong> 2002. The s<strong>in</strong>gle most frequent cause of fires reported falls with<strong>in</strong> <strong>the</strong><br />
miscellaneous category at 52 percent, with debris burn<strong>in</strong>g as <strong>the</strong> second highest causal rate at 17<br />
percent. Conta<strong>in</strong>ment is reached on average at fewer than 10 acres on 93 percent of <strong>the</strong> fires,<br />
with 0.61 acres be<strong>in</strong>g <strong>the</strong> average size of fires <strong>in</strong> this category. <strong>Fire</strong>s that grow beyond 10 acres<br />
reach an average size of 627 acres.<br />
In <strong>Fire</strong> Season 2002, Colorado had 3,409 wildfires that burned a total of 244,252 acres,<br />
well above <strong>the</strong> 5-year average. The two largest fires burned a total of over 207,000 acres. There<br />
were significantly more lightn<strong>in</strong>g fires than normal.<br />
The Hayman <strong>Fire</strong> (137,760 acres) which started on <strong>the</strong> Pike National Forest <strong>in</strong> June 2002<br />
is <strong>the</strong> largest fire <strong>in</strong> Colorado’s recorded history.<br />
26
Hawaii Division of <strong>Forestry</strong> and Wildlife - The Hawaii Division of<br />
<strong>Forestry</strong> and Wildlife is one of n<strong>in</strong>e divisions with<strong>in</strong> <strong>the</strong> Department of Land and<br />
Natural Resources.<br />
Responsibility<br />
The Hawaii Division of <strong>Forestry</strong> and Wildlife is responsible to...provide direct fire protection<br />
to forest reserves, natural area reserves, public hunt<strong>in</strong>g areas, wildlife and plant sanctuaries<br />
and o<strong>the</strong>r lands under <strong>the</strong> jurisdiction of <strong>the</strong> Division of <strong>Forestry</strong> and Wildlife. This encompasses<br />
approximately 850,000 acres. The Division has a secondary protection responsibility on<br />
3.3 million acres of o<strong>the</strong>r state-owned lands.<br />
Protection System<br />
Cooperative agreements are ma<strong>in</strong>ta<strong>in</strong>ed with four local government fire agencies, one on<br />
each of <strong>the</strong> islands (Kauai, Oahu, Maui, and Hawaii). These resources are <strong>the</strong> first responders<br />
and are relied upon for direct fire suppression activities. Cooperative agreements also exist<br />
between <strong>the</strong> U.S. Army Support Command Hawaii, <strong>the</strong> National Park Service, <strong>the</strong> Pacific<br />
Missile Range Facility at Bark<strong>in</strong>g Sands, Kauai and <strong>the</strong> Nature Conservancy of Hawaii.<br />
<strong>Fire</strong> Activity<br />
Hawaii averages just over 150 wildland fires and burns about 12,000 acres a year. The ten<br />
year statistics show that <strong>the</strong> number of fires <strong>in</strong> Hawaii is “level,” although <strong>the</strong> numbers vary<br />
considerably. They had only 67 fires <strong>in</strong> 1997, but over 230 <strong>in</strong> 1995. The annual acreage burned<br />
varies significantly from only 377 acres <strong>in</strong> 1997 to over 37,000 <strong>in</strong> 1998. Miscellaneous is <strong>the</strong><br />
s<strong>in</strong>gle most frequent cause at 48 percent with arson as <strong>the</strong> second highest causal rate at 16<br />
percent. An average of 80 percent of fires were conta<strong>in</strong>ed at under 10 acres with an average size<br />
of 1.2 acres. The average size of fires over 10 acres was 694 acres.<br />
This past year, Hawaii had 188 fires that burned 2,377 acres. This is well below <strong>the</strong> average<br />
acres burned.<br />
27
28<br />
Idaho Department of Lands, Bureau of <strong>Fire</strong><br />
Management - The IDL Bureau of <strong>Fire</strong> Management is<br />
part of <strong>the</strong> Department of Lands.<br />
Responsibility<br />
The Department of Lands is required to protect State and private forests. The Idaho<br />
<strong>Forestry</strong> Act States; “Any forest or range fire burn<strong>in</strong>g out of control...is hereby declared a<br />
public nuisance, by reason of its menace to life and/or property. ...The director of <strong>the</strong> Department<br />
of Lands or any fire warden may summarily abate <strong>the</strong> nuisance thus constituted by<br />
controll<strong>in</strong>g or ext<strong>in</strong>guish<strong>in</strong>g such fire...” (38-107). The Act also states ...every owner of forest<br />
land will: (a) provide <strong>the</strong>ir own forest fire protection, or (b) jo<strong>in</strong> an association of forest<br />
landowners to provide forest fire protection, or fail<strong>in</strong>g ei<strong>the</strong>r of <strong>the</strong> first two options; (c) <strong>the</strong><br />
director of <strong>the</strong> Department of Lands will provide <strong>the</strong> protection (38-111).<br />
Protection System<br />
The Department is divided <strong>in</strong>to eleven districts and operates 57 eng<strong>in</strong>e companies to<br />
protect just over 6 million acres. Staff<strong>in</strong>g is provided with full-time and seasonal employees.<br />
There are 170 local government fire departments <strong>in</strong> Idaho.<br />
<strong>Fire</strong> Activity<br />
Idaho averages about 500 wildland fires and burns about 62,000 acres a year. The ten<br />
year statistics show that <strong>the</strong> number of fires <strong>in</strong> Idaho is <strong>in</strong>creas<strong>in</strong>g. However, 2000 was an<br />
exceptional year when <strong>the</strong> number of lightn<strong>in</strong>g fires were up about 60% and debris burn<strong>in</strong>g<br />
fires were nearly double <strong>the</strong> average. The annual acreage burned varies significantly from 533<br />
acres <strong>in</strong> 1995 to over 142,000 <strong>in</strong> 2000. Lightn<strong>in</strong>g is <strong>the</strong> s<strong>in</strong>gle most frequent cause at 49<br />
percent with debris burn<strong>in</strong>g as <strong>the</strong> second highest causal rate at 15 percent. An average of 95<br />
percent of fires were conta<strong>in</strong>ed at under 10 acres, with an average size of 0.549 acres. The<br />
average size of fires over 10 acres was 2,445 acres.<br />
<strong>Fire</strong> Season 2002 was below average for Idaho, with 386 wildfires burn<strong>in</strong>g only 7,972<br />
acres, well below <strong>the</strong> 5-year average.
Kansas Forest Service - The Kansas Forest Service is a state agency<br />
with<strong>in</strong> <strong>the</strong> Kansas State University.<br />
Responsibility<br />
The Kansas Forest Service is responsible for ...provid<strong>in</strong>g assistance for <strong>the</strong> prevention and<br />
suppression of forest, brush or grassland fires <strong>in</strong> non-federal areas of <strong>the</strong> State except on lands<br />
with<strong>in</strong> <strong>the</strong> exterior boundaries of <strong>in</strong>corporated cities (KSA 76-425A through 76-425F, as<br />
amended). This area is approximately 46.4 million acres.<br />
Protection System<br />
All of <strong>the</strong> fire protection on <strong>the</strong>se lands is provided by various rural fire departments and<br />
districts. There are 673 fire departments or districts <strong>in</strong> <strong>the</strong> State. The Kansas Forest Service<br />
ma<strong>in</strong>ta<strong>in</strong>s cooperative agreements with 506 of <strong>the</strong>m, provid<strong>in</strong>g equipment, tra<strong>in</strong><strong>in</strong>g and assistance<br />
with fund<strong>in</strong>g, prevention and plann<strong>in</strong>g.<br />
<strong>Fire</strong> Activity<br />
Kansas averages just over 4,700 wildland fires and burns just under 56,000 acres a year.<br />
The five year statistics show that <strong>the</strong> number of fires <strong>in</strong> Kansas are on a slight rise. The annual<br />
acreage burned varied from 31,676 acres <strong>in</strong> 1998 to over 93,000 acres <strong>in</strong> 2002. Debris burn<strong>in</strong>g<br />
is <strong>the</strong> s<strong>in</strong>gle most frequent cause at 36 percent. An average of 75 percent of <strong>the</strong> fires were<br />
conta<strong>in</strong>ed at under 10 acres with an average size of 1.48 acres. The average size of fires over 10<br />
acres was 759 acres.<br />
<strong>Fire</strong> Season 2002 was about <strong>the</strong> same as 2000 <strong>in</strong> Kansas, but not nearly as bad as 1996,<br />
when more than 430,000 acres burned. The State had 50 large fires (>300 acres) <strong>in</strong> 2002. Ten<br />
fires burned over 1,000 acres each. The largest, burn<strong>in</strong>g 12,000 acres <strong>in</strong> Greenwood County <strong>in</strong><br />
April, was <strong>the</strong> result of improper disposal of hot ashes.<br />
29
Montana DNRC <strong>Fire</strong> and Aviation Program - The Montana<br />
DNRC <strong>Fire</strong> and Aviation Program is with<strong>in</strong> <strong>the</strong> Montana Department<br />
of Natural Resources and Conservation, <strong>Forestry</strong> Division.<br />
Responsibility<br />
The State of Montana has declared ...That <strong>the</strong> Department shall protect <strong>the</strong> natural resources<br />
of <strong>the</strong> State from fire and that <strong>the</strong> Department is responsible for fire protection on all<br />
forest lands with<strong>in</strong> this State that are officially classified by <strong>the</strong> Department as forest lands...<br />
(MCA 76-13-101 and 103). The Department has declared 5.1 million acres of State and private<br />
lands as forested and under <strong>the</strong>ir jurisdiction. This <strong>in</strong>cludes privately owned forested lands<br />
with<strong>in</strong> <strong>the</strong> boundaries of an <strong>in</strong>corporated city. Priority is given to <strong>the</strong> protection of forested lands<br />
owned by <strong>the</strong> State. The State has given <strong>the</strong> Department a secondary protection for 45.3 million<br />
acres of State and privately owned non-forested lands <strong>in</strong> <strong>the</strong> State. These lands are predom<strong>in</strong>ately<br />
found <strong>in</strong> eastern Montana.<br />
Protection System<br />
The Montana DNRC <strong>Fire</strong> and Aviation Program staffs 65 eng<strong>in</strong>e (and water tender) companies<br />
and five helicopters to protect <strong>the</strong> 5.1 million acres. Montana DNRC also loans over 350<br />
eng<strong>in</strong>es to local fire agencies, primarily <strong>in</strong> <strong>the</strong> eastern part of <strong>the</strong> State. DNRC is also given <strong>the</strong><br />
responsibility to coord<strong>in</strong>ate all mutual aid responses of fire department resources that cross<br />
county l<strong>in</strong>es.<br />
<strong>Fire</strong> Activity<br />
Montana averages just over 450 wildland fires and burns just under 72,000 acres a year.<br />
The five year statistics show that <strong>the</strong> number of fires <strong>in</strong> Montana are about level. The annual<br />
acreage burned varied from 3,430 acres <strong>in</strong> 1997 to over 168,744 acres <strong>in</strong> 2000. Lightn<strong>in</strong>g is <strong>the</strong><br />
s<strong>in</strong>gle most frequent cause of fires at 48 percent with debris burn<strong>in</strong>g as <strong>the</strong> second highest causal<br />
rate at 14 percent.<br />
For <strong>Fire</strong> Season 2002, Montana had 471 fires that burned 28,811 acres. While <strong>the</strong> number<br />
of fires is even with <strong>the</strong> 5-year average, <strong>the</strong> acres burned are less than half.<br />
30
Nebraska Forest Service - The Nebraska Forest Service is part of<br />
<strong>the</strong> University of Nebraska system.<br />
Responsibility<br />
The State of Nebraska has given <strong>the</strong> State Forester powers to “develop and implement<br />
plans for <strong>the</strong> prevention and suppression of forest, brush, and grassland fires on both public<br />
and private lands.” This means <strong>the</strong> Nebraska Forest Service has a secondary protection responsibility<br />
for 49,083,520 acres—<strong>the</strong> entire State.<br />
Protection System<br />
Local government provides <strong>the</strong> protection for <strong>the</strong> State. The Nebraska Forest Service<br />
coord<strong>in</strong>ates tra<strong>in</strong><strong>in</strong>g and grant distribution. There are 476 rural fire districts <strong>in</strong> Nebraska.<br />
<strong>Fire</strong> Activity<br />
Nebraska averages just over 1,300 wildland fires and burns just over 110,000 acres a year.<br />
The five year statistics show that <strong>the</strong> number of fires <strong>in</strong> Nebraska are on a slight <strong>in</strong>crease. The<br />
annual acreage burned varied from 17,230 acres <strong>in</strong> 2001 to over 252,000 acres <strong>in</strong> 2000. Debris<br />
burn<strong>in</strong>g is <strong>the</strong> second most frequent cause at 26 percent with miscellaneous as <strong>the</strong> highest<br />
causal rate at 30 percent. An average of 77 percent of fires were conta<strong>in</strong>ed at under 10 acres<br />
with an average size of 1.34 acres. The average size of fires over 10 acres was 694 acres.<br />
In <strong>Fire</strong> Season 2002, Nebraska had 1,835 fires that burned 90,562 acres. This is a high<br />
level of occurrence, but <strong>the</strong> acreage burned was below average despite five Class G fires.<br />
31
Nevada Division of <strong>Forestry</strong> - The Nevada Division of <strong>Forestry</strong><br />
is a division of <strong>the</strong> Nevada Department of Conservation and Natural<br />
Resources.<br />
Responsibility<br />
Nevada statute mandates <strong>the</strong> State Forester <strong>Fire</strong>warden to ...adm<strong>in</strong>ister all fire control laws<br />
and all forestry laws <strong>in</strong> Nevada outside of township boundaries. In addition to provid<strong>in</strong>g fire<br />
protection to State and privately owned lands, “<strong>the</strong> State Forester <strong>Fire</strong>warden is also mandated<br />
to “assist and encourage county or local fire protection districts to create legally constituted<br />
fire protection districts where <strong>the</strong>y are needed and offer guidance and advice <strong>in</strong> <strong>the</strong>ir operation.<br />
A change <strong>in</strong> <strong>the</strong> boundaries of a fire protection district, <strong>in</strong>clud<strong>in</strong>g withdrawals of any portion,<br />
may be denied by <strong>the</strong> State Forester <strong>Fire</strong>warden if he determ<strong>in</strong>es such change will impair or<br />
affect it’s organization, or affect, impair, or discharge any contract, obligation, lien, or charge<br />
on which it might be liable or chargeable had such change of boundaries not been made.”<br />
S<strong>in</strong>ce <strong>the</strong> Division derives some of it’s fund<strong>in</strong>g from property taxes, <strong>the</strong> level of protection it is<br />
obligated to provide is <strong>the</strong> same as that of a municipal fire department. The Division has direct<br />
protection responsibility for 9,501,784 acres of <strong>the</strong> State, and coord<strong>in</strong>ation responsibilities for<br />
an additional 17,433,631 acres. The Division responds to over 3,000 calls for help each year,<br />
with over half of <strong>the</strong>m be<strong>in</strong>g medical aids or assistance to o<strong>the</strong>r agencies.<br />
Protection System<br />
The Nevada Division of <strong>Forestry</strong> employees approximately 230 full-time personnel <strong>in</strong>clud<strong>in</strong>g<br />
123 personnel with<strong>in</strong> <strong>the</strong> fire program and an additional 40 seasonal employees. There are<br />
approximately 600 volunteer fire department members for which <strong>the</strong> Division pays <strong>in</strong>dustrial<br />
<strong>in</strong>surance coverage. The Division also cooperates closely with <strong>the</strong> 1,511 volunteer/career and<br />
volunteer fire departments throughout <strong>the</strong> State. The Division has a close work<strong>in</strong>g arrangement<br />
with <strong>the</strong> Department of Corrections to operate 77 twelve-person conservations crews plus one<br />
conservation crew specifically assigned to helitack. The Division ma<strong>in</strong>ta<strong>in</strong>s an <strong>in</strong>sured fleet of<br />
nearly 600 vehicles. This fleet <strong>in</strong>cludes 185 eng<strong>in</strong>es, 39 water tenders and five bulldozers. The<br />
Division operates two helicopters, as well as one fixed w<strong>in</strong>g aircraft.<br />
32
<strong>Fire</strong> Activity<br />
Nevada averages just under 230 wildland fires and burns over 23,000 acres a year. The five<br />
year statistics show that <strong>the</strong> number of fires <strong>in</strong> Nevada are fairly constant. The annual acreage<br />
burned varied from 418 acres <strong>in</strong> 1997 to over 87,000 acres <strong>in</strong> 2000. Debris burn<strong>in</strong>g is <strong>the</strong> most<br />
frequent cause at 30 percent, with miscellaneous second at 29 percent. An average of 90 percent<br />
of <strong>the</strong> fires were conta<strong>in</strong>ed at under 10 acres with an average size of 1.0 acres. The average size<br />
of fires over 10 acres was 1,580 acres.<br />
For <strong>Fire</strong> Season 2002, Nevada had 269 fires that burned only 2,833 acres, well below <strong>the</strong>ir<br />
5-year average.<br />
33
New Mexico State <strong>Forestry</strong> Division - The New Mexico<br />
State <strong>Forestry</strong> Division is a division of <strong>the</strong> New Mexico Department of<br />
Energy, M<strong>in</strong>erals and Natural Resources.<br />
Responsibility<br />
The State of New Mexico has declared ...The State shall have <strong>the</strong> responsibility for prevention<br />
and suppression of forest fires on all non-federal, non-municipal lands <strong>in</strong> <strong>the</strong> State (68-2-<br />
8). The Division has <strong>the</strong> responsibility to protect 42.5 million acres of <strong>the</strong> State.<br />
Protection System<br />
The Division ma<strong>in</strong>ta<strong>in</strong>s Cooperative Intergovernmental Agreements or Jo<strong>in</strong>t Powers<br />
Agreements with 230 county fire departments and 60 municipal fire departments and reimburses<br />
<strong>the</strong>m for wildland fire suppression services. There are approximately 359 organized fire<br />
departments <strong>in</strong> <strong>the</strong> State. The Division ma<strong>in</strong>ta<strong>in</strong>s numerous Jo<strong>in</strong>t Powers Agreements with<br />
various state and federal agencies<br />
<strong>Fire</strong> Activity<br />
New Mexico averages about 800 wildland fires and burns just over 160,000 acres a year.<br />
The five year statistics show that <strong>the</strong> number of fires <strong>in</strong> New Mexico is highly variable. The<br />
annual acreage burned varied from 39,849 acres <strong>in</strong> 2001 to over 376,000 acres <strong>in</strong> 2000. Lightn<strong>in</strong>g<br />
is <strong>the</strong> s<strong>in</strong>gle most frequent cause at 36 percent and miscellaneous is <strong>the</strong> second highest<br />
causal rate at 30 percent. An average of 69 percent of <strong>the</strong> fires were conta<strong>in</strong>ed at under 10 acres<br />
with <strong>the</strong> average size of 1.5 acres. The average size of fires over 10 acres was 146 acres.<br />
New Mexico had 794 fires that burned 226,492 acres <strong>in</strong> <strong>Fire</strong> Season 2002. This is about<br />
average for number of fires and about 40% more than <strong>the</strong> average acres. Six Class G fires<br />
burned 100,876 acres.<br />
34
North Dakota Forest Service - The North Dakota Forest Service is<br />
a division of North Dakota State University.<br />
Responsibility<br />
The State of North Dakota has declared ...The State Forester is specifically authorized to<br />
apply for, receive, and expend federal grants-<strong>in</strong>-aid and match<strong>in</strong>g funds for fire protection<br />
services, and generally aid rural fire departments and rural fire protection districts with all<br />
activities customary <strong>in</strong> <strong>the</strong> prevention and suppression of forest, brush, and grassland fires. The<br />
State Forester has <strong>the</strong> responsibility to coord<strong>in</strong>ate <strong>the</strong> wildland fire protection <strong>in</strong> North Dakota.<br />
Protection System<br />
There are 388 fire departments or fire districts <strong>in</strong> <strong>the</strong> State. They are responsible for <strong>the</strong><br />
suppression of all fires on State or privately owned lands. The North Dakota Forest Service<br />
ma<strong>in</strong>ta<strong>in</strong>s cooperative agreements with 384 fire departments and fire districts.<br />
<strong>Fire</strong> Activity<br />
North Dakota averages over 500 wildland fires and burns nearly 66,000 acres a year. The<br />
five year statistics show that <strong>the</strong> number of fires <strong>in</strong> North Dakota are on <strong>the</strong> rise. The annual<br />
acreage burned varied from nearly 167,000 acres <strong>in</strong> 2002 to a low of 6,504 acres <strong>in</strong> 2001.<br />
Miscellaneous is <strong>the</strong> second most frequent cause at 21 percent with debris burn<strong>in</strong>g as <strong>the</strong> highest<br />
causal rate at 40 percent. An average of 83 percent of <strong>the</strong> fires were conta<strong>in</strong>ed at less than 10<br />
acres with an average fire size of 1.59 acres. The average size of fires over 10 acres was 398<br />
acres.<br />
For <strong>Fire</strong> Season 2002, North Dakota had 325 fires that burned 29,565 acres. This is below<br />
<strong>the</strong> 5-year average, and less than one-half <strong>the</strong> acreage burned <strong>in</strong> 1999.<br />
35
Oregon Department of <strong>Forestry</strong> - The Oregon Department of <strong>Forestry</strong><br />
works under <strong>the</strong> direction of <strong>the</strong> State Board of <strong>Forestry</strong> whose members are<br />
appo<strong>in</strong>ted by <strong>the</strong> Governor and confirmed by <strong>the</strong> Senate. The State Forester <strong>in</strong><br />
turn is appo<strong>in</strong>ted by a seven person Board.<br />
Responsibility<br />
The State of Oregon has declared that it is <strong>the</strong> responsibility of <strong>the</strong> <strong>in</strong>dividual forest landowners<br />
to protect <strong>the</strong>ir land from wildland fires. The landowner has three alternative ways of provid<strong>in</strong>g this<br />
protection: (1) <strong>the</strong>y can provide for <strong>the</strong> direct protection <strong>the</strong>mselves; (2) <strong>the</strong>y can jo<strong>in</strong> a nonprofit<br />
association that will provide for <strong>the</strong> protection; or (3) <strong>the</strong>y can allow <strong>the</strong> State to provide <strong>the</strong><br />
protection. In all cases, <strong>the</strong> Board of <strong>Forestry</strong> must approve of <strong>the</strong> method of protection.<br />
There are about 13.6 million acres of private and state-owned forested lands <strong>in</strong> <strong>the</strong> State. No<br />
landowner has elected to protect <strong>the</strong>ir own lands, but many have jo<strong>in</strong>ed one of <strong>the</strong> three protection<br />
associations. These associations protect about 2.3 million acres of <strong>the</strong> 13.6 million acres of private<br />
forest and State lands. Each landowner is assessed a fee to provide protection.<br />
Protection System<br />
The Department of <strong>Forestry</strong> and <strong>the</strong> three associations employ 162 permanent and 500 seasonal<br />
personnel to provide fire protection. They operate 228 eng<strong>in</strong>es, 14 <strong>in</strong>itial attack bulldozer units, 19<br />
ten-person handcrews (<strong>in</strong>mates), 2 aircraft and contract for 2 s<strong>in</strong>gle eng<strong>in</strong>e airtankers.<br />
<strong>Fire</strong> Activity<br />
Oregon has averaged over <strong>the</strong> last five years about 1,079 fires that burn about 35,169 acres. The<br />
5-year statistics show that <strong>the</strong> number of fires is very slowly <strong>in</strong>creas<strong>in</strong>g, however, <strong>the</strong> number of<br />
human caused fires, on a per capita basis, is fall<strong>in</strong>g. The lead<strong>in</strong>g cause is light<strong>in</strong>g (29%), with debris<br />
burn<strong>in</strong>g second (21%).<br />
For <strong>Fire</strong> Season 2002, Oregon had 1,175 fires that burned 99,047 acres. The number of fires is<br />
slightly above average and <strong>the</strong> number of acres burned is significantly above average. There were<br />
fewer lightn<strong>in</strong>g fires and more debris burn<strong>in</strong>g fires <strong>in</strong> 2002. The Biscut <strong>Fire</strong> (499,570 acres) on <strong>the</strong><br />
Siskiyou National Forest burned nearly <strong>the</strong> entire Kamiopsis Wilderness and was one of <strong>the</strong> largest<br />
fires <strong>in</strong> recent Oregon history.<br />
36
South Dakota Wildland <strong>Fire</strong> Suppression Division - The South<br />
Dakota Wildland <strong>Fire</strong> Suppression Division is a division of <strong>the</strong> State’s Department<br />
of Agriculture.<br />
Responsibility<br />
“The State of South Dakota has declared under 41-20-1.1. Employment of state wildland<br />
fire coord<strong>in</strong>ator — Qualifications and general authority: The Department of Agriculture may<br />
employ a state wildland fire coord<strong>in</strong>ator who shall be qualified for and authorized to carry out<br />
all wildfire suppression activities.”<br />
The Division is directly responsible for <strong>the</strong> protection of 949,117 acres of State and<br />
privately owned forested lands and has secondary protection of over 47 million acres of nonforested<br />
lands.<br />
Protection System<br />
The South Dakota Wildland <strong>Fire</strong> Suppression Division employs 19 full-time employees<br />
and 18 seasonal firefighters who operate 18 state-owned eng<strong>in</strong>es and water tenders. The State<br />
ma<strong>in</strong>ta<strong>in</strong>s cooperative agreements with various local, State, and federal agencies to work<br />
cooperatively to suppress wildland fires regardless of land ownership. The Division has signed<br />
agreements with various rural fire departments cover<strong>in</strong>g <strong>the</strong> dispatch of 440 eng<strong>in</strong>e companies<br />
located primarily <strong>in</strong> <strong>the</strong> Black Hills area. There are 364 organized rural fire departments <strong>in</strong> <strong>the</strong><br />
State.<br />
<strong>Fire</strong> Activity<br />
South Dakota averages 674 wildland fires and burns just over 140,000 acres a year. The<br />
five-year statistics show that <strong>the</strong> number of fires <strong>in</strong> South Dakota is <strong>in</strong>creas<strong>in</strong>g. The majority of<br />
<strong>the</strong> fires reported occurred <strong>in</strong> <strong>the</strong> Black Hills area of western South Dakota. Lightn<strong>in</strong>g is <strong>the</strong><br />
s<strong>in</strong>gle most frequent cause of fires at 24 percent with debris burn<strong>in</strong>g as <strong>the</strong> second highest<br />
causal rate at 23 percent. An average of 67 percent of fires were conta<strong>in</strong>ed at less than 10 acres.<br />
In <strong>Fire</strong> Season 2002, South Dakota had 725 fires that burned 166,928 acres. They had 5<br />
Class G fires that burned more than 94,000 acres.<br />
37
Utah Division of <strong>Forestry</strong>, <strong>Fire</strong> and State Lands - The<br />
Utah Division of <strong>Forestry</strong>, <strong>Fire</strong> and State Lands is part of <strong>the</strong> Department<br />
of Natural Resources.<br />
Responsibility<br />
The Utah Division of <strong>Forestry</strong>, <strong>Fire</strong> and State Lands is responsible to determ<strong>in</strong>e and execute<br />
<strong>the</strong> best methods for protect<strong>in</strong>g private and public lands by prevent<strong>in</strong>g and suppress<strong>in</strong>g<br />
fires on non-federally owned forest, range, and watershed lands <strong>in</strong> un<strong>in</strong>corporated areas of <strong>the</strong><br />
state. There are approximately 15 million acres of private, State and o<strong>the</strong>r lands which fall <strong>in</strong><br />
<strong>the</strong> State’s area of responsibility.<br />
Protection System<br />
The Division employs district fire wardens who manage <strong>in</strong>itial attack throughout <strong>the</strong> State.<br />
Rural fire departments are used extensively <strong>in</strong> <strong>the</strong> <strong>in</strong>itial attack role, along with State and<br />
federal resources <strong>in</strong> closest forces system. The State, through a number of agencies, ma<strong>in</strong>ta<strong>in</strong>s<br />
suppression resources and management personnel to manage suppression operations that escape<br />
<strong>in</strong>itial attack. They utilize suppression tactics and strategies that match <strong>the</strong> suppression effort<br />
with <strong>the</strong> values at risk. Where and when possible, fire is allowed to play its natural role <strong>in</strong> <strong>the</strong><br />
environment commiserate with public and firefighter safety, property and resource values. Close<br />
cooperative relations exist with all counties, o<strong>the</strong>r State agencies and <strong>the</strong> federal fire agencies to<br />
provide suppression resources for use <strong>in</strong>side and outside <strong>the</strong> State.<br />
<strong>Fire</strong> Activity<br />
Utah averages over 700 wildland/urban <strong>in</strong>terface fires and burns approximately 68,000<br />
acres of private and State lands each year. Acres burned varies from a low of 12,000 to over<br />
178,000 <strong>in</strong> a s<strong>in</strong>gle season. On average, 50 percent of fires are human-caused. In <strong>the</strong> 2002 <strong>Fire</strong><br />
Season, Utah had 613 fires that burned about 68,524 acres of private and State lands. Statistically,<br />
Utah had an average season; however, due to several large fires <strong>in</strong> remote parts of <strong>the</strong><br />
State, 2002 was <strong>the</strong> most expensive fire season <strong>in</strong> history. Over $19 million was spent to<br />
suppress fire on private and State land.<br />
38
Wash<strong>in</strong>gton Department of Natural Resources, Resource<br />
Protection Division - The Wash<strong>in</strong>gton DNR Forest <strong>Fire</strong> Control Program<br />
is under <strong>the</strong> Commissioner of Public Lands, an elected official.<br />
Responsibility<br />
The Wash<strong>in</strong>gton DNR Forest <strong>Fire</strong> Control Program is responsible for <strong>the</strong> protection of all<br />
private and state forest lands. It also provides protection for lands that are adjacent to or <strong>in</strong>term<strong>in</strong>gled<br />
with forest lands <strong>in</strong> eastern Wash<strong>in</strong>gton. Responsibility is authorized under Wash<strong>in</strong>gton<br />
RCW 76.04. Under cooperative agreement <strong>the</strong> Department also protects 15,000 acres of USDI<br />
Fish and Wildlife Service lands, 7,000 acres of USDI Bureau of Land Management lands, and<br />
226,000 acres for <strong>the</strong> USDI Bureau of Indian Affairs. Total area protected is approximately 12.5<br />
million acres.<br />
Protection System<br />
The Department staffs 114 <strong>in</strong>itial attack eng<strong>in</strong>e companies, two 20-person crews, and 3<br />
helicopters. Of <strong>the</strong> 1,200 permanent personnel, 350 are firel<strong>in</strong>e rated. An additional 350 seasonal<br />
firefighters are hired yearly. In addition, <strong>the</strong> Department contracts for one airtanker to<br />
supplement it’s <strong>in</strong>itial attack suppression forces, and dur<strong>in</strong>g critical periods, <strong>the</strong>y can utilize up<br />
to 400 <strong>in</strong>mates from <strong>the</strong> State correctional system <strong>in</strong> handcrews. Mutual aid agreements are<br />
ma<strong>in</strong>ta<strong>in</strong>ed with over 350 local government fire departments to supplement <strong>in</strong>itial attack operations.<br />
There are 560 local government fire departments <strong>in</strong> Wash<strong>in</strong>gton.<br />
<strong>Fire</strong> Activity<br />
Wash<strong>in</strong>gton averages 850 wildland fires and burns an average of 13,000 acres a year. The<br />
five-year statistics show that <strong>the</strong> number of fires <strong>in</strong> Wash<strong>in</strong>gton are decl<strong>in</strong><strong>in</strong>g just slightly.<br />
Annual acreage burned varied from 4,650 acres <strong>in</strong> 1997 to 23,511 acres <strong>in</strong> 1998. Miscellaneous<br />
is <strong>the</strong> s<strong>in</strong>gle most frequent cause at 27 percent with debris burn<strong>in</strong>g as <strong>the</strong> second highest causal<br />
rate at 25 percent. An average of 95 percent of <strong>the</strong> fires were conta<strong>in</strong>ed at under 10 acres with<br />
an average fire size of 0.62 acres. The average size of fires over 10 acres was 584 acres.<br />
In <strong>Fire</strong> Season 2002, Wash<strong>in</strong>gton had 889 fires that burned 10,063 acres; above average for<br />
number of fires, but below for numbers of acres.<br />
39
Wyom<strong>in</strong>g State <strong>Forestry</strong> Division - The Wyom<strong>in</strong>g State <strong>Forestry</strong><br />
Division is a division under <strong>the</strong> Director of <strong>the</strong> Office of State Lands<br />
and Investments.<br />
Responsibility<br />
The State of Wyom<strong>in</strong>g has declared ...The State Forester shall take such action as may be<br />
deemed necessary by <strong>the</strong> State Board of Land Commissioners, to protect forest, range, and o<strong>the</strong>r<br />
rural resources from fire. This responsibility shall <strong>in</strong> no way dim<strong>in</strong>ish <strong>the</strong> responsibility or authority<br />
of local fire protection districts (State statute 36-2-108(b)(i). The Division has <strong>the</strong> responsibility to<br />
protect 3.6 million acres of State owned lands. Most of <strong>the</strong> State lands are scattered (checkerboard)<br />
throughout <strong>the</strong> State. The Division also has <strong>the</strong> coord<strong>in</strong>at<strong>in</strong>g responsibility on an additional 27.1<br />
million acres of privately owned rural lands.<br />
Protection System<br />
The Division ma<strong>in</strong>ta<strong>in</strong>s <strong>the</strong> Wyom<strong>in</strong>g Interagency Cooperative <strong>Fire</strong> Protection Agreement with<br />
all 23 counties <strong>in</strong> <strong>the</strong> State and <strong>the</strong> various federal land management agencies, for <strong>the</strong> response of<br />
over 4,000 volunteer firefighters and over 1,000 eng<strong>in</strong>e companies to suppress fires under <strong>the</strong> State’s<br />
jurisdiction. Approximately 425 of <strong>the</strong> locally operated eng<strong>in</strong>es have been obta<strong>in</strong>ed through <strong>the</strong><br />
Federal Excess Property Program. The agreement authorizes <strong>the</strong> exchange of resources, dollars and<br />
o<strong>the</strong>r pre-suppression activities. There are approximately 172 organized fire departments <strong>in</strong> Wyom<strong>in</strong>g.<br />
<strong>Fire</strong> Activity<br />
Wyom<strong>in</strong>g averages 647 (State and private) wildland fires and burns an average of 129,000<br />
acres a year. The five year statistics show that <strong>the</strong> number of fires <strong>in</strong> Wyom<strong>in</strong>g are on <strong>the</strong> <strong>in</strong>crease.<br />
The annual acreage burned varied from 18,414 acres <strong>in</strong> 2001 to 358,648 acres <strong>in</strong> 2000. Lightn<strong>in</strong>g is<br />
<strong>the</strong> s<strong>in</strong>gle most frequent cause at 30 percent with miscellaneous as <strong>the</strong> second highest causal rate at<br />
23 percent. An average of 83 percent of fires were conta<strong>in</strong>ed at under 10 acres with an average fire<br />
size of 1.15 acres. The average size of fires over 10 acres was 2,741 acres.<br />
In <strong>Fire</strong> Season 2002, Wyom<strong>in</strong>g had 815 fires that burned 163,226 acres, above <strong>the</strong> 5-year<br />
average. <strong>Fire</strong> Season 2002 saw only half as many Class G fires and half as many acres burned <strong>in</strong><br />
Wyom<strong>in</strong>g as <strong>in</strong> 2000.<br />
40
Suppression Policies - <strong>Fire</strong> Management vs. <strong>Fire</strong> Control<br />
Wildland fire protection <strong>in</strong> <strong>the</strong> <strong>West</strong> can be undertaken with any one of a variety of suppression<br />
policies, depend<strong>in</strong>g on <strong>the</strong> location and burn<strong>in</strong>g conditions of <strong>the</strong> fire, <strong>the</strong> mission of<br />
<strong>the</strong> fire protection jurisdiction responsible for suppression, and <strong>the</strong> land management policies of<br />
<strong>the</strong> landowner.<br />
Much of <strong>the</strong> wildland <strong>in</strong> <strong>the</strong> <strong>West</strong> is managed by one of <strong>the</strong> five big federal land management<br />
agencies. Usually, but not always, <strong>the</strong> federal agency that manages <strong>the</strong> land also is <strong>the</strong><br />
agency with fire protection jurisdiction. In this situation, wildland fires are frequently managed<br />
(not necessarily suppressed) to achieve results <strong>in</strong> support of <strong>the</strong> agency’s land management<br />
plan. Three examples best illustrate <strong>the</strong> most common of <strong>the</strong>se situations:<br />
Most wildfires are suppressed; some<br />
are managed.<br />
• A lightn<strong>in</strong>g fire <strong>in</strong> <strong>the</strong> high country of a national park burn<strong>in</strong>g under normal wea<strong>the</strong>r<br />
conditions may be allowed to burn while only be<strong>in</strong>g monitored by NPS personnel, as fire is<br />
a natural part of <strong>the</strong> landscape and NPS seeks to avoid human <strong>in</strong>tervention (and damages)<br />
<strong>in</strong> <strong>the</strong> natural environment. If <strong>the</strong> fire grows too large, burns too <strong>in</strong>tensely, or threatens<br />
improvements, <strong>the</strong> Park Service may decide to take suppression action. O<strong>the</strong>rwise, <strong>the</strong> fire<br />
may be allowed to burn itself out.<br />
• An unplanned ignition <strong>in</strong> a part of a national forest where hazard reduction, type conversion,<br />
etc. is part of an approved management plan may be managed to achieve specific land<br />
management objectives. Forest Service personnel may use <strong>in</strong>direct attack methods and<br />
back off to natural or man-made barriers some distance from <strong>the</strong> fire, achiev<strong>in</strong>g conta<strong>in</strong>ment<br />
of <strong>the</strong> wildfire, but allow<strong>in</strong>g it to burn at appropriate <strong>in</strong>tensity <strong>in</strong> a watershed, cut<br />
block, or o<strong>the</strong>r land management unit where fire is an <strong>in</strong>tegral part of <strong>the</strong> approved management<br />
plan.<br />
• A fire burn<strong>in</strong>g on a military fir<strong>in</strong>g range may not be suppressed, but allowed to burn<br />
itself out to preplanned firebreaks, as entry <strong>in</strong>to an area conta<strong>in</strong><strong>in</strong>g unexpended munitions<br />
would be hazardous to firefighters.<br />
41
O<strong>the</strong>r fires on federal lands dur<strong>in</strong>g <strong>the</strong> normal fire season will usually be suppressed by <strong>the</strong><br />
agency with direct protection responsibility, as <strong>the</strong>y usually start <strong>in</strong> <strong>the</strong> wrong place, burn with<br />
too much <strong>in</strong>tensity or speed to meet land management criteria, or threaten improvements or<br />
o<strong>the</strong>r properties.<br />
Most wildland fire protection <strong>in</strong> <strong>the</strong><br />
<strong>West</strong> is provided by ei<strong>the</strong>r a state or<br />
federal agency.<br />
Most o<strong>the</strong>r wildland fire protection <strong>in</strong> <strong>the</strong> <strong>West</strong> is provided ei<strong>the</strong>r by state forestry agencies,<br />
forest protective associations or by local government fire protection districts. In most cases<br />
<strong>the</strong>se agencies are provid<strong>in</strong>g fire protection to lands owned or managed by someone else, so<br />
<strong>the</strong>y lack <strong>the</strong> authority to make a decision about <strong>the</strong> use of fire on <strong>the</strong> landscape and operate<br />
under a policy of immediate, direct suppression of all wildfires. These same agencies may very<br />
well assist landowners <strong>in</strong> conduct<strong>in</strong>g prescribed burns for hazard reduction and land management<br />
purposes, but an unplanned wildfire is treated as a public nuisance and controlled as soon<br />
as practicable. In some cases, upon consultation with a landowner and a determ<strong>in</strong>ation that <strong>the</strong><br />
risks and cost-benefit ratios are appropriate, <strong>the</strong>se wildland agencies may manage a fire to help<br />
<strong>the</strong> landowner (and <strong>the</strong> agency) achieve a specific goal, especially when this may reduce suppression<br />
costs. In some cases, a conta<strong>in</strong>ed wildfire may be turned over to <strong>the</strong> landowner to<br />
monitor or ext<strong>in</strong>guish, especially on large properties where <strong>the</strong> owner (e.g. rancher, timber<br />
company) has adequate private resources to ma<strong>in</strong>ta<strong>in</strong> control of <strong>the</strong> fire.<br />
Complications<br />
A complicat<strong>in</strong>g factor arises when fire protection duties are delegated by <strong>the</strong><br />
agency or jurisdiction to ano<strong>the</strong>r agency for economic or operational reasons. For<br />
example, <strong>in</strong> some parts of <strong>the</strong> <strong>West</strong>, portions of a national forest may receive direct<br />
fire protection service from <strong>the</strong> state forestry agency, while <strong>the</strong> FS may protect<br />
private lands with<strong>in</strong> <strong>the</strong> forest, sav<strong>in</strong>g each agency money. In Southwestern Oregon,<br />
BLM manages a great deal of timberland broken up <strong>in</strong>to one section blocks<br />
<strong>in</strong>termixed with private property protected by <strong>the</strong> Oregon Department of <strong>Forestry</strong><br />
(ODF). S<strong>in</strong>ce BLM does not wish to provide fire protection to private lands and it<br />
would be impractical for BLM to duplicate <strong>the</strong> exist<strong>in</strong>g ODF protection system,<br />
BLM contracts with ODF to provide fire protection to <strong>the</strong> public lands. BLM<br />
personnel still manage <strong>the</strong> land, plan and execute prescribed burns, serve on fire<br />
management teams, etc., but ODF is <strong>the</strong> primary provider of wildland fire protection<br />
services to <strong>the</strong> public, as well as <strong>the</strong> adjacent private lands (Figure 4).<br />
Figure 4. Th<strong>in</strong>n<strong>in</strong>g <strong>in</strong> Ponderosa P<strong>in</strong>e plantaion <strong>in</strong> Oregon.<br />
42
Figure 5. Rural <strong>in</strong>terface condition; regrowth of brush <strong>in</strong> th<strong>in</strong>ned p<strong>in</strong>e<br />
plantation <strong>in</strong> Oregon. Note houses on slope <strong>in</strong> background.<br />
In recent years, <strong>in</strong> more and<br />
more parts of <strong>the</strong> <strong>West</strong>, <strong>the</strong><br />
opportunity to manage a wildfire<br />
us<strong>in</strong>g an <strong>in</strong>direct suppression<br />
strategy has disappeared due to<br />
<strong>in</strong>creased development and<br />
population growth <strong>in</strong> <strong>the</strong> wildlands.<br />
A thousand acres of forest<br />
near any metropolitan area may<br />
well have a hundred or more<br />
landowners, each with his/her<br />
own values, priorities, and plans<br />
for <strong>the</strong> land. The fire agencies<br />
cannot put <strong>the</strong>mselves <strong>in</strong> <strong>the</strong><br />
position of referee<strong>in</strong>g conflicts<br />
between landowners or o<strong>the</strong>r<br />
special <strong>in</strong>terest groups, and<br />
<strong>the</strong>refore put <strong>the</strong> fire out first,<br />
and “ask questions later”. Any wildfire may soon threaten somebody else’s property, structures,<br />
water rights, viewshed, etc. and thus needs to be conta<strong>in</strong>ed or controlled on <strong>the</strong> property of<br />
orig<strong>in</strong> whenever possible (Figure 5).<br />
Unified command gives each agency a<br />
voice <strong>in</strong> <strong>the</strong> fire suppression<br />
operation.<br />
This is where conflicts between <strong>the</strong> values, missions, policies, and procedures of <strong>the</strong><br />
various wildland fire agencies can get <strong>in</strong> <strong>the</strong> way of true <strong>in</strong>teragency cooperation. When fire<br />
management personnel from an area where jurisdiction always means suppression responsibility<br />
go to a fire <strong>in</strong> an area with <strong>in</strong>teragency protection agreements and operat<strong>in</strong>g plans, <strong>the</strong>y need to<br />
take <strong>the</strong> time to understand <strong>the</strong> roles of <strong>the</strong> various players.<br />
Opportunities<br />
Frequently <strong>in</strong> <strong>the</strong> <strong>West</strong>, it may be appropriate for a state/local team to manage a federal<br />
fire, or for a federal team to manage a state fire. In ei<strong>the</strong>r case, <strong>the</strong> teams have to forget about<br />
<strong>the</strong>ir parent agency’s policies and procedures, and adopt <strong>the</strong> policies and procedures of <strong>the</strong><br />
agency <strong>the</strong>y are work<strong>in</strong>g for. When a major fire <strong>in</strong>volves more than one jurisdiction, <strong>the</strong> fire<br />
management team must <strong>in</strong>volve <strong>the</strong> adm<strong>in</strong>istrators and chief officers of all <strong>the</strong> o<strong>the</strong>r jurisdictional<br />
agencies <strong>in</strong> a true Unified Command. On a large fire, it may well be that <strong>the</strong> FS, BLM,<br />
43
State forestry agency, and one or more local fire protection districts all need to be directly<br />
<strong>in</strong>volved <strong>in</strong> both plann<strong>in</strong>g and execut<strong>in</strong>g <strong>the</strong> suppression strategy. When multiple large fires<br />
occur, <strong>the</strong> Multi-Agency Coord<strong>in</strong>at<strong>in</strong>g System (MACS) needs to be used; with decision<br />
makers from all <strong>in</strong>volved protection agencies jo<strong>in</strong>tly establish<strong>in</strong>g priorities and allocat<strong>in</strong>g scarce<br />
resources.<br />
MACS should set priorities and<br />
allocate scarce resources.<br />
Sometimes agency adm<strong>in</strong>istrators (l<strong>in</strong>e officers) who are not fully cognizant of <strong>the</strong> applicable<br />
<strong>in</strong>teragency agreements and operat<strong>in</strong>g plans, lack experience and/or understand <strong>the</strong>ir responsibilities<br />
<strong>in</strong> fire operations. <strong>Fire</strong> management teams need to work closely with adm<strong>in</strong>istrators to assure that<br />
conflict<strong>in</strong>g policies, missions, or values do not get <strong>in</strong> <strong>the</strong> way of tak<strong>in</strong>g appropriate suppression<br />
action <strong>in</strong> a timely manner. It may<br />
be appropriate for a district ranger<br />
to mull over <strong>the</strong> potential to scoop<br />
up rare and endangered trout <strong>in</strong> a<br />
fire helicopter’s water bucket, but<br />
not at <strong>the</strong> moment that <strong>the</strong> fire is<br />
threaten<strong>in</strong>g to burn “Joe<br />
Taxpayer’s” ranch (Figure 6).<br />
Conflict<strong>in</strong>g policies, missions,<br />
and values will always<br />
exist <strong>in</strong> <strong>the</strong> wildlands. It is<br />
<strong>in</strong>cumbent upon <strong>the</strong> fire management<br />
personnel of all agencies to<br />
recognize and mitigate <strong>the</strong>se<br />
conflicts before, not dur<strong>in</strong>g, <strong>the</strong><br />
fire. Clear, comprehensive<br />
<strong>in</strong>teragency agreements and<br />
operat<strong>in</strong>g plans, and adequate<br />
Figure 6. Selective logg<strong>in</strong>g, slash treated, ready for broadcast burn<strong>in</strong>g<br />
<strong>in</strong> Oregon.<br />
tra<strong>in</strong><strong>in</strong>g for appropriate decision-makers can help <strong>in</strong>sure that fires get managed or controlled <strong>in</strong><br />
<strong>the</strong> most effective way, ra<strong>the</strong>r than burn unchecked while turf battles rage.<br />
44
The <strong>Fire</strong> Environment<br />
Every one of us must be concerned with <strong>the</strong> state of our natural environment. In any<br />
discussion about impacts on <strong>the</strong> environment, we need also to factor <strong>in</strong> what <strong>the</strong> economic and<br />
social factors are. You can never hope for success if this is not done. If <strong>the</strong>se three very important<br />
factors <strong>in</strong> our society are discussed as stand alone issues, <strong>the</strong>re will never be a solution to<br />
our problems.<br />
Warm<strong>in</strong>g Trends<br />
For some years now, scientists, naturalists, politicians, and o<strong>the</strong>r alarmists have been<br />
worry<strong>in</strong>g aloud about <strong>the</strong> phenomenon of global warm<strong>in</strong>g and its possible consequences for<br />
humank<strong>in</strong>d. The th<strong>in</strong>k<strong>in</strong>g is that “greenhouse gases”, especially carbon dioxide produced from<br />
fossil fuels combustion, are modify<strong>in</strong>g our atmosphere <strong>in</strong> such a way that <strong>the</strong> average temperature<br />
of <strong>the</strong> whole world is <strong>in</strong>creas<strong>in</strong>g. Various studies show that this warm<strong>in</strong>g (up to 2 degrees<br />
F) of average temperatures can lead to significant changes <strong>in</strong> our ecosystems, some of which<br />
could be disastrous.<br />
Environmental ecology <strong>in</strong>cludes<br />
economic and social factors, not just<br />
flora and fauna.<br />
For example, some predict <strong>the</strong> melt<strong>in</strong>g of <strong>the</strong> polar icecaps and mounta<strong>in</strong> glaciers could<br />
raise sea level enough to permanently flood coastal cities worldwide that are home to millions<br />
of people. Meteorologists predict that “normal” wea<strong>the</strong>r patterns will change, transform<strong>in</strong>g ra<strong>in</strong><br />
forests to deserts and tundra to tropical forest. Scientists claim that boreal forests are march<strong>in</strong>g<br />
northward, deserts are expand<strong>in</strong>g, rivers and lakes are shr<strong>in</strong>k<strong>in</strong>g, and this is only <strong>the</strong> beg<strong>in</strong>n<strong>in</strong>g<br />
of even greater change.<br />
Whe<strong>the</strong>r directly related to global warm<strong>in</strong>g, or just an anomaly of our statistical data base,<br />
it seems like severe drought conditions are becom<strong>in</strong>g more common <strong>in</strong> recent years. Some<br />
blame “El N<strong>in</strong>o”, <strong>the</strong> warm water pool, or “La N<strong>in</strong>a”, <strong>the</strong> cold water pool, <strong>in</strong> <strong>the</strong> central Pacific<br />
Ocean, for disrupt<strong>in</strong>g normal storm track<strong>in</strong>g patterns <strong>in</strong>to <strong>the</strong> U.S. Three consecutive “El N<strong>in</strong>o”<br />
w<strong>in</strong>ters have pushed <strong>the</strong> jet stream to <strong>the</strong> north, with fewer wet storms reach<strong>in</strong>g <strong>the</strong> U.S. Whatever<br />
<strong>the</strong> cause, widespread drought conditions have contributed to greatly <strong>in</strong>creased fire danger<br />
throughout <strong>the</strong> country <strong>in</strong> <strong>the</strong> last several years.<br />
45
Major wildfires have occurred <strong>in</strong> places like New York, New Jersey, and Florida <strong>in</strong> recent<br />
years. These places normally have enough moisture year round to keep fire danger relatively<br />
low, compared to normal summer conditions <strong>in</strong> much of <strong>the</strong> arid <strong>West</strong>.<br />
In 2002, almost half of <strong>the</strong> USA<br />
suffered moderate to extreme<br />
drought conditions.<br />
In 2002, almost half of <strong>the</strong> USA suffered moderate to extreme drought conditions. Much<br />
of <strong>the</strong> eastern seaboard, from Maryland to Alabama suffered drought that wi<strong>the</strong>red crops and<br />
depleted local domestic water supplies. The southwestern U.S. was particularly hard hit, as <strong>the</strong><br />
extreme drought centered on <strong>the</strong> “Four Corners” region cont<strong>in</strong>ued <strong>in</strong>to its fifth year. This spr<strong>in</strong>g<br />
was <strong>the</strong> driest on record (107 years) <strong>in</strong> Colorado and <strong>the</strong> second driest <strong>in</strong> Arizona and Sou<strong>the</strong>rn<br />
California.<br />
Some of <strong>the</strong> effects of this severe drought <strong>in</strong> <strong>the</strong> <strong>West</strong> are easy to spot: “bathtub” r<strong>in</strong>gs<br />
around major reservoirs, <strong>in</strong>creased <strong>in</strong>sect and disease outbreaks <strong>in</strong> forests, streams reduced to<br />
trickles, and brush go<strong>in</strong>g dormant or dy<strong>in</strong>g back. In Arizona, bark beetle <strong>in</strong>festations have killed<br />
25-30% of <strong>the</strong> Ponderosa P<strong>in</strong>e forest <strong>in</strong> <strong>the</strong> Flagstaff area. In <strong>the</strong> surround<strong>in</strong>g lower elevations<br />
covered with P<strong>in</strong>yon-Juniper forest, nearly all of <strong>the</strong> P<strong>in</strong>yon P<strong>in</strong>e has died.<br />
Some of <strong>the</strong> effects are less obvious: reduced food and water sources stress many species<br />
of wildlife, but won’t be apparent until w<strong>in</strong>ter die off counts are <strong>in</strong>. The migration of everyth<strong>in</strong>g<br />
from deer and elk to butterflies can be disrupted when food sources whi<strong>the</strong>r. Golden Trout gasp<br />
<strong>in</strong> stagnant pools of warm water. Then th<strong>in</strong>gs get worse.<br />
Forest Health<br />
The huge wildfires that ravaged <strong>the</strong> <strong>West</strong> <strong>in</strong> 2000 were thought to be <strong>the</strong> result of an<br />
unusual set of circumstances (drought + wea<strong>the</strong>r + lightn<strong>in</strong>g) that would not be repeated for<br />
many years. <strong>Fire</strong> season 2002 proved that <strong>the</strong>ory held as little water as some western lakes.<br />
The forests of <strong>the</strong> <strong>West</strong> today are overstocked compared to pre-settlement forests. Many<br />
more <strong>in</strong>dividual trees compete for sunlight, nutrients, water, and grow<strong>in</strong>g space on each acre of<br />
ground. The trees are smaller, closer toge<strong>the</strong>r, and slower grow<strong>in</strong>g than <strong>the</strong>y should be. When<br />
conditions turn marg<strong>in</strong>al, <strong>the</strong> weaker trees die as nature tries to balance <strong>the</strong> population with <strong>the</strong><br />
carry<strong>in</strong>g capacity of <strong>the</strong> forest (Figure 7).<br />
The extended drought, global warm<strong>in</strong>g, and years of exclusion of fire from <strong>the</strong> forests have<br />
created unusually high fuel volumes that allow wildfires to burn with great <strong>in</strong>tensity, frequently<br />
46
well beyond <strong>the</strong> capabilities of fire<br />
suppression forces. The fuel<br />
available to today’s wildfires<br />
consists of years of accumulated<br />
logg<strong>in</strong>g slash, dead trees killed by<br />
<strong>in</strong>sects and disease, highly flammable<br />
brush species that provide<br />
“ladder fuels” for fire to travel<br />
<strong>in</strong>to <strong>the</strong> crowns of <strong>the</strong> trees, and<br />
non-native grasses that are highly<br />
flammable and promote <strong>the</strong> easy<br />
ignition and rapid spread of new<br />
fires.<br />
Most brush species have<br />
adapted to drought conditions by Figure 7. Untreated Ponderosa P<strong>in</strong>e Forest <strong>in</strong> Arizona.<br />
decreas<strong>in</strong>g <strong>the</strong> ratio of live to dead<br />
material <strong>in</strong> each plant, which makes <strong>the</strong>m more flammable. Additionally, many brush species go<br />
<strong>in</strong>to a dormant condition dur<strong>in</strong>g times of heat or drought stress, decreas<strong>in</strong>g <strong>the</strong> plant’s live fuel<br />
moisture to <strong>the</strong> critical level.<br />
Overstocked, decadent forests mean<br />
larger, more <strong>in</strong>tensive wildfires.<br />
In <strong>the</strong> pre-settlement era, frequent small, low <strong>in</strong>tensity fires, usually caused by lightn<strong>in</strong>g,<br />
but some ignited by Native Americans, created forests of larger trees, spread far<strong>the</strong>r apart,<br />
elim<strong>in</strong>ated dead and dy<strong>in</strong>g trees, reduced <strong>the</strong> population of <strong>in</strong>sects, and kept down <strong>the</strong> <strong>in</strong>vasive<br />
of brush. That forest was open and park like, with many open spaces, facilitat<strong>in</strong>g travel for man<br />
and beast alike. Beg<strong>in</strong>n<strong>in</strong>g <strong>in</strong> <strong>the</strong> mid 1800’s <strong>in</strong>tense logg<strong>in</strong>g activity created large accumulations<br />
of dead and down woody materials. Random burn<strong>in</strong>g of logg<strong>in</strong>g slash without regard for<br />
fire <strong>in</strong>tensity and post fire effects allowed <strong>in</strong>creased <strong>in</strong>vasion of brush and weed species, many<br />
non-native virulent pests capable of out compet<strong>in</strong>g native vegetation. This cut and burn mentality<br />
lasted up until “The Big Blow Up of 1910”, when massive wildfires destroyed more than 10<br />
million acres, dozens of towns, and killed hundreds of people.<br />
Prescribed <strong>Fire</strong><br />
Follow<strong>in</strong>g <strong>the</strong> fires of 1910, public policy changed to require immediate suppression of<br />
wildfires and to severely curtail controlled burns. In <strong>the</strong> fifty years that followed, federal and<br />
47
state forestry agencies developed fire suppression capabilities that have largely excluded fire<br />
from most of our forest lands. While some blame a “Smokey Bear Mentality” for exclud<strong>in</strong>g<br />
fire from <strong>the</strong> forests, o<strong>the</strong>r factors are also responsible. Foresters have long recognized <strong>the</strong><br />
need for fire to reduce fuel load<strong>in</strong>g, recycle nutrients, and reduce competition from undesirable<br />
species. The problem has been that society has placed restra<strong>in</strong>ts on <strong>the</strong> use of controlled burns<br />
(AKA prescribed fire). The backlash of public op<strong>in</strong>ion aga<strong>in</strong>st commercial logg<strong>in</strong>g has made<br />
th<strong>in</strong>n<strong>in</strong>g of <strong>the</strong> forest for hazard reduction very difficult to accomplish. Air pollution concerns<br />
limit <strong>the</strong> amount of burn<strong>in</strong>g that can be accomplished <strong>in</strong> a given area with<strong>in</strong> a given timeframe<br />
to uneconomical project sizes. Lastly, and probably most importantly, <strong>the</strong> fear of liability (i.e.<br />
tort claims and civil suits) co<strong>in</strong>cid<strong>in</strong>g with <strong>the</strong> proliferation of trial lawyers, has made it very<br />
risky for most landowners to attempt to use fire to restore forest health.<br />
The situation we now face is that we need to re<strong>in</strong>troduce frequent, low <strong>in</strong>tensity fires <strong>in</strong>to<br />
<strong>the</strong> forest ecosystems, but are prevented from do<strong>in</strong>g so by <strong>the</strong> accumulation of fuel, <strong>the</strong> tangle<br />
of red tape, and <strong>the</strong> fear of liability and conflict<strong>in</strong>g public op<strong>in</strong>ion.<br />
Restoration Recipes<br />
Because of <strong>the</strong> <strong>in</strong>creased stand density, <strong>the</strong> accumulation of fuels, <strong>the</strong> presence<br />
of highly flammable brush species that serve as ladder fuels promot<strong>in</strong>g<br />
crown fires, <strong>the</strong> effects of drought, and <strong>the</strong> exposure of neighbor<strong>in</strong>g properties it<br />
is not possible to control burn <strong>the</strong> modern forest without extensive preparation.<br />
Th<strong>in</strong>n<strong>in</strong>g of overstocked timber stands is <strong>the</strong> first step <strong>in</strong> <strong>the</strong> process of<br />
restor<strong>in</strong>g forest health. In most cases, logg<strong>in</strong>g and <strong>the</strong> sale of <strong>the</strong> wood products is<br />
<strong>the</strong> only way to make forest health restoration projects even marg<strong>in</strong>ally costeffective.<br />
Follow<strong>in</strong>g a th<strong>in</strong>n<strong>in</strong>g cut, <strong>the</strong> slash needs to be treated to reduce its<br />
height and surface-to-volume ratio to make it safe to burn. This can be done<br />
mechanically with mach<strong>in</strong>es such as <strong>the</strong> Slashbuster or Hydroaxe, or manually by<br />
crews that lop and pile <strong>the</strong> slash for burn<strong>in</strong>g under benign conditions. Only when<br />
<strong>the</strong> stand has been th<strong>in</strong>ned, <strong>the</strong> slash treated, <strong>the</strong> brush crushed, control l<strong>in</strong>es<br />
established, permits obta<strong>in</strong>ed, and forces organized can prescribed fire projects be<br />
safely conducted (Figures 8, 9, and 10).<br />
Figure 8. Commercial th<strong>in</strong>n<strong>in</strong>g cut with slash piled and burned <strong>in</strong><br />
Arizona.<br />
48
Restor<strong>in</strong>g<br />
forest health is a<br />
complicated issue<br />
with many potential<br />
roadblocks on<br />
<strong>the</strong> path to success.<br />
Only with<br />
public understand<strong>in</strong>g<br />
and support,<br />
<strong>in</strong>teragency cooperation,<br />
appropriate<br />
fund<strong>in</strong>g levels,<br />
and protection<br />
from liability can<br />
fire be used effectively<br />
<strong>in</strong> its appropriate<br />
environmental<br />
role. Only with<br />
prescribed fire can<br />
forest health be<br />
reasonably restored<br />
on a landscape<br />
scale to <strong>the</strong><br />
forests of <strong>the</strong> <strong>West</strong><br />
(Figures 11 and<br />
12).<br />
Figure 9. Creat<strong>in</strong>g open<strong>in</strong>gs <strong>in</strong> p<strong>in</strong>e forest <strong>in</strong> Arizona. Note slash piled<br />
for burn<strong>in</strong>g <strong>in</strong> background.<br />
Figure 10. Low <strong>in</strong>tensity fires like this are very beneficial to <strong>the</strong><br />
health of <strong>the</strong> forests.<br />
Figure 11. Treated p<strong>in</strong>e slash ready for burn<strong>in</strong>g <strong>in</strong> Arizona.<br />
Figure 12. P<strong>in</strong>e trees th<strong>in</strong>ned, slash piled for burn<strong>in</strong>g <strong>in</strong> Arizona.<br />
49
Values at Risk<br />
<strong>Fire</strong> management priorities:<br />
1. Human health and safety;<br />
2. Critical Watersheds/Resources/<br />
Communities;<br />
3. Natural Resources/Individual<br />
Homes<br />
The federal land agencies are adamant that it is not <strong>the</strong>ir responsibility to pay for protection<br />
of structures threatened by encroach<strong>in</strong>g wildfires orig<strong>in</strong>at<strong>in</strong>g on federal lands, because <strong>the</strong><br />
responsibility for protect<strong>in</strong>g structures falls to <strong>the</strong> state or local governments.Compound<strong>in</strong>g <strong>the</strong><br />
problem are conflict<strong>in</strong>g federal policies: <strong>Fire</strong>Wise guidel<strong>in</strong>es advise aga<strong>in</strong>st build<strong>in</strong>g homes <strong>in</strong><br />
high fire hazard wildland areas; FEMA provides low-<strong>in</strong>terest loans to homeowners whose<br />
houses have been destroyed by wildfire so <strong>the</strong>y can rebuild <strong>in</strong> <strong>the</strong> same area. Local governments<br />
are reluctant to adopt str<strong>in</strong>gent <strong>Fire</strong>Safe regulations that would reduce fire threats to<br />
structures, but look to <strong>the</strong> state and federal governments to provide, or at least fund, structure<br />
protection dur<strong>in</strong>g wildfires.<br />
There are three significant categories of values at risk dur<strong>in</strong>g a wildfire:<br />
• Human health and safety - Human health and safety are threatened by wildfires, both<br />
directly (be<strong>in</strong>g burned) and <strong>in</strong>directly (air pollution), and s<strong>in</strong>ce wildfires can threaten large<br />
numbers of people, this is also an issue of broad public concern. Because poor forest<br />
health means more fuel available, wildfires have been grow<strong>in</strong>g more <strong>in</strong>tense, difficult to<br />
control, and dangerous to firefighters. In recent years, <strong>the</strong>re have been more firefighter<br />
deaths and <strong>in</strong>juries, result<strong>in</strong>g <strong>in</strong> a trend to put firefighter safety above all o<strong>the</strong>r values at<br />
risk, with sometimes un<strong>in</strong>tended consequences.<br />
• Natural resources - The natural resources on public lands belong to all citizens and are<br />
<strong>the</strong>refore of broad public concern. Some of <strong>the</strong> natural resource values at risk dur<strong>in</strong>g a<br />
wildfire are timber, forage, wildlife, soil, water, and recreation. The natural resources on<br />
private lands have public as well as private value and are also of broad public concern.<br />
Some public values at risk of wildfire on private lands are timber, wildlife, soil, water, and<br />
recreation. In o<strong>the</strong>r words, <strong>the</strong> public at large reaps benefits from healthy forests <strong>in</strong> private<br />
ownership. This concept has been <strong>the</strong> basis for some states to take an active role <strong>in</strong> wildfire<br />
protection. Unfortunately, due to several factors, <strong>the</strong> forests of America are overcrowded,<br />
decadent, and capable of support<strong>in</strong>g unusually <strong>in</strong>tense forest fires that do even<br />
greater damage to <strong>the</strong> natural resources. Forest health should be a concern to everyone.<br />
50
• Property - Property <strong>in</strong>cludes land and human improvements upon <strong>the</strong> land, which may<br />
be <strong>in</strong> both public and private ownership. The loss of a s<strong>in</strong>gle home <strong>in</strong> a forest fire is a<br />
matter primarily of concern to <strong>the</strong> property owner and <strong>the</strong> <strong>in</strong>surance company. The loss of<br />
many houses <strong>in</strong> a s<strong>in</strong>gle community is a matter of concern to <strong>the</strong> whole community; as<br />
such losses have psychological, physical, emotional, and economic effects on all residents.<br />
If a large number of structures are lost, it will have an impact on <strong>the</strong> community’s <strong>in</strong>frastructure.<br />
A classic example of a public value at risk and <strong>in</strong>advertent damages occurred this<br />
year <strong>in</strong> Colorado, where <strong>the</strong> Hayman <strong>Fire</strong> wiped out hundreds of homes. In one local fire<br />
district so many homes were lost that <strong>the</strong> district lost 75-80% of its assessed valuation and<br />
had to lay off firefighters and medics. The rema<strong>in</strong><strong>in</strong>g residents have suffered a reduction <strong>in</strong><br />
fire protection and emergency medical services as a result of a wildfire orig<strong>in</strong>at<strong>in</strong>g on<br />
federal land. This reduction <strong>in</strong> service will also discourage more burned out residents from<br />
rebuild<strong>in</strong>g. This small community may never recover. The loss of hundreds of homes <strong>in</strong> a<br />
s<strong>in</strong>gle wildfire, or thousands of homes <strong>in</strong> <strong>the</strong> nation each fire season, should be a matter of<br />
concern to all Americans due to <strong>the</strong> direct costs of fire suppression and disaster reimbursement,<br />
plus <strong>the</strong> <strong>in</strong>direct costs of air pollution, economic disruption, post-fire flood events,<br />
water quality degradation, etc.<br />
The loss of a s<strong>in</strong>gle home is a tragedy<br />
for <strong>the</strong> homeowner; <strong>the</strong> loss of<br />
hundreds of homes is a loss for <strong>the</strong><br />
community.<br />
Until very recently <strong>the</strong>se values at risk from wildfires were not given <strong>the</strong> same priorities by<br />
<strong>the</strong> different levels of government. The federal wildfire agencies, be<strong>in</strong>g also land management<br />
agencies, put natural resource protection as <strong>the</strong>ir first priority. Local governments, be<strong>in</strong>g funded<br />
<strong>in</strong> large measure by property taxes, put structure protection as <strong>the</strong>ir first priority. State forestry<br />
and emergency management agencies frequently found <strong>the</strong>mselves <strong>in</strong> <strong>the</strong> middle, be<strong>in</strong>g concerned<br />
about public safety, property (e.g. tax base) loss, natural resource degradation (especially<br />
on state lands), and <strong>the</strong> cost of post-fire rehabilitation and damage control (floods, etc.).<br />
As <strong>the</strong> population has grown and people have acquired <strong>the</strong> fiscal and physical ability to<br />
commute to <strong>the</strong>ir work, <strong>the</strong>re has been a dramatic <strong>in</strong>crease <strong>in</strong> <strong>the</strong> number of homes be<strong>in</strong>g built<br />
<strong>in</strong> or adjacent to <strong>the</strong> wildlands. These homes <strong>in</strong> <strong>the</strong> woods have created what has come to be<br />
termed <strong>the</strong> wildland/urban <strong>in</strong>terface. Here <strong>the</strong> fire problem is compounded, as homes are at risk<br />
from wildfires and forests are at risk from human activity <strong>in</strong> and near <strong>the</strong>ir residences. The<br />
wildland/urban <strong>in</strong>terface fire problem, once conf<strong>in</strong>ed to sou<strong>the</strong>rn California, is now significant<br />
<strong>in</strong> almost every western state and gett<strong>in</strong>g worse each year. This year, wildfires <strong>in</strong> Colorado<br />
threatened more than 140 subdivisions and forced <strong>the</strong> evacuation of more than 80,000 residents.<br />
51
These improvements and human activities <strong>in</strong>/near <strong>the</strong> wildland have changed <strong>the</strong> nature of<br />
fire fight<strong>in</strong>g. When wildland was un<strong>in</strong>habited, firefighters could choose <strong>the</strong>ir place to battle a<br />
fire, usually at a ridge top, stream, road, or o<strong>the</strong>r exist<strong>in</strong>g barrier to fire spread where conditions<br />
favored firefight<strong>in</strong>g operations. Frequently, <strong>the</strong>re was room to back off until burn<strong>in</strong>g conditions<br />
moderated and it was easier to control <strong>the</strong> fire. Increas<strong>in</strong>gly <strong>the</strong>se days, firefighters must go after<br />
a wildfire immediately, under all conditions, as <strong>the</strong>re are probably homes or o<strong>the</strong>r improvements<br />
nearby that are immediately <strong>in</strong> danger. This need to fight fire on <strong>the</strong> fire’s terms makes firefight<strong>in</strong>g<br />
more dangerous and more expensive.<br />
<strong>Fire</strong>Safe homes have ignition-resistant<br />
roofs and adequate clearance.<br />
As <strong>the</strong> wildland/urban <strong>in</strong>terface has grown, <strong>the</strong> cost of fight<strong>in</strong>g wildfires has risen dramatically.<br />
Much of this cost <strong>in</strong>crease is due to <strong>the</strong> additional fire eng<strong>in</strong>es, aircraft, and overhead that<br />
are needed to protect improvements <strong>in</strong> front of <strong>the</strong> fire, often far <strong>in</strong> front of <strong>the</strong> fire, and often<br />
for days on end. This dramatic <strong>in</strong>crease <strong>in</strong> cost has concerned government officials, lead<strong>in</strong>g to<br />
such counterproductive federal actions as fail<strong>in</strong>g to take appropriate structure protection measures,<br />
refus<strong>in</strong>g to pay for <strong>the</strong> costs of structure protection, etc. The high po<strong>in</strong>t of irresponsibility<br />
on <strong>the</strong> structure protection issue was probably reached <strong>in</strong> 2002, when <strong>the</strong> Office of Management<br />
and Budget noted that it was “cheaper to let <strong>the</strong> houses burn and pay <strong>the</strong> cost of rebuild<strong>in</strong>g than<br />
to protect <strong>the</strong>m from wildfire.” Only a “bean counter” could ignore <strong>the</strong> fact that <strong>the</strong> most important<br />
th<strong>in</strong>gs to most families cannot be replaced when <strong>the</strong>ir home burns.<br />
Tak<strong>in</strong>g Responsibility<br />
Who <strong>the</strong>n is really responsible for protect<strong>in</strong>g structures <strong>in</strong> <strong>the</strong> wildland/urban <strong>in</strong>terface<br />
from encroach<strong>in</strong>g wildfires The answer is nearly everybody.<br />
First, property owners <strong>in</strong> <strong>the</strong> wildland/urban <strong>in</strong>terface<br />
must assume responsibility to provide an appropriate measure<br />
of built-<strong>in</strong> fire protection for <strong>the</strong>ir improvements. The two most<br />
important features to <strong>the</strong> survival of a structure threatened by a<br />
wildfire are ignition-resistant construction and defensible<br />
space. Roof<strong>in</strong>g materials that are ignition-resistant prevent<br />
fall<strong>in</strong>g firebrands from ignit<strong>in</strong>g a structure and help prevent fire<br />
spread from structure to structure, which is a major cause of<br />
fire transmission <strong>in</strong> large structure loss wildfires.<br />
52
Defensible space or clearance provides an area around each<br />
structure where vegetation has been managed to decrease fire<br />
<strong>in</strong>tensity enough to prevent spread to <strong>the</strong> structure and to provide<br />
an area safe for firefighters to work <strong>in</strong>. These two measures,<br />
tailored to <strong>the</strong> local fire danger, could dramatically reduce<br />
structure loss.<br />
Second, <strong>the</strong> community as a whole must<br />
assume responsibility for protect<strong>in</strong>g itself. This<br />
<strong>in</strong>cludes apply<strong>in</strong>g peer pressure to property<br />
owners who fail to make <strong>the</strong>ir properties<br />
<strong>Fire</strong>Safe. It means tak<strong>in</strong>g voluntary jo<strong>in</strong>t action<br />
to mitigate what one property owner is not able<br />
to do. It means tak<strong>in</strong>g actions to improve fire safety by adopt<strong>in</strong>g appropriate regulations on<br />
development, build<strong>in</strong>g and ma<strong>in</strong>ta<strong>in</strong><strong>in</strong>g fire defense improvements, form<strong>in</strong>g, jo<strong>in</strong><strong>in</strong>g, and<br />
support<strong>in</strong>g local fire departments, and teach<strong>in</strong>g <strong>Fire</strong>Safe pr<strong>in</strong>ciples to <strong>the</strong> next generation.<br />
Individuals, communities, and all levels<br />
of government need to be responsible<br />
for wildland fire safety.<br />
Third, local government needs to assume responsibility for appropriate fire prevention and<br />
suppression measures. This means adopt<strong>in</strong>g plann<strong>in</strong>g and development regulations that promote<br />
fire safety, requir<strong>in</strong>g built-<strong>in</strong> fire protection measures <strong>in</strong> <strong>the</strong> wildland/urban <strong>in</strong>terface, and<br />
provid<strong>in</strong>g an appropriate level of fire protection service. It <strong>in</strong>cludes develop<strong>in</strong>g a system of fire<br />
defense improvements such as water systems, helispots, fuelbreaks, firebreaks, access roads,<br />
and safety zones. It means adopt<strong>in</strong>g strict street sign and house address<strong>in</strong>g regulations. It means<br />
properly equipp<strong>in</strong>g and tra<strong>in</strong><strong>in</strong>g <strong>the</strong> local fire department to safely and efficiently fight wildfires<br />
and protect structures <strong>in</strong> <strong>the</strong> wildland/urban <strong>in</strong>terface. It means develop<strong>in</strong>g automatic aid and<br />
mutual aid agreements with neighbor<strong>in</strong>g jurisdictions.<br />
Fourth, state governments need to assume responsibility for an appropriate level of fire<br />
protection on non-federal wildlands, especially <strong>in</strong> <strong>the</strong> wildland/urban <strong>in</strong>terface. This can be<br />
done <strong>in</strong> a variety of ways, on both state and private lands. The state can manage its own lands <strong>in</strong><br />
a manner that will assure healthy forests with lower fire danger. Properly managed State lands<br />
can serve as demonstration areas for <strong>Fire</strong>Safe and forest health improvement measures. The<br />
State can assume a coord<strong>in</strong>ation role to facilitate jo<strong>in</strong>t cooperative <strong>Fire</strong>Wise/<strong>Fire</strong>Safe projects<br />
between all levels of government and <strong>the</strong> private sector. The State can sponsor <strong>Fire</strong>Safe education<br />
programs and provide model ord<strong>in</strong>ances or regulations to assure an appropriate m<strong>in</strong>imum<br />
53
level of fire safety statewide. States can support and coord<strong>in</strong>ate an efficient statewide mutual aid<br />
system and can assume full responsibility for primary fire protection on non-federal wildlands,<br />
thus reduc<strong>in</strong>g jurisdictional problems and avoid<strong>in</strong>g widely variant levels of fire protection.<br />
Improved forest health is key to <strong>the</strong><br />
survivability of our forests.<br />
Last, <strong>the</strong> federal government needs to assume responsibility for an appropriate level of fire<br />
protection on federal lands. This <strong>in</strong>cludes improv<strong>in</strong>g forest health and reduc<strong>in</strong>g fire hazards,<br />
especially <strong>in</strong> <strong>the</strong> wildland/urban <strong>in</strong>terface. It means provid<strong>in</strong>g leadership and fund<strong>in</strong>g to support<br />
<strong>the</strong> efforts of state and local governments to reduce fire danger and improve fire protection <strong>in</strong><br />
<strong>the</strong> wildland/urban <strong>in</strong>terface, especially near federal wildlands. It means elim<strong>in</strong>at<strong>in</strong>g conflict<strong>in</strong>g<br />
federal policies like subsidiz<strong>in</strong>g rebuild<strong>in</strong>g structures already lost to fire <strong>in</strong> high hazard areas. It<br />
means giv<strong>in</strong>g due consideration to values at risk from wildfire, both public and private, on lands<br />
adjacent to federal wildlands. It means adopt<strong>in</strong>g land management and fire protection policies<br />
and procedures that appropriately prioritize wildfire threats to natural resources, human health<br />
and safety, and property. It means tra<strong>in</strong><strong>in</strong>g its adm<strong>in</strong>istrators and fire managers to recognize offforest<br />
values at risk from wildfire and to take actions appropriate to <strong>the</strong> best overall public<br />
<strong>in</strong>terest ra<strong>the</strong>r than to <strong>the</strong>ir particular agency program.<br />
Because wildfires are a threat to a broad range of public values and <strong>in</strong>terests, it is imperative<br />
that <strong>the</strong> broadest possible range of publics assume an appropriate level of responsibility for<br />
wildfire prevention, control, and mitigation.<br />
54
National <strong>Fire</strong> Plan<br />
<strong>Fire</strong> Season 2000 <strong>in</strong> <strong>the</strong> <strong>West</strong> saw more than 8 million<br />
acres and hundreds of structures burn as wildfires roamed from<br />
<strong>the</strong> backcountry of <strong>the</strong> National Forests to <strong>the</strong> ma<strong>in</strong> streets of<br />
cities like Los Alamos, and fire suppression costs soared.<br />
Follow<strong>in</strong>g this landmark season, a special report to <strong>the</strong> President,<br />
entitled Manag<strong>in</strong>g <strong>the</strong> Impact of Wildfires on Communities<br />
and <strong>the</strong> Environment became <strong>the</strong> focal po<strong>in</strong>t for <strong>the</strong> federal<br />
government to take broad and far reach<strong>in</strong>g actions to both<br />
reduce <strong>the</strong> risk of catastrophic wildfire and improve fire prevention<br />
and suppression capabilities, especially <strong>in</strong> <strong>the</strong> Wildland/<br />
Urban Interface.<br />
The National <strong>Fire</strong> Plan <strong>in</strong>fused much<br />
needed fund<strong>in</strong>g <strong>in</strong>to <strong>the</strong> federal<br />
wildland fire agencies.<br />
Start<strong>in</strong>g <strong>in</strong> 2001, a new federal wildland fire policy was issued<br />
that was aimed at ensur<strong>in</strong>g consistency, coord<strong>in</strong>ation, and <strong>in</strong>tegration of<br />
wildland fire management programs throughout all agencies of <strong>the</strong> federal<br />
government. The new policy focused on pr<strong>in</strong>ciples such as giv<strong>in</strong>g firefighter and public<br />
safety first priority, recogniz<strong>in</strong>g <strong>the</strong> role of wildfire <strong>in</strong> natural ecosystems, <strong>in</strong>tegrat<strong>in</strong>g<br />
fire management and o<strong>the</strong>r land management programs, improv<strong>in</strong>g <strong>the</strong> economic<br />
viability of fire protection systems, us<strong>in</strong>g appropriate science as <strong>the</strong><br />
basis for plann<strong>in</strong>g, and coord<strong>in</strong>at<strong>in</strong>g with o<strong>the</strong>r levels of government.<br />
Seventeen basic policy statements were to be <strong>in</strong>corporated<br />
<strong>in</strong>to <strong>the</strong> directives, manuals, and tra<strong>in</strong><strong>in</strong>g systems of every federal<br />
agency <strong>in</strong>volved <strong>in</strong> wildland fire protection.<br />
That same year, Congress appropriated an additional $1.6<br />
billion to beg<strong>in</strong> implementation of <strong>the</strong> new fire policy and directed<br />
<strong>the</strong> secretaries of Agriculture and <strong>the</strong> Interior to develop a longterm<br />
strategy (National <strong>Fire</strong> Plan) to deal with wildland fires and<br />
mitigate hazardous fuel situations. This strategy, A Collaborative<br />
Approach for Reduc<strong>in</strong>g Wildland <strong>Fire</strong> Risks to Communities and<br />
<strong>the</strong> Environment; 10-Year Comprehensive Strategy (often shortened<br />
to “The Strategy”), was completed <strong>in</strong> August 2001.<br />
55
The goals of The Strategy are:<br />
• Improve <strong>Fire</strong> Prevention and Suppression<br />
• Reduce Hazardous Fuels<br />
• Restore <strong>Fire</strong>-Adapted Ecosystems<br />
A ten-year plan has been developed.<br />
• Promote Community Assistance<br />
An Implementation Plan for The Strategy was completed <strong>in</strong><br />
May of 2002 and endorsed by <strong>the</strong> federal agencies and <strong>the</strong>ir partners,<br />
<strong>in</strong>clud<strong>in</strong>g state forestry agencies and tribal governments. The<br />
plan should improve cooperation and communication among all<br />
parties at all levels and help <strong>in</strong>sure that key project plann<strong>in</strong>g decisions<br />
are made at <strong>the</strong> local level. It also establishes responsibility<br />
among <strong>the</strong> participants for plann<strong>in</strong>g, prioritiz<strong>in</strong>g, and accomplish<strong>in</strong>g<br />
tasks <strong>in</strong> a timely and cost-effective manner consistent with<br />
chang<strong>in</strong>g conditions and relevant science. See <strong>the</strong> Appendix for a<br />
more detailed look at <strong>the</strong> components of <strong>the</strong> National <strong>Fire</strong> Plan, <strong>in</strong>clud<strong>in</strong>g state fund<strong>in</strong>g data.<br />
One of <strong>the</strong> significant outcomes of <strong>the</strong> new effort was <strong>the</strong> <strong>Fire</strong>Wise program. Sponsored by<br />
a consortium of federal agencies with a good deal of cooperator <strong>in</strong>volvement, this program was<br />
focused on <strong>in</strong>creas<strong>in</strong>g awareness of <strong>the</strong> Wildland/Urban Interface fire problem at <strong>the</strong> local level.<br />
A series of sem<strong>in</strong>ars has been held around <strong>the</strong> country to provide local plann<strong>in</strong>g and fire officials<br />
with <strong>the</strong> knowledge and tools, <strong>in</strong>clud<strong>in</strong>g educational materials, to better prepare <strong>the</strong>ir<br />
communities to cope with <strong>the</strong> threat of wildfire.<br />
Under <strong>the</strong> National <strong>Fire</strong> Plan, fund<strong>in</strong>g was made<br />
available to <strong>the</strong> federal wildfire agencies to <strong>in</strong>crease<br />
<strong>the</strong>ir fire suppression forces and to expand <strong>the</strong> scope of<br />
<strong>the</strong>ir fuel reductions projects. State <strong>Fire</strong> Assistance funds<br />
help state wildfire agencies improve <strong>the</strong>ir protection<br />
systems and are funneled to local communities as grants<br />
to support hazard reduction projects. Volunteer <strong>Fire</strong><br />
56
Assistance funds are routed to rural fire<br />
departments <strong>in</strong> <strong>the</strong> WUI to assist <strong>the</strong>m <strong>in</strong><br />
acquir<strong>in</strong>g equipment, safety gear, and<br />
tra<strong>in</strong><strong>in</strong>g to more effectively suppress<br />
wildfires and provide structure protection<br />
from encroach<strong>in</strong>g wildfires. Unfortunately,<br />
unless Congress acts to pass a supplemental<br />
appropriation, much of this fund<strong>in</strong>g may<br />
be siphoned off to pay for <strong>the</strong> high suppression<br />
costs <strong>in</strong>curred by <strong>the</strong> federal fire<br />
agencies dur<strong>in</strong>g <strong>Fire</strong> Season 2002.<br />
The National <strong>Fire</strong> Plan reflects <strong>the</strong><br />
views of a broad cross-section of government<br />
and non-government <strong>in</strong>terests. The<br />
participants recognize that <strong>the</strong> problem is<br />
complex and will not be solved soon. The hope is that <strong>the</strong> risks from wildland fire to our communities<br />
and environment can be dim<strong>in</strong>ished over time as we make progress <strong>in</strong> achiev<strong>in</strong>g<br />
def<strong>in</strong>ed objectives <strong>in</strong> a collaborative manner, as fund<strong>in</strong>g is made available from as many<br />
sources as possible.<br />
National <strong>Fire</strong> Plan Fund<strong>in</strong>g<br />
In order to get a full perspective of <strong>the</strong> National <strong>Fire</strong> Plan, you have to look at it from<br />
several po<strong>in</strong>ts of view. From <strong>the</strong> national po<strong>in</strong>t of view, it is a very big plan; a plan that has<br />
<strong>in</strong>fused much needed fund<strong>in</strong>g <strong>in</strong>to <strong>the</strong> federal wildland firefight<strong>in</strong>g agencies. From <strong>the</strong> state’s<br />
viewpo<strong>in</strong>t, <strong>the</strong> level of fund<strong>in</strong>g is significant, because it allows some activities that have never<br />
been funded before (Figure 13).<br />
The vast majority of <strong>the</strong> NFP dollars<br />
are for <strong>the</strong> federal agencies.<br />
Only three states noted significant<br />
improvement <strong>in</strong> <strong>the</strong> <strong>in</strong>itial attack<br />
capabilities of <strong>the</strong> federal agencies <strong>in</strong><br />
2002.<br />
It was known, right from <strong>the</strong> beg<strong>in</strong>n<strong>in</strong>g, that <strong>the</strong> funds would not last forever. In fact, <strong>the</strong><br />
fund<strong>in</strong>g was based on <strong>the</strong> 10-year plan. The estimated appropriation for FY 2003 is 29 percent<br />
less than <strong>the</strong> FY 2001 appropriation (Figure 14).<br />
57
National <strong>Fire</strong> Plan Fund<strong>in</strong>g<br />
(<strong>in</strong> thousands)<br />
Agency FY 2000 FY 2001 FY 2002<br />
FY 2003<br />
President's Budget<br />
FY 2004<br />
Request<br />
USDA Forest Service $1,035,125 $1,910,192 $1,590,712 $1,399,531 $1,572,203<br />
Deparment of Interior $490,957 $977,099 $678,421 $653,754 $698,725<br />
Total $1,526,082 $2,887,291 $2,269,133 $2,053,285 $2,270,928<br />
Figure 13. The National <strong>Fire</strong> Plan has <strong>in</strong>fused considerable fund<strong>in</strong>g <strong>in</strong> <strong>the</strong> federal wildland firefight<strong>in</strong>g<br />
agencies. Most of this fund<strong>in</strong>g will be expended by <strong>the</strong> federal agencies.<br />
There are several program areas with<strong>in</strong> <strong>the</strong> plan: preparedness, operations, emergency<br />
cont<strong>in</strong>gency, etc. Figure 15 provides a broad overview of how funds have been allocated to<br />
<strong>the</strong>se various programs. Note that <strong>the</strong> fund<strong>in</strong>g for <strong>the</strong> state programs falls under operations<br />
(highlighted and <strong>in</strong> bold italic pr<strong>in</strong>t).<br />
The state forestry agencies are<br />
allocated funds from <strong>the</strong> Community<br />
Assistant program.<br />
The percentage of <strong>the</strong> total National <strong>Fire</strong> Plan fund<strong>in</strong>g <strong>in</strong> <strong>the</strong> State <strong>Fire</strong> Assistance, Volunteer<br />
<strong>Fire</strong> Assistance and Rural <strong>Fire</strong> Assistance programs (for all 50 of <strong>the</strong> states) is less than 5<br />
percent of <strong>the</strong> total.<br />
In FY 2002 <strong>the</strong> federal<br />
$3,500,000<br />
agencies “chalked up” some very<br />
$3,000,000<br />
$2,500,000<br />
impressive accomplishments<br />
$2,000,000<br />
$1,500,000<br />
us<strong>in</strong>g <strong>the</strong> National <strong>Fire</strong> Plan<br />
$1,000,000<br />
$500,000<br />
allocations. Even though <strong>the</strong><br />
$0<br />
states do not adm<strong>in</strong>ister <strong>the</strong>se<br />
funds, <strong>the</strong>y do benefit <strong>the</strong> states <strong>in</strong><br />
<strong>the</strong> long run. Not directly, but<br />
<strong>the</strong>re is considerable benefit. For<br />
a complete report on <strong>the</strong> status of<br />
<strong>the</strong> National <strong>Fire</strong> Plan, review FY<br />
2002 Performance Report - National <strong>Fire</strong> Plan.<br />
(<strong>in</strong> thousands)<br />
National <strong>Fire</strong> Plan Fund<strong>in</strong>g<br />
FY 2000<br />
FY 2001<br />
FY 2002<br />
FY 2003<br />
President's<br />
Budget<br />
FY 2004<br />
Request<br />
Deparment of<br />
Interior<br />
USDA Forest<br />
Service<br />
Figure 14. The fund<strong>in</strong>g for <strong>the</strong> National <strong>Fire</strong> Plan is already<br />
show<strong>in</strong>g a decl<strong>in</strong>e. The appropriation for FY 2003 is 29% less<br />
than <strong>the</strong> peak.<br />
58
National <strong>Fire</strong> Plan Fund<strong>in</strong>g by Program<br />
(<strong>in</strong> thousands)<br />
FY 2000 FY 2001 FY 2002<br />
DOI FS Total DOI FS Total DOI FS Total<br />
Prepardedness $165,849 $408,768 $574,617 $314,712 $611,143 $925,855 $280,807 $622,618 $903,425<br />
Operations<br />
Suppression $58,068 $139,188 $197,256 $191,109 $319,324 $510,433 $161,424 $321,321 $482,745<br />
Hazardous Fuels Reduction $47,040 $70,000 $117,040 $194,971 $205,158 $400,129 $186,190 $209,010 $395,200<br />
Emergency Stabilization and<br />
Rehabilitation<br />
$20,000 $20,000 $66,769 $141,688 $208,457 $40,000 $62,668 $102,668<br />
<strong>Fire</strong> Facilities Backlog $43,903 $43,903 $20,376 $20,376<br />
Research and Development $15,965 $15,965 $27,265 $27,265<br />
Jo<strong>in</strong>t <strong>Fire</strong> Science $8,000 $8,000<br />
State <strong>Fire</strong> Assistance $23,929 $23,929 $77,828 $77,828 $81,693 $81,693<br />
Volunteer <strong>Fire</strong> Assistance $3,240 $3,240 $13,251 $13,251 $13,313 $13,315<br />
Rural <strong>Fire</strong> Assistance $9,978 $9,978 $10,000 $10,000<br />
Forest Health Management $11,974 $11,974 $11,974 $11,974<br />
Economic Action Program $12,472 $12,472 $12,472 $12,472<br />
Community and Private Lands<br />
Assistance<br />
$34,923 $34,923<br />
Subtotal Operations $125,108 $236,357 $361,465 $462,827 $876,486 $1,339,313 $397,614 $768,094 $1,165,708<br />
Total Non-Emergency $290,957 $936,082 $777,539 $1,487,629 $2,265,168 $678,421 $1,390,712 $2,069,133<br />
Emergency Cont<strong>in</strong>gency $200,000 $590,000 $199,560 $425,063 $624,623 $200,000 $200,000<br />
Agency Total $490,957 $1,526,082 $977,099 $1,912,692 $2,889,791 $678,421 $1,590,712 $2,269,133<br />
Figure 15. This is <strong>the</strong> breakdown of <strong>the</strong> fund<strong>in</strong>g levels for <strong>the</strong> various programs. The three highlighted programs <strong>in</strong> <strong>the</strong> middle of <strong>the</strong> chart are <strong>the</strong> programs for state and<br />
local fire agencies.<br />
Some of <strong>the</strong>se programs need a little explanation, because <strong>the</strong> head<strong>in</strong>g alone does not fully<br />
expla<strong>in</strong> its depth or true mean<strong>in</strong>g:<br />
• <strong>Fire</strong>fight<strong>in</strong>g - This is a major part of <strong>the</strong> National <strong>Fire</strong> Plan. It covers fire preparedness,<br />
work force plann<strong>in</strong>g and improvements, tra<strong>in</strong><strong>in</strong>g, facilities and equipment. It now also<br />
<strong>in</strong>cludes funds for “fire facilities backlog.”<br />
• Rehabilitation - This program <strong>in</strong>volves post-fire rehabilitation work after a wildfire that<br />
is unlikely to recover naturally. Some examples <strong>in</strong>volve reforestation, road and trail reha-<br />
59
ilitation, fence replacement, fish and wildlife habitat restoration, <strong>in</strong>vasive plant treatments,<br />
and replant<strong>in</strong>g and reseed<strong>in</strong>g with native or o<strong>the</strong>r desirable vegetation.<br />
State <strong>Fire</strong> Assistance is for <strong>the</strong><br />
states to use for preparedness and<br />
o<strong>the</strong>r programs.<br />
• Hazardous Fuels Reduction - There has been considerable report<strong>in</strong>g on how 100-years<br />
of “successful” fire suppression has not allowed natural fire to keep our forests clean. The<br />
funds provided are part of a long-term strategy to reduce <strong>the</strong> heavy fuel buildups on federal<br />
and adjacent lands. Some of <strong>the</strong> treatment methods used are prescribed fire, mechanical<br />
th<strong>in</strong>n<strong>in</strong>g, herbicides, graz<strong>in</strong>g, or a comb<strong>in</strong>ation of <strong>the</strong>m.<br />
Under this head<strong>in</strong>g you will also f<strong>in</strong>d fund<strong>in</strong>g for plann<strong>in</strong>g biomass utilization and forest<br />
health protection.<br />
• Community Assistance - Under this head<strong>in</strong>g, we f<strong>in</strong>d State <strong>Fire</strong> Assistance, Volunteer<br />
<strong>Fire</strong> Assistance, Rural <strong>Fire</strong> Assistance, <strong>Fire</strong>Wise Community Program, and Economic<br />
Action Programs. (See <strong>the</strong> next section <strong>in</strong> this report for a more complete explanation of<br />
<strong>the</strong>se very important programs.)<br />
• Research - Under this head<strong>in</strong>g, <strong>the</strong>re is full range of research projects that provide<br />
support for all of <strong>the</strong> programs listed before.<br />
Community Assistance Programs<br />
The states and rural volunteer fire departments have been <strong>the</strong> recipients of federal assistance<br />
for years. In some of <strong>the</strong> larger states, <strong>the</strong> amount has been a small percentage of <strong>the</strong>ir<br />
operat<strong>in</strong>g dollars, but <strong>in</strong> <strong>the</strong> smaller states, <strong>the</strong> federal grants are vital to <strong>the</strong> existence of <strong>the</strong><br />
“state forestry” operation.<br />
Under <strong>the</strong> National <strong>Fire</strong> Plan, <strong>the</strong> western states received over $74 million <strong>in</strong> FY 2002<br />
(Figure 16). All of <strong>the</strong>se funds come from <strong>the</strong> Community Assistance area of <strong>the</strong> USDA Forest<br />
Service budget and <strong>the</strong> Rural <strong>Fire</strong> Assistance budget for <strong>the</strong> Department of Interior.<br />
60
National <strong>Fire</strong> Plan Fund<strong>in</strong>g, by State<br />
Federal Grants for Fiscal Year 2002<br />
Base Fund<strong>in</strong>g (Formula)<br />
State <strong>Fire</strong> Assistance<br />
Competitive Grants<br />
Volunteer <strong>Fire</strong> Assistance Rural <strong>Fire</strong> Assistance TOTAL (2)<br />
Alaska $335,609 3.4% $895,391 3.9% $283,657 5.1% $96,628 1.2% $1,611,285 3.5%<br />
Arizona* $897,000 9.1% $2,221,500 9.7% $376,000 6.8% $455,750 5.7% $3,950,250 8.6%<br />
California* $1,000,210 10.1% $937,770 4.1% $954,072 17.3% $662,000 8.3% $3,554,052 7.7%<br />
Colorado* $994,304 10.1% $3,630,435 15.9% $669,643 12.2% $544,000 6.9% $5,838,382 12.7%<br />
Hawaii* $380,651 3.9% $115,480 0.5% $200,599 3.6% $15,000 0.2% $711,730 1.5%<br />
Idaho* $486,800 4.9% $3,530,700 15.5% $184,400 3.3% $935,575 11.8% $5,137,475 11.1%<br />
Kansas $495,000 5.0% $60,000 0.3% $181,000 3.3% $33,537 0.4% $769,537 1.7%<br />
Montana* $603,700 6.1% $1,140,067 5.0% $378,713 6.9% $854,030 10.8% $2,976,510 6.5%<br />
Nebraska* $467,100 4.7% $28,000 0.1% $143,000 2.6% $101,416 1.3% $739,516 1.6%<br />
Nevada* $307,000 3.1% $1,999,936 8.8% $157,681 2.9% $873,928 11.0% $3,338,545 7.2%<br />
New Mexico $72,500 0.7% $2,110,500 9.3% $193,300 3.5% $484,517 6.1% $2,860,817 6.2%<br />
North Dakota* $195,500 2.0% $0 0.0% $407,900 7.4% $228,597 2.9% $831,997 1.8%<br />
Oregon $1,041,395 10.6% $2,953,209 12.9% $416,390 7.6% $816,939 10.3% $5,227,933 11.3%<br />
South Dakota* $584,100 5.9% $346,000 1.5% $197,000 3.6% $222,000 2.8% $1,349,100 2.9%<br />
Utah* $381,134 3.9% $427,000 1.9% $229,229 4.2% $760,000 9.6% $1,797,363 3.9%<br />
Wash<strong>in</strong>gton $383,395 3.9% $1,490,000 6.5% $384,221 7.0% $385,226 4.9% $2,642,842 5.7%<br />
Wyom<strong>in</strong>g* $463,000 4.7% $846,602 3.7% $151,300 2.7% $466,456 5.9% $1,927,358 4.2%<br />
O<strong>the</strong>r(1) $766,300 $80,000 0.4% $0 $0 $846,300<br />
Total $9,854,698 $22,812,590 $5,508,105 $7,935,599 $46,110,992<br />
$32,667,288<br />
National Total $51,727,402<br />
$10,419,113 $9,942,744 $72,089,259<br />
Source: FY 2002 Performance Report - National <strong>Fire</strong> Plan, January 2003; * <strong>in</strong>dividual state records; (1) Guam and American Samoa, CNMI and o<strong>the</strong>r Pacific<br />
Islands; (2) Not all of <strong>the</strong>se funds are adm<strong>in</strong>istered by <strong>the</strong> State Forester.<br />
Figure 16. This is a breakdown by state, of <strong>the</strong> amounts given <strong>in</strong> 2002 from <strong>the</strong> National <strong>Fire</strong> Plan.<br />
61
State <strong>Fire</strong> Assistance - USDA Forest Service fund<strong>in</strong>g will provide for technical and<br />
f<strong>in</strong>ancial assistance to <strong>the</strong> states to enhance firefight<strong>in</strong>g capacity at <strong>the</strong> state and local levels.<br />
This fund<strong>in</strong>g also supports fire hazard mitigation projects <strong>in</strong> <strong>the</strong> wildland/urban <strong>in</strong>terface and<br />
will facilitate an expanded series of <strong>Fire</strong>Wise workshops to help communities across <strong>the</strong> country<br />
implement <strong>Fire</strong>Wise practices that reduce fire hazard. It will also support an expanded<br />
national public service fire prevention program (Figure 17).<br />
• Preparedness - Increases <strong>the</strong> ability of local, rural, and state organizations to provide<br />
coord<strong>in</strong>ated fire protection and mobilization for fire suppression on both federal and nonfederal<br />
lands.<br />
The big jump <strong>in</strong> State <strong>Fire</strong> Assistance<br />
is due to <strong>the</strong> <strong>in</strong>fusion of funds under<br />
<strong>the</strong> National <strong>Fire</strong> Plan competitive<br />
grants program.<br />
• Hazard Mitigation - Supports<br />
state-led hazard mitigation<br />
activities <strong>in</strong> <strong>the</strong> wildland/<br />
urban <strong>in</strong>terface, focused on<br />
reduc<strong>in</strong>g property loss, decreas<strong>in</strong>g<br />
fuels hazards, and <strong>in</strong>creas<strong>in</strong>g<br />
public awareness and<br />
citizen-driven solutions <strong>in</strong> rural<br />
communities.<br />
• <strong>Fire</strong> Prevention - Delivers a<br />
nationwide fire prevention<br />
program through public service<br />
advertis<strong>in</strong>g, educational activities,<br />
product licens<strong>in</strong>g, and<br />
corporate partnerships. The<br />
Smokey Bear program is part<br />
of this component, and <strong>Fire</strong>-<br />
Wise is ano<strong>the</strong>r prevention<br />
component. <strong>Fire</strong>Wise is a<br />
program that promotes wildland<br />
fire safety <strong>in</strong> <strong>the</strong> <strong>in</strong>terface<br />
and fosters community-based<br />
responsibility through adult<br />
State <strong>Fire</strong> Assistance Grants<br />
(<strong>in</strong> thousands)<br />
FY1998 FY1999 FY2000 FY2001 FY2002 Total<br />
Alaska $407 $367 $4,132 $11,881 $1,231 $18,018 21%<br />
Arizona $158 $174 $174 $1,584 $1,315 $3,405 4%<br />
California $309 $312 $487 $2,864 $1,923 $5,895 7%<br />
Colorado $448 $403 $442 $2,836 $4,625 $8,754 10%<br />
Hawaii $235 $235 $280 $451 $797 $1,998 2%<br />
Idaho $300 $314 $328 $2,540 $4,018 $7,500 9%<br />
Kansas $200 $200 $245 $515 $555 $1,715 2%<br />
Montana $378 $400 $424 $1,410 $1,869 $4,481 5%<br />
Nebraska $242 $242 $219 $446 $495 $1,644 2%<br />
Nevada $178 $185 $202 $1,058 $1,828 $3,451 4%<br />
New Mexico $165 $180 $231 $2,076 $2,183 $4,835 6%<br />
North Dakota $91 $95 $99 $281 $196 $762 1%<br />
Oregon $464 $507 $560 $2,072 $1,044 $4,647 5%<br />
South Dakota $270 $320 $313 $984 $930 $2,817 3%<br />
Utah $178 $185 $219 $3,130 $1,318 $5,030 6%<br />
Wash<strong>in</strong>gton $464 $507 $594 $3,518 $1,873 $6,956 8%<br />
Wyom<strong>in</strong>g $202 $209 $233 $1,335 $1,310 $3,289 4%<br />
Total $4,689 $4,835 $9,182 $38,981 $27,510 $85,197<br />
Source: USDA, Forest Service, WO<br />
Figure 17. The 5-year history of State <strong>Fire</strong> Assistance Grants to <strong>the</strong> states <strong>in</strong> <strong>the</strong> <strong>West</strong>.<br />
62
education, community action plann<strong>in</strong>g, fuel treatments, and landscap<strong>in</strong>g. Twenty-four<br />
<strong>Fire</strong>Wise workshops for community and bus<strong>in</strong>ess leaders have been conducted over <strong>the</strong><br />
last three-years. Participants will work to establish local <strong>Fire</strong>Wise standards to ensure a<br />
safer place for people to live. The first twelve workshops tra<strong>in</strong>ed 953 participants from<br />
425 communities and 45 states.<br />
Volunteer <strong>Fire</strong> Assistance - The Volunteer <strong>Fire</strong> Assistance Program, funded by <strong>the</strong> USDA<br />
Forest Service, provides funds through States to volunteer fire departments serv<strong>in</strong>g communities<br />
to improve communication capabilities, provide critical wildland fire management tra<strong>in</strong><strong>in</strong>g,<br />
Volunteer <strong>Fire</strong> Assistant Grants are<br />
adm<strong>in</strong>istered by <strong>the</strong> various State<br />
Foresters.<br />
Volunteer <strong>Fire</strong> Assistance Grants<br />
(<strong>in</strong> thousands)<br />
FY1998 FY1999 FY2000 FY2001 FY2002 Total<br />
Alaska $31 $44 $77 $394 $284 $830 7%<br />
Arizona $30 $30 $30 $335 $337 $762 6%<br />
California $70 $70 $70 $118 $959 $1,287 10%<br />
Colorado $38 $37 $61 $664 $648 $1,448 12%<br />
Hawaii $37 $37 $55 $200 $200 $529 4%<br />
Idaho $23 $23 $38 $345 $184 $613 5%<br />
Kansas $44 $44 $112 $180 $181 $561 4%<br />
Montana $40 $40 $65 $286 $379 $810 6%<br />
Nebraska $51 $51 $83 $142 $143 $470 4%<br />
Nevada $20 $20 $20 $193 $110 $363 3%<br />
New Mexico $23 $23 $45 $326 $190 $607 5%<br />
North Dakota $64 $64 $104 $336 $408 $976 8%<br />
Oregon $33 $33 $54 $407 $415 $942 8%<br />
South Dakota $35 $49 $79 $199 $181 $543 4%<br />
Utah $21 $21 $39 $194 $209 $484 4%<br />
Wash<strong>in</strong>gton $33 $33 $53 $407 $384 $910 7%<br />
Wyom<strong>in</strong>g $16 $16 $25 $140 $151 $348 3%<br />
Total $609 $635 $1,010 $4,866 $5,363 $12,483<br />
Source: USDA, Forest Service, WO<br />
Figure 18. The 5-year history of Volunteer <strong>Fire</strong> Assistance Grants for <strong>the</strong> states <strong>in</strong> <strong>the</strong> <strong>West</strong>. These grants are<br />
adm<strong>in</strong>istered by <strong>the</strong> State Foresters.<br />
63
and purchase protective fire<br />
cloth<strong>in</strong>g and equipment.<br />
These departments provide, at<br />
no cost, wildfire and emergency<br />
protection service to<br />
communities with populations<br />
of under 10,000. Volunteer<br />
<strong>Fire</strong> Departments provide<br />
services that reach 43% of <strong>the</strong><br />
population, at an estimated<br />
value of $36 billion per year<br />
(Figure 18).<br />
Rural <strong>Fire</strong> Assistance -<br />
Department of <strong>the</strong> Interior<br />
fund<strong>in</strong>g will be used to provide<br />
technical assistance,<br />
tra<strong>in</strong><strong>in</strong>g, supplies, equipment,<br />
and public education support<br />
to rural fire departments, thus<br />
enhanc<strong>in</strong>g firefighter safety<br />
and streng<strong>the</strong>n<strong>in</strong>g wildland<br />
fire protection capabilities<br />
(Figure 19).<br />
Federal Excess Property<br />
Program - Under <strong>the</strong> Federal<br />
Excess Personal Property<br />
Rural <strong>Fire</strong> Assistance Grants<br />
(<strong>in</strong> thousands)<br />
FY2001 FY2002 Total<br />
Alaska $75,867 $109,800 $185,667 1%<br />
Arizona $503,871 $509,000 $1,012,871 6%<br />
California $455,097 $662,000 $1,117,097 7%<br />
Colorado $684,254 $544,000 $1,228,254 8%<br />
Hawaii $25,389 $15,000 $40,389 0%<br />
Idaho $875,085 $867,000 $1,742,085 11%<br />
Kansas $23,364 $0 $23,364 0%<br />
Montana $861,556 $844,000 $1,705,556 11%<br />
Nebraska $102,985 $267,000 $369,985 2%<br />
Nevada $875,429 $865,000 $1,740,429 11%<br />
New Mexico $367,594 $499,000 $866,594 5%<br />
North Dakota $256,317 $0 $256,317 2%<br />
Oregon $751,238 $1,035,000 $1,786,238 11%<br />
South Dakota $296,411 $222,000 $518,411 3%<br />
Utah $765,620 $790,000 $1,555,620 10%<br />
Wash<strong>in</strong>gton $304,226 $790,000 $1,094,226 7%<br />
Wyom<strong>in</strong>g $433,284 $434,000 $867,284 5%<br />
O<strong>the</strong>r $0 $0 0%<br />
Total $7,657,587 $8,452,800 $16,110,387<br />
Figure 19. The Rural <strong>Fire</strong> Assistance Grant program is under <strong>the</strong><br />
various agencies <strong>in</strong> <strong>the</strong> Department of <strong>the</strong> Interior. Some of <strong>the</strong> grants<br />
are adm<strong>in</strong>istered by <strong>the</strong> agencies directly; some <strong>in</strong> coord<strong>in</strong>ation with<br />
<strong>the</strong> State Foresters.<br />
(FEPP) program, Federal property, orig<strong>in</strong>ally purchased for use by a Federal agency, but no<br />
longer needed by that entity, is acquired by <strong>the</strong> USDA Forest Service for loan to one of <strong>the</strong> 50<br />
States for use <strong>in</strong> <strong>the</strong> State’s rural or wildland fire protection program. As a result, <strong>the</strong> equipment<br />
stays <strong>in</strong> service to America, protect<strong>in</strong>g lives and property across <strong>the</strong> nation.<br />
64
The “personal” part of <strong>the</strong> FEPP program simply refers to any tangible property that is not<br />
real estate. This can <strong>in</strong>clude trucks, aircraft, personal protective equipment, motor oil, nuts,<br />
bolts, fire hose, et cetera, but not build<strong>in</strong>gs.<br />
The State Forester makes <strong>the</strong> <strong>in</strong>itial decision that an FEPP item is appropriate for use, and<br />
<strong>the</strong> USDA Forest Service must concur. The property is <strong>the</strong>n loaned to <strong>the</strong> State Forester, who<br />
may <strong>the</strong>n place it with local departments to improve local fire programs. Approximately 70% of<br />
<strong>the</strong> property <strong>in</strong>volved <strong>in</strong> <strong>the</strong> Forest Service FEPP program is sub-loaned to local fire departments<br />
(Figure 20).<br />
<strong>Fire</strong>Wise - The National <strong>Fire</strong> Plan has dedicated $5 million (FY 2001-2003) for development<br />
and delivery of <strong>the</strong> <strong>Fire</strong>Wise Program. Actually a suite of complementary programs,<br />
The Federal Excess Property Program<br />
has been <strong>in</strong>valuable for <strong>the</strong> states and<br />
rural fire departments.<br />
Federal Excess Property Program Acquisition, by State<br />
State FY 1996 FY 1997 FY 1998 FY 1999 FY 2000 5-year Total 5-year Average<br />
Alaska $472,689 $1,132,986 $1,804,555 $1,176,223 $4,586,454 $917,291<br />
Arizona $306,676 $541,210 $231,693 $479,612 $1,559,191 $311,838<br />
California $29,740,724 $10,103,896 $26,425,137 $19,104,371 $7,527,042 $92,901,169 $18,580,234<br />
Colorado $770,471 $570,910 $350,224 $1,505,652 $104,561 $3,301,818 $660,364<br />
Hawaii $77,717 $489,785 $684,193 $1,251,695 $250,339<br />
Idaho $1,395,417 $2,115,519 $897,966 $373,926 $1,828,383 $6,611,212 $1,322,242<br />
Kansas $1,983,801 $1,353,692 $181,622 $450,728 $5,585,378 $9,555,221 $1,911,044<br />
Montana $1,433,422 $7,256,509 $2,081,025 $476,441 $4,448,824 $15,696,221 $3,139,244<br />
Nebraska $896,080 $680,035 $217,002 $1,972,794 $3,765,911 $753,182<br />
Nevada $1,725,782 $542,918 $1,292,185 $162,466 $3,723,352 $744,670<br />
New Mexico $465,902 $362,556 $763,884 $695,499 $377,019 $2,664,861 $532,972<br />
North Dakota $559,836 $178,682 $660,359 $94,825 $118,727 $1,612,429 $322,486<br />
Oregon $3,414,282 $4,406,797 $3,883,436 $1,649,154 $1,098,415 $14,452,084 $2,890,417<br />
South Dakota $30,888 $1,116,019 $2,910,912 $78,033 $100,753 $4,236,605 $847,321<br />
Utah $1,641,095 $623,966 $662,857 $1,249,855 $523,243 $4,701,017 $940,203<br />
Wash<strong>in</strong>gton $4,016,167 $5,849,680 $6,528,742 $3,150,722 $2,715,446 $22,260,757 $4,452,151<br />
Wyom<strong>in</strong>g $500 $686,280 $342,712 $247,679 $625,158 $1,902,329 $380,466<br />
Guam and o<strong>the</strong>r<br />
Pacific Islands $241,833 $62,835 $124,168 $37,664 $466,500 $93,300<br />
Total $49,173,282 $37,584,493 $49,017,309 $31,246,530 $28,227,212 $195,248,825 $39,049,765<br />
Figure 20. The value of FEPP to <strong>the</strong> states and rural fire departments cannot really be measured. This is a<br />
historical picture of <strong>the</strong> value of <strong>the</strong> materials loaned to <strong>the</strong> states <strong>in</strong> <strong>the</strong> <strong>West</strong>.<br />
65
<strong>Fire</strong>Wise is aimed at <strong>in</strong>form<strong>in</strong>g <strong>the</strong> community spectrum - homeowners, firefighters and builders<br />
to landscapers, <strong>in</strong>surance agents and public officials - about <strong>the</strong> concept of <strong>Fire</strong>Wise liv<strong>in</strong>g.<br />
Program components <strong>in</strong>clude <strong>the</strong> follow<strong>in</strong>g:<br />
• <strong>Fire</strong>Wise Website (www.<strong>Fire</strong>Wise.org): Represent<strong>in</strong>g a successful partnership of private<br />
and government agencies, this site averages 150,000 hits a month.<br />
<strong>Fire</strong>Wise is one of <strong>the</strong> National <strong>Fire</strong><br />
Plan programs that has <strong>the</strong> potential<br />
for long-term impacts.<br />
• Communication Tools such as publications and videos: <strong>Fire</strong>Wise concepts on landscap<strong>in</strong>g,<br />
build<strong>in</strong>g, firefighter safety and o<strong>the</strong>r topics are available onl<strong>in</strong>e as well as through<br />
o<strong>the</strong>r outlets. The latest project is a television documentary called “Keepers of <strong>the</strong> Flame,”<br />
which puts America’s fire history and wildland/urban <strong>in</strong>terface fire problem <strong>in</strong> context.<br />
• Workshops, Tra<strong>in</strong><strong>in</strong>g Sessions and Demonstration Events: These activities are focused<br />
on reduc<strong>in</strong>g fire risk to property and lives through better community design and retrofit,<br />
and preparedness plann<strong>in</strong>g.<br />
• Technical Assistance to Communities: As <strong>Fire</strong>Wise spreads across<br />
<strong>the</strong> country, more communities are look<strong>in</strong>g to program organizers for<br />
help. This component <strong>in</strong>cludes ArcView mapp<strong>in</strong>g technology.<br />
• <strong>Fire</strong>Wise Communities USA Recognition Program: Communities<br />
can earn national status for <strong>the</strong>ir work to improve plann<strong>in</strong>g for mitigation<br />
of fire hazards. Currently, <strong>the</strong>re are 11 geographically diverse pilot<br />
communities <strong>in</strong> <strong>the</strong> recognition program, which will be officially<br />
unveiled <strong>in</strong> late 2003. Nationwide, <strong>the</strong>re are thousands of communities<br />
with wildland/urban <strong>in</strong>terface areas.<br />
<strong>Fire</strong>Wise Communities Workshop Series - Launched <strong>in</strong> <strong>the</strong> fall of 1999,<br />
<strong>the</strong> <strong>Fire</strong>Wise Communities Workshop Series is an <strong>in</strong>tegral part of <strong>the</strong> <strong>Fire</strong>Wise Program. With<br />
more than 30 stakeholder groups – federal agencies, national organizations and private companies<br />
as sponsors – <strong>the</strong> series offers more than two-dozen national workshops across <strong>the</strong> country<br />
through 2003. Invited to each are <strong>the</strong> people who can truly <strong>in</strong>fluence <strong>the</strong> way an area is planned,<br />
built, ma<strong>in</strong>ta<strong>in</strong>ed and protected. To date, 953 community stakeholders from 425 communities<br />
<strong>in</strong> 45 states have attended <strong>the</strong>se regionally based workshops. By project’s end, more than 2,000<br />
community leaders will have participated. Ano<strong>the</strong>r 2,500 are expected to attend <strong>the</strong> sp<strong>in</strong>-off<br />
66
workshops that are occurr<strong>in</strong>g (50+ to date) <strong>in</strong> <strong>the</strong> states host<strong>in</strong>g national workshops. National<br />
participants are provided with a wealth of <strong>Fire</strong>Wise material, <strong>in</strong>clud<strong>in</strong>g <strong>the</strong> computer-aided<br />
workshop exercise that allows <strong>the</strong>se leaders to talk <strong>in</strong> small groups about <strong>the</strong> complexities of<br />
creat<strong>in</strong>g a <strong>Fire</strong>Wise Community. For more <strong>in</strong>formation about <strong>the</strong> series, visit <strong>the</strong> <strong>Fire</strong>Wise<br />
Communities website at www.<strong>Fire</strong>Wise.org/communities.<br />
Thousands of people have a better<br />
understand<strong>in</strong>g of <strong>the</strong> wildland/urban<br />
<strong>in</strong>terface fire problem after attend<strong>in</strong>g<br />
a <strong>Fire</strong>Wise workshop.<br />
67
Competitive Grants<br />
The National <strong>Fire</strong> Plan funded fuel reduction programs for areas that were classified as<br />
be<strong>in</strong>g <strong>in</strong> <strong>the</strong> wildland/urban <strong>in</strong>terface. As a means to get <strong>the</strong>se funds to <strong>the</strong> states, <strong>the</strong> USDA<br />
Forest Service decided to use an exist<strong>in</strong>g mechanism, that of <strong>the</strong> State <strong>Fire</strong> Assistance grants.<br />
The competitive grants program has<br />
been an important step at reduc<strong>in</strong>g<br />
<strong>the</strong> wildland/urban <strong>in</strong>terface problem.<br />
At least <strong>in</strong> <strong>the</strong> short term.<br />
Historically, <strong>the</strong> USDA Forest Service used a formula to allocate <strong>the</strong> funds to <strong>the</strong> states, so<br />
as <strong>the</strong> annual allocation moved up or down, each of <strong>the</strong> states was treated equally. Every once <strong>in</strong><br />
a while, a member of Congress was able to place special rules that dictated a special allocation;<br />
<strong>the</strong> most recent one was an augmentation to <strong>the</strong> State of Alaska related to bug kill on <strong>the</strong> Kenni<br />
Pen<strong>in</strong>sula.<br />
to:<br />
To facilitate <strong>the</strong> allocation for <strong>the</strong> wildland/urban <strong>in</strong>terface grants, <strong>the</strong> rules were changed<br />
• Allocate 25% of <strong>the</strong> State <strong>Fire</strong> Assistance allocation to <strong>the</strong> states us<strong>in</strong>g <strong>the</strong> formula. This<br />
provided funds at a similar level as <strong>in</strong> <strong>the</strong> past. It should be noted here, that <strong>the</strong> percentage<br />
for <strong>the</strong> formula allocations will jump to 35% <strong>in</strong> federal fiscal year 2003. This was done to<br />
allow <strong>the</strong> states to have more discretionary authority on how <strong>the</strong> funds could be used.<br />
• The rema<strong>in</strong><strong>in</strong>g funds were <strong>the</strong>n allocated on a competitive basis. Each state would<br />
provide a list of projects that <strong>the</strong>y would like to conduct, us<strong>in</strong>g <strong>the</strong>se funds.<br />
The Council of <strong>West</strong>ern State Foresters gave <strong>the</strong> responsibility of develop<strong>in</strong>g <strong>the</strong> list of<br />
qualify<strong>in</strong>g projects to <strong>the</strong>ir fire managers. A subcommittee of <strong>the</strong> <strong>West</strong>ern State <strong>Fire</strong> Managers<br />
<strong>the</strong>n would meet, review<strong>in</strong>g <strong>the</strong> hundreds of applications to determ<strong>in</strong>e if <strong>the</strong>y met <strong>the</strong> requirements,<br />
<strong>the</strong>ir completeness, etc. A list of projects was <strong>the</strong>n prepared and submitted to <strong>the</strong> Council<br />
for approval and submission to <strong>the</strong> USDA Forest Service.<br />
The legislation allowed funds to be expended on several types of projects. They <strong>in</strong>cluded:<br />
• Hazardous Fuel Reduction - Fuel reduction projects and vegetation treatments have<br />
been identified as a means of mitigat<strong>in</strong>g wildfire hazards. Projects of this type <strong>in</strong>cluded<br />
fuel breaks, th<strong>in</strong>n<strong>in</strong>g, prun<strong>in</strong>g, landscape modifications, etc.<br />
68
• Information and Education - In <strong>the</strong> wildland/urban <strong>in</strong>terface homeowners and local<br />
government should bear much of <strong>the</strong> responsibility for improv<strong>in</strong>g <strong>the</strong> defensibility of<br />
homes and o<strong>the</strong>r build<strong>in</strong>gs. The plan was to develop programs that would help educate <strong>the</strong><br />
general public and local government officials on what has to be done to provide a permanent<br />
“fix” to this problem. Some qualify<strong>in</strong>g projects would <strong>in</strong>clude <strong>Fire</strong>Wise or similar<br />
projects, defensible space around homes and structures, shaded fuel breaks, fuels reduction<br />
beyond defensible space, etc.<br />
• Homeowner and Community Actions - Creat<strong>in</strong>g conditions <strong>in</strong> and round <strong>in</strong>dividual<br />
structures and communities that would limit <strong>the</strong> “transmission” of fire between <strong>the</strong> wildland<br />
and <strong>the</strong> structures. These types of projects could <strong>in</strong>clude safety <strong>in</strong>spections, demonstration<br />
projects, tra<strong>in</strong><strong>in</strong>g and education for homeowners, planners and fire service personnel,<br />
etc.<br />
• Plann<strong>in</strong>g and/or Assessment Projects - These projects identify values <strong>in</strong> <strong>the</strong> wildland/<br />
urban <strong>in</strong>terface that are important to protect. Qualify<strong>in</strong>g projects could <strong>in</strong>clude county or<br />
community plann<strong>in</strong>g, hazard fuel mapp<strong>in</strong>g projects, etc.<br />
• Monitor<strong>in</strong>g - These projects generally would document <strong>the</strong> status of <strong>the</strong> projects listed<br />
above.<br />
There were several projects that were submitted, but automatically rejected. Some of <strong>the</strong><br />
more common examples are: <strong>the</strong> purchase of fire equipment and apparatus, start up fund<strong>in</strong>g of a<br />
small bus<strong>in</strong>ess, research and development, and fire preparedness and suppression capacity<br />
build<strong>in</strong>g.<br />
Information and education has <strong>the</strong><br />
greatest long-term impacts.<br />
The most common NFP projects:<br />
• Public Education<br />
• Fuel Breaks<br />
• Mechanical Th<strong>in</strong>n<strong>in</strong>g<br />
• Defensible Space<br />
As with most competitive grant programs, <strong>the</strong> f<strong>in</strong>al success is based on several factions. In<br />
this case, <strong>the</strong>se were some of <strong>the</strong> <strong>in</strong>fluences:<br />
• Availability of Funds - Congress did not appropriate <strong>the</strong> funds needed to complete all of<br />
<strong>the</strong> desired projects.<br />
• Application was rejected because it was not complete, not on time or for a project that<br />
did not qualify.<br />
• Higher priority projects available.<br />
69
Communities at Risk<br />
S<strong>in</strong>ce <strong>the</strong> National <strong>Fire</strong> Plan sets a priority for action on <strong>the</strong> protection of communities,<br />
such communities have to be identified.<br />
At least 22,000 communities <strong>in</strong> <strong>the</strong><br />
nation are considered to be <strong>in</strong> <strong>the</strong><br />
wildland/urban <strong>in</strong>terface.<br />
The wildland/urban <strong>in</strong>terface occurs where human structures (e.g., homes, bus<strong>in</strong>esses,<br />
agricultural build<strong>in</strong>gs, recreational facilities) meet or <strong>in</strong>termix with wildland vegetation. At<br />
times <strong>the</strong> wildland vegetation may pose a fire hazard because of its flammability or an unusually<br />
high accumulation of plant material or fuel. The accumulation of wildland fuel around and<br />
with<strong>in</strong> communities <strong>in</strong> <strong>the</strong> wildland/urban <strong>in</strong>terface poses a significant fire hazard.<br />
Most states completed <strong>the</strong> standardized process or a comparable<br />
process for identify<strong>in</strong>g communities at risk, and 11,376 communities<br />
were identified <strong>in</strong> <strong>the</strong> vic<strong>in</strong>ity of federal lands. The first attempt to<br />
identify <strong>the</strong> communities at risk was published <strong>in</strong> <strong>the</strong> Federal Register <strong>in</strong><br />
August 2001.<br />
States and tribes submitted names of 22,127 communities, which<br />
<strong>in</strong>cluded communities <strong>in</strong> <strong>the</strong> vic<strong>in</strong>ity of lands managed by <strong>the</strong> Departments<br />
of Agriculture and <strong>the</strong> Interior and communities <strong>in</strong> <strong>the</strong> vic<strong>in</strong>ity of<br />
state and o<strong>the</strong>r lands. For those <strong>in</strong> <strong>the</strong> vic<strong>in</strong>ity of federal lands, 1,864<br />
communities have projects planned near <strong>the</strong>m. Additional fund<strong>in</strong>g is<br />
necessary to make an impact on <strong>the</strong> rema<strong>in</strong><strong>in</strong>g communities. Most communities submitted by<br />
<strong>the</strong> states and tribes are eligible for funds appropriated to State & Private <strong>Forestry</strong> programs<br />
with<strong>in</strong> <strong>the</strong> Forest Service, regardless of <strong>the</strong> communities’ relationship to federal lands.<br />
The revised list offers several <strong>in</strong>sights <strong>in</strong>to <strong>the</strong> national scope of <strong>the</strong> wildland/urban <strong>in</strong>terface<br />
communities. This <strong>in</strong>formation better illustrates <strong>the</strong> relationship between federal lands and<br />
<strong>the</strong> <strong>in</strong>terface problem <strong>in</strong> <strong>the</strong> United States. This list will provide an important tool for use at <strong>the</strong><br />
state level to focus attention on vulnerable areas, and to aid state and federal agencies <strong>in</strong> collaborative<br />
efforts to work <strong>in</strong> areas of local importance and where opportunities are most conducive<br />
to reduc<strong>in</strong>g risks on a mean<strong>in</strong>gful scale. Because a number of communities submitted by<br />
<strong>the</strong> states are not published here, it must NOT be assumed that <strong>the</strong> list portrays a complete<br />
national picture of <strong>the</strong> wildland/urban <strong>in</strong>terface areas at risk for all land ownerships.<br />
70
The <strong>in</strong>formation conta<strong>in</strong>ed <strong>in</strong> <strong>the</strong> revised list helps <strong>in</strong>teragency groups of land managers at<br />
<strong>the</strong> state and/or tribal level to collaboratively identify priority areas with<strong>in</strong> <strong>the</strong>ir jurisdictions<br />
that would benefit from hazard reduction projects. The revised list offered an opportunity to<br />
partner with states and tribes, which is a central feature of <strong>the</strong> National <strong>Fire</strong> Plan.<br />
Develop<strong>in</strong>g relationships with partners has resulted <strong>in</strong> more comprehensive <strong>in</strong>formation<br />
that better reflects <strong>the</strong> relationship between federal lands and <strong>the</strong> <strong>in</strong>terface problem <strong>in</strong> <strong>the</strong><br />
United States. This collaborative effort to identify communities at risk from wildfire has more<br />
clearly demonstrated <strong>the</strong> wildland/urban <strong>in</strong>terface problem across <strong>the</strong> United States. In many<br />
states, this process fostered important steps <strong>in</strong> federal, state, and local cooperation to identify<br />
areas of concern and planned actions. Many states will cont<strong>in</strong>ue <strong>the</strong> collaborative process with<br />
federal agencies and tribes, to better focus hazard mitigation efforts and set priorities for communities<br />
at <strong>the</strong> state and local level. Work<strong>in</strong>g toge<strong>the</strong>r is a long-term <strong>in</strong>vestment, and <strong>the</strong> list<strong>in</strong>g<br />
process was just one of many jo<strong>in</strong>t projects. Project implementation will <strong>in</strong>volve federal land<br />
management agencies, state foresters, tribes, and communities <strong>in</strong> plann<strong>in</strong>g and implement<strong>in</strong>g<br />
wildfire hazard/risk reduction projects, carry<strong>in</strong>g out <strong>Fire</strong>Wise projects, and identify<strong>in</strong>g local<br />
contractors for th<strong>in</strong>n<strong>in</strong>g, reforestation, or o<strong>the</strong>r National <strong>Fire</strong> Plan projects.<br />
Dur<strong>in</strong>g <strong>the</strong> list<strong>in</strong>g process, <strong>the</strong>re were several concerns raised by <strong>the</strong> states about <strong>the</strong><br />
process. The FY 2001 Appropriations Act for <strong>the</strong> Department of <strong>the</strong> Interior and Related Agencies<br />
requires only <strong>the</strong> list<strong>in</strong>g of communities <strong>in</strong> <strong>the</strong> vic<strong>in</strong>ity of federal lands. List<strong>in</strong>g only those<br />
communities does not adequately portray <strong>the</strong> extent and complexity of <strong>the</strong> issue. Wildland/<br />
urban <strong>in</strong>terface issues need to be dealt with on a state level basis, not just <strong>in</strong> <strong>the</strong> vic<strong>in</strong>ity of<br />
federal lands. Great concern has been noted on how <strong>the</strong> list will be used. There are concerns<br />
that <strong>the</strong> list will be used to allocate funds and firefight<strong>in</strong>g resources without regard to o<strong>the</strong>r<br />
factors – this is untrue. There is a perception that complet<strong>in</strong>g a project <strong>in</strong> <strong>the</strong> vic<strong>in</strong>ity of a<br />
community at risk will fully mitigate <strong>the</strong> hazard. Hazard mitigation for many communities will<br />
require significant effort through multiple projects, and must be an ongo<strong>in</strong>g multi-year process.<br />
Identify<strong>in</strong>g and prioritiz<strong>in</strong>g<br />
communities at risk is a collaborative<br />
process.<br />
Six states had NFP projects that<br />
were impacted by wildfire <strong>in</strong> 2002.<br />
Dur<strong>in</strong>g <strong>the</strong> 2000 fire season wildfires burned millions of acres throughout <strong>the</strong> United<br />
States. These fires dramatically illustrated <strong>the</strong> threat to human lives and development. Under<br />
Executive Order, <strong>the</strong> National <strong>Fire</strong> Plan was created as a cooperative, long-term effort of <strong>the</strong><br />
USDA Forest Service, Department of <strong>the</strong> Interior, and <strong>the</strong> National Association of State Foresters,<br />
to protect communities and restore ecological health on Federal lands.<br />
71
A major component of <strong>the</strong> National <strong>Fire</strong> Plan was fund<strong>in</strong>g for projects designed to<br />
reduce fire risks to people and <strong>the</strong>ir property. A fundamental step <strong>in</strong> realiz<strong>in</strong>g this goal was <strong>the</strong><br />
identification of areas that are at high risk of damage from wildfire. Federal fire managers<br />
authorized State Foresters to determ<strong>in</strong>e which communities were under significant risk from<br />
wildland fire on Federal lands.<br />
Identify<strong>in</strong>g <strong>the</strong> communities at risk is<br />
a state responsibility.<br />
A Better Def<strong>in</strong>ition<br />
The <strong>Fire</strong> Committee of <strong>the</strong> National Association of State Foresters did not like <strong>the</strong><br />
process of how communities at risk were identified. They started to develop a new and more<br />
mean<strong>in</strong>gful def<strong>in</strong>ition of what a community at risk really was. S<strong>in</strong>ce California has been deal<strong>in</strong>g<br />
with this issue for over 40 years, <strong>the</strong>y asked <strong>the</strong> State Forester to work on this issue.<br />
The California Department of <strong>Forestry</strong> and <strong>Fire</strong> Protection (CDF) undertook <strong>the</strong> task of<br />
generat<strong>in</strong>g <strong>the</strong> state’s list of communities at risk. With California’s extensive wildland-urban<br />
<strong>in</strong>terface situation <strong>the</strong> list of communities extends well beyond just those on federal lands.<br />
Three ma<strong>in</strong> factors were used to determ<strong>in</strong>e wildland fire threat areas of California:<br />
11 states undertook cooperative<br />
projects with o<strong>the</strong>r agencies.<br />
• Rank<strong>in</strong>g Fuel Hazards - rank<strong>in</strong>g vegetation types by <strong>the</strong>ir potential fire behavior dur<strong>in</strong>g<br />
a wildfire. The fuels are what br<strong>in</strong>gs <strong>the</strong> fire to <strong>the</strong> structure. Some are more hazardous<br />
than o<strong>the</strong>rs.<br />
• Assess<strong>in</strong>g <strong>the</strong> Probability of <strong>Fire</strong> - <strong>the</strong> annual likelihood that a large damag<strong>in</strong>g wildfire<br />
would occur <strong>in</strong> a particular vegetation type. There are places <strong>in</strong> <strong>the</strong> nation where homes<br />
have existed <strong>in</strong> <strong>the</strong> wildlands and have never been threatened by a wildland fire. Conversely,<br />
<strong>the</strong>re are homes <strong>in</strong> some areas, like Sou<strong>the</strong>rn California, where certa<strong>in</strong> home sites<br />
have been destroyed several times <strong>in</strong> <strong>the</strong> last twenty years.<br />
• Def<strong>in</strong><strong>in</strong>g Areas of Suitable Hous<strong>in</strong>g Density that Would Create Wildland/Urban<br />
Interface <strong>Fire</strong> Protection Strategy Situations - areas of <strong>in</strong>term<strong>in</strong>gled wildland fuels and<br />
urban environments that are <strong>in</strong> <strong>the</strong> vic<strong>in</strong>ity of fire threats.<br />
The <strong>Fire</strong>-Threatened Communities <strong>in</strong> California list <strong>in</strong>cludes a total of 1,283 communities. Of<br />
those, 843 are adjacent to federal lands (USDA Forest Service, Bureau of Land Management,<br />
72
Department of Defense, etc.) and are <strong>in</strong>dicated as such<br />
with an “F” <strong>in</strong> <strong>the</strong> Fed. Threat column. The Hazard<br />
Level Code <strong>in</strong>cluded on <strong>the</strong> list designates a<br />
community’s fire threat<br />
level with three <strong>in</strong>dicat<strong>in</strong>g<br />
<strong>the</strong> highest threat. The<br />
adoption of a mean<strong>in</strong>gful<br />
def<strong>in</strong>ition of “communities<br />
at risk” is paramount.<br />
Unless all of <strong>the</strong> states<br />
adopt a uniform def<strong>in</strong>ition,<br />
<strong>the</strong>y run <strong>the</strong> risk of los<strong>in</strong>g<br />
fund<strong>in</strong>g from <strong>the</strong> National<br />
level.<br />
One of <strong>the</strong> problems confront<strong>in</strong>g <strong>the</strong> various state and federal<br />
agencies is that, once identified, how do you go about tak<strong>in</strong>g a<br />
community “off <strong>the</strong> list.” The reality is that very few communities at<br />
risk will ever be “protected” to <strong>the</strong> po<strong>in</strong>t that <strong>the</strong>y are no longer at<br />
risk. The actions taken to date are short term fixes at best. Fuel<br />
reduction work is only as good as <strong>the</strong><br />
cont<strong>in</strong>ued ma<strong>in</strong>tenance. Solutions to<br />
<strong>the</strong> problem are long term and require<br />
that homes be<strong>in</strong>g constructed<br />
be resistant to ignition. “Steel<br />
homes” like this one are not practical,<br />
but <strong>the</strong>re are th<strong>in</strong>gs that can be<br />
done to decrease <strong>the</strong> odds of a house<br />
becom<strong>in</strong>g a statistic. <strong>Fire</strong>Wise and<br />
build<strong>in</strong>g code regulations are <strong>the</strong> long<br />
term solution.<br />
73
A Community at Risk - Flagstaff, Arizona<br />
One of <strong>the</strong> features of <strong>the</strong> National <strong>Fire</strong> Plan process has been <strong>the</strong> creation of a list of all<br />
<strong>the</strong> “communities at risk” <strong>in</strong> <strong>the</strong> wildland/urban <strong>in</strong>terface adjacent to federal lands. This list<br />
now totals some 11,376 communities, many of which are political additions where wildfire risk<br />
is really m<strong>in</strong>imal. If <strong>the</strong>re ever was a large community that meets <strong>the</strong> orig<strong>in</strong>al <strong>in</strong>tent of compil<strong>in</strong>g<br />
such a list, Flagstaff is it.<br />
Located at an elevation of almost 7,000 feet, Flagstaff sits at <strong>the</strong> base of <strong>the</strong> scenic San<br />
Francisco Peaks, which tower more than a mile above <strong>the</strong> city skyl<strong>in</strong>e. With a population of<br />
53,000 Flagstaff is a grow<strong>in</strong>g, vibrant community that sits at <strong>the</strong> <strong>in</strong>tersection of Interstates 40<br />
and 17, close enough to <strong>the</strong> Grand Canyon to reap <strong>the</strong> economic benefits of <strong>the</strong> tourist traffic, as<br />
well as <strong>the</strong> urban conundrum of too much traffic. Home to Nor<strong>the</strong>rn Arizona University, which<br />
has a strong forestry school and is home to Ecological Restoration Institute, <strong>the</strong> community has<br />
a strong environmental conscience and great appreciation for <strong>the</strong> natural beauty and resources<br />
surround<strong>in</strong>g it. This community<br />
already had several significant<br />
forest stewardship and fire<br />
hazard reduction projects go<strong>in</strong>g,<br />
and was well positioned to take<br />
full advantage of new fund<strong>in</strong>g<br />
available from <strong>the</strong> National <strong>Fire</strong><br />
Plan.<br />
Flagstaff is a classic wildland/urban<br />
<strong>in</strong>terface community.<br />
<strong>Fire</strong> History<br />
Nestled <strong>in</strong> <strong>the</strong> Ponderosa<br />
P<strong>in</strong>e forest, Flagstaff is practically<br />
surrounded by wildlands.<br />
The drought and bugs have killed<br />
a high percentage of <strong>the</strong> forests<br />
<strong>in</strong> this area (Figure 21). The<br />
Kaibab National Forest to <strong>the</strong><br />
north and west spreads toward<br />
<strong>the</strong> Grand Canyon. The<br />
Figure 21. 25 to 30 percent of <strong>the</strong> p<strong>in</strong>e trees around Flagstaff are dead<br />
due to drought and bugs.<br />
75
Cocon<strong>in</strong>o National Forest surrounds <strong>the</strong> city. Several parcels of state forest lands border <strong>the</strong><br />
southwest side of town, <strong>in</strong>termixed with Forest Service and private lands <strong>in</strong> <strong>the</strong> familiar checkerboard<br />
pattern so common <strong>in</strong> <strong>the</strong> <strong>West</strong>. These public lands, which constitute a fire-dependent<br />
ecosystem, have a long and colorful fire history which has been well documented and studied.<br />
The Radio <strong>Fire</strong> burned <strong>in</strong> June 1977.<br />
For many residents of Flagstaff, modern fire history began with <strong>the</strong> Radio <strong>Fire</strong> <strong>in</strong> June of<br />
1977, which burned across <strong>the</strong> south face of Mount Elden, just to <strong>the</strong> north of <strong>the</strong> City, leav<strong>in</strong>g<br />
many residents with a viewshed composed primarily of white tree skeletons. Started by a<br />
runaway teenager’s escaped campfire, <strong>the</strong> Radio <strong>Fire</strong> frustrated <strong>the</strong> efforts of <strong>the</strong> <strong>in</strong>itial attack<br />
fire forces by leap<strong>in</strong>g <strong>in</strong>to <strong>the</strong> tops of <strong>the</strong> p<strong>in</strong>e trees and roar<strong>in</strong>g up <strong>the</strong> mounta<strong>in</strong> <strong>in</strong> a matter of a<br />
few m<strong>in</strong>utes as a nearly cont<strong>in</strong>uous crown fire. The FS lookout tower on Mount Elden was<br />
hastily abandoned, and <strong>the</strong> fire burned down <strong>the</strong> telephone l<strong>in</strong>es to <strong>the</strong> mounta<strong>in</strong>top radio<br />
facilities, creat<strong>in</strong>g communications problems for <strong>the</strong> fire suppression forces. Some homes were<br />
threatened and <strong>the</strong>re were some precautionary evacuations. A similar fire today would threaten<br />
many more homes.<br />
The Radio <strong>Fire</strong> burned so hot that it completely transformed <strong>the</strong> landscape from p<strong>in</strong>e with<br />
oak on <strong>the</strong> south and east slopes to only brush and scrub oak today. Soil damage and microclimate<br />
changes have prevented <strong>the</strong> ponderosa p<strong>in</strong>e from com<strong>in</strong>g back on much of that fire site.<br />
Both <strong>the</strong> forest that burned, and <strong>the</strong> brush fields that have replaced it are very different from <strong>the</strong><br />
historical p<strong>in</strong>e forest of <strong>the</strong> Southwest. The presettlement ponderosa p<strong>in</strong>e forest probably had<br />
10-12 very large trees per acre, many 500 years old or older. The forest that burned <strong>in</strong> 1977,<br />
follow<strong>in</strong>g years of logg<strong>in</strong>g and fire suppression, probably had 150-200 trees per acre, with a<br />
heavy component of dead litter on <strong>the</strong> forest floor.<br />
This condition is typical of today, and <strong>the</strong> result is that fires now burn more <strong>in</strong>tensely, are<br />
harder to put out, and do more damage than <strong>the</strong> fires of old. In <strong>the</strong> 1950’s <strong>the</strong> average annual<br />
burn <strong>in</strong> <strong>the</strong> Forest Service’s Southwest Region was about 38,000 acres. By <strong>the</strong> 1990’s <strong>the</strong><br />
annual average had <strong>in</strong>creased to 112,000 acres. In 2002, one wildfire burned four times that<br />
much acreage. Around Flagstaff, <strong>the</strong> major fires have gotten bigger each decade also. In <strong>the</strong><br />
1950’s, <strong>the</strong> biggest fire was less than 2,000 acres. By <strong>the</strong> 1970’s, fires were rang<strong>in</strong>g from 3,500<br />
to 7,000 acres. In <strong>the</strong> 1990’s, fires of 8,000 to 16,000 acres had become <strong>the</strong> norm.<br />
76
The Wildland/Urban Interface<br />
Arizona is one of <strong>the</strong> fastest grow<strong>in</strong>g states <strong>in</strong> <strong>the</strong> nation, as many refugees from <strong>the</strong> snow<br />
country move to <strong>the</strong> desert for <strong>the</strong>ir retirement years. Increas<strong>in</strong>g home values allow more<br />
residents of <strong>the</strong> desert to move to or build summer homes <strong>in</strong> <strong>the</strong> mounta<strong>in</strong>s, where summer<br />
days, and especially nights, are cooler. As Flagstaff cont<strong>in</strong>ues to grow, with new subdivisions<br />
w<strong>in</strong>d<strong>in</strong>g through <strong>the</strong> trees <strong>in</strong> every direction, <strong>the</strong> wildland/urban <strong>in</strong>terface cont<strong>in</strong>ues to grow<br />
(180,000 acres), and to become<br />
more complex (Figure 22).<br />
This <strong>in</strong>terface does not just<br />
extend 60 or 100 feet from <strong>the</strong><br />
last house, but really extends for<br />
miles across jurisdictional and<br />
property boundaries, mak<strong>in</strong>g <strong>the</strong><br />
“values at risk” from wildfire<br />
values that are shared by <strong>the</strong><br />
entire community. Some of <strong>the</strong><br />
values that could be affected by a<br />
major fire <strong>in</strong> <strong>the</strong> Flagstaff area<br />
<strong>in</strong>clude: public health, recreation,<br />
water, wildlife, real estate<br />
and personal property, scenic and<br />
economic values, as well as <strong>the</strong><br />
emotional and spiritual health of<br />
<strong>the</strong> entire community. A serious<br />
wildfire could destroy <strong>the</strong> vitality<br />
and strangle <strong>the</strong> growth of this<br />
vibrant community.<br />
Community Partnership Seeks<br />
Forest Health<br />
The Greater Flagstaff<br />
Forests Partnership<br />
(www.gffp.org) is an alliance of<br />
23 academic, environmental,<br />
Figure 22. This map shows partnership areas <strong>in</strong> <strong>the</strong> Flagstaff,<br />
Arizona area.<br />
77<br />
Community Partnerships are<br />
important.<br />
www.gffp.org
us<strong>in</strong>ess, and government organizations <strong>in</strong> <strong>the</strong> community that is dedicated to test<strong>in</strong>g and<br />
adapt<strong>in</strong>g new approaches to restor<strong>in</strong>g forest ecosystem health <strong>in</strong> <strong>the</strong> Flagstaff area. Its goals<br />
<strong>in</strong>clude restor<strong>in</strong>g natural ecosystem composition, structure, and function to <strong>the</strong> ponderosa p<strong>in</strong>e<br />
forests; manag<strong>in</strong>g forest fuels to reduce <strong>the</strong> potential for catastrophic wildfire; and to study and<br />
document <strong>the</strong> key ecological, economic, and social dimensions of forest health restoration<br />
efforts.<br />
Flagstaff facts:<br />
180,000 acres <strong>in</strong> wildland/urban<br />
<strong>in</strong>terface;<br />
5,400 acres th<strong>in</strong>ned;<br />
2,250 acres burned;<br />
7,000 acres planned;<br />
11,000 acres under study; and<br />
68 research projects.<br />
Key elements of <strong>the</strong> Greater Flagstaff Forest Partnership <strong>in</strong>clude:<br />
• A framework for restor<strong>in</strong>g forest ecosystems<br />
• A strong scientific foundation for all activities<br />
• Test<strong>in</strong>g a variety of approaches<br />
• Extensive research and monitor<strong>in</strong>g<br />
The partnership has seven<br />
major forest restoration projects<br />
underway <strong>in</strong> <strong>the</strong> greater Flagstaff<br />
area follow<strong>in</strong>g a n<strong>in</strong>eteen-month<br />
delay as <strong>the</strong> result of litigation<br />
(Figure 23). Th<strong>in</strong>n<strong>in</strong>g of trees <strong>in</strong><br />
<strong>the</strong> overstocked wildland/urban<br />
<strong>in</strong>terface is one of <strong>the</strong> top fire<br />
hazard reduction priorities, with<br />
11 different types of treatment<br />
be<strong>in</strong>g utilized. By 2002, some<br />
1,900 acres of FS land and 3,500<br />
acres of city and state lands have<br />
been th<strong>in</strong>ned. Prescribed burn<strong>in</strong>g<br />
has been accomplished on 1,750<br />
acres of city, state, and private<br />
lands, as well as ano<strong>the</strong>r 500<br />
acres of FS land. Some 7,000<br />
Figure 23. The National <strong>Fire</strong> Plan funded this cooperative operation<br />
to reduce <strong>the</strong> fire hazard.<br />
78
acres <strong>in</strong> <strong>the</strong> community are be<strong>in</strong>g <strong>in</strong>tensively managed for forest health restoration. Environmental<br />
analysis on an additional 24,000 acres has identified about 11,000 acres of additional<br />
potential treatment area. There are 68 different research projects underway with<strong>in</strong> <strong>the</strong> partnership,<br />
many under <strong>the</strong> umbrella of <strong>the</strong> Ecological Restoration Institute. The partnership has<br />
recently published a reference guide to all <strong>the</strong> various research projects to encourage <strong>in</strong>formation<br />
shar<strong>in</strong>g among various discipl<strong>in</strong>es.<br />
The projects cover a wide range of topics and ideas <strong>in</strong> addition to just fire hazard reduction.<br />
Included are such activities as determ<strong>in</strong><strong>in</strong>g <strong>the</strong> economic feasibility of utiliz<strong>in</strong>g <strong>the</strong> small<br />
diameter p<strong>in</strong>es trees that must be harvested for such th<strong>in</strong>gs as elk exclusion fences to protect<br />
spr<strong>in</strong>gs and streams while riparian vegetation regrows, or, as fuel for a biomass electric power<br />
plant.<br />
A State <strong>Fire</strong> Assistance Grant got<br />
Flagstaff started.<br />
Federal Funds Helpful<br />
The Greater Flagstaff Forests Partnership received a $45,000 grant of State <strong>Fire</strong> Assistance<br />
funds from <strong>the</strong> Arizona State Land Department (ASLD) for <strong>the</strong> plann<strong>in</strong>g and public education<br />
parts of <strong>the</strong> start-up process that were so critical to develop<strong>in</strong>g a framework for forest health<br />
restoration that enjoys broad public support.<br />
State <strong>Fire</strong> Assistance funds have also enabled <strong>the</strong> ASLD <strong>Fire</strong> Management Division to<br />
cont<strong>in</strong>ue to be an important contributor to <strong>the</strong> success of <strong>the</strong> forest health restoration efforts <strong>in</strong><br />
Flagstaff, despite <strong>the</strong> current climate of state budget cuts and hir<strong>in</strong>g freezes.<br />
National <strong>Fire</strong> Plan funds enable <strong>the</strong> fund<strong>in</strong>g of hazard reduction and prescribed fire crews<br />
of <strong>the</strong> ASLD, Cocon<strong>in</strong>o NF, and Flagstaff <strong>Fire</strong> Department (FFD) which work cooperatively to<br />
accomplish projects that l<strong>in</strong>k across ownership boundaries to achieve strategic fire hazard<br />
reduction goals. NFP funds enable hazard reduction projects to take place on private ownerships<br />
that may not o<strong>the</strong>rwise be able to afford to do <strong>the</strong> work and which could become weak l<strong>in</strong>ks <strong>in</strong><br />
<strong>the</strong> cha<strong>in</strong> of fire hazard reduction projects.<br />
Grant funds enabled <strong>the</strong> acquisition of <strong>the</strong> pole peeler used to make th<strong>in</strong>ned small diameter<br />
p<strong>in</strong>e trees <strong>in</strong>to poles for <strong>the</strong> elk exclusion fence that protects a restored spr<strong>in</strong>g at Fort Tuthill<br />
County Park, one of <strong>the</strong> cooperators <strong>in</strong> <strong>the</strong> partnership and a useful public education demonstration<br />
area (Figure 24).<br />
79
Corporate and community service<br />
clubs can provide valuable assistance.<br />
Corporate sponsorships,<br />
community service club donations,<br />
public donations, and<br />
private property landowner<br />
efforts have all been leveraged to<br />
accomplish much more than any<br />
one agency could ever undertake.<br />
Throughout <strong>the</strong> community,<br />
significant progress is be<strong>in</strong>g<br />
made to restore forest health,<br />
reduce <strong>the</strong> potential for catastrophic<br />
fires, and make <strong>the</strong><br />
greater Flagstaff area a better<br />
place to live, now and <strong>in</strong> <strong>the</strong><br />
future.<br />
Figure 24. Federal match<strong>in</strong>g funds were used to reduce <strong>the</strong> fuel<br />
load<strong>in</strong>g hazard and construct this elk fence.<br />
Urban Watershed at Risk – Denver<br />
The Hayman <strong>Fire</strong>, a man-caused forest fire, ravaged much of <strong>the</strong> critical South Platte River<br />
watershed, <strong>the</strong> source of as much as 80% of <strong>the</strong> water for <strong>the</strong> rapidly grow<strong>in</strong>g Denver metropolitan<br />
area. Comb<strong>in</strong>ed with a cont<strong>in</strong>u<strong>in</strong>g serious drought <strong>in</strong> <strong>the</strong> Rocky Mounta<strong>in</strong> Front Range,<br />
<strong>the</strong> loss of thousands of acres of forest could force major water conservation measures, especially<br />
if high <strong>in</strong>tensity ra<strong>in</strong>s cause heavy siltation <strong>in</strong> Cheesman Reservoir.<br />
Cheesman Reserve is a critical watershed southwest of Denver that <strong>in</strong>cludes Cheesman<br />
and Strontia Spr<strong>in</strong>gs reservoirs on <strong>the</strong> South Platte River. Besides be<strong>in</strong>g a primary water source<br />
for a major urban area, <strong>the</strong> forests of <strong>the</strong> reserve were also an important recreation resource for<br />
many urban residents. The South Platte River is a blue-ribbon trout stream and <strong>the</strong> reservoirs<br />
are magnets for fisherman. Hikers, hunters, and o<strong>the</strong>rs have used <strong>the</strong> forests of <strong>the</strong> reserve for<br />
decades (Figure 25).<br />
80
Denver Water, <strong>in</strong> cooperation<br />
with <strong>the</strong> Colorado State Forest<br />
Service (CSFS) has managed <strong>the</strong><br />
land as a multiple use forest, with<br />
water production and quality be<strong>in</strong>g<br />
<strong>the</strong> primary concern. The agencies<br />
had developed a comprehensive<br />
plan to treat <strong>the</strong> watershed to<br />
reduce fuel load<strong>in</strong>g and improve<br />
forest health. Several areas had<br />
been treated and more projects<br />
were on <strong>the</strong> schedule.<br />
Unfortunately, <strong>the</strong> Hayman<br />
<strong>Fire</strong> burned under conditions of<br />
severe drought, heavy fuel load<strong>in</strong>g,<br />
and high fire danger sweep<strong>in</strong>g<br />
Figure 25. Th<strong>in</strong>ned and burned p<strong>in</strong>e forest <strong>in</strong> Colorado.<br />
across most of <strong>the</strong> watershed as a crown fire, result<strong>in</strong>g <strong>in</strong> severe fire damage to <strong>the</strong> forest. For miles<br />
upon end, no tree, bush, or blade of grass survived <strong>the</strong> conflagration of 2002. In <strong>the</strong> critical<br />
Cheesman Reservoir area, <strong>the</strong> only green p<strong>in</strong>e trees left after <strong>the</strong> passage of <strong>the</strong> wildfire across<br />
thousands of acres of p<strong>in</strong>e forest were <strong>in</strong> a narrow band around <strong>the</strong> edge of <strong>the</strong> reservoir where<br />
vegetation had been th<strong>in</strong>ned to enhance recreation, <strong>in</strong> <strong>the</strong> area burned by a previous forest fire <strong>in</strong> <strong>the</strong><br />
60’s, and <strong>in</strong> <strong>the</strong> area of a fuel reduction project funded <strong>in</strong> part by a NFP grant. The vast majority of<br />
<strong>the</strong> forest looks like a nuclear wasteland (Figure 26).<br />
The Hayman <strong>Fire</strong> damaged <strong>the</strong> Denver<br />
watershed for years.<br />
The predom<strong>in</strong>ant soil type <strong>in</strong> <strong>the</strong> area is decomposed granite, which is very coarse and unstable.<br />
On steep slopes denuded of vegetative cover this soil erodes readily. Even after light summer ra<strong>in</strong><br />
showers, ash flows choked <strong>in</strong>termittent streams and mud flows overran temporary erosion barriers<br />
hastily placed by Denver Water. The agency has spent millions of dollars <strong>in</strong> post fire rehabilitation<br />
efforts to try to m<strong>in</strong>imize erosion and subsequent sedimentation of <strong>the</strong> reservoirs, but much of this<br />
effort could be <strong>in</strong>effective <strong>in</strong> <strong>the</strong> face of an <strong>in</strong>tense w<strong>in</strong>ter/spr<strong>in</strong>g ra<strong>in</strong>storm. The potential exists for<br />
mudflows to cause so much silt to flow <strong>in</strong> to Cheesman Reservoir that <strong>the</strong> <strong>in</strong>takes for <strong>the</strong> water<br />
system could be covered over and <strong>the</strong> water system rendered <strong>in</strong>operable. Even without heavy ra<strong>in</strong>s<br />
this first w<strong>in</strong>ter, fire damage to <strong>the</strong> soil surface is so severe <strong>in</strong> many areas and so few seed sources<br />
rema<strong>in</strong> that effectively reforest<strong>in</strong>g this critical watershed will take many years and be very<br />
expensive (Figure 27).<br />
81
Many communities rely on surface<br />
water supplies.<br />
Seven states reported major fires <strong>in</strong><br />
critial urban watersheds <strong>in</strong> 2002.<br />
This is but one of hundreds<br />
of urban water supplies that are<br />
at risk <strong>in</strong> <strong>the</strong> wildland-urban<br />
<strong>in</strong>terface, especially <strong>in</strong> <strong>the</strong> <strong>West</strong>.<br />
Many communities rely on<br />
surface storage <strong>in</strong> reservoirs<br />
located <strong>in</strong> nearby watersheds for<br />
most of <strong>the</strong>ir domestic water.<br />
Dur<strong>in</strong>g drought conditions,<br />
<strong>in</strong>flow to <strong>the</strong> reservoirs is reduced<br />
while at <strong>the</strong> same time <strong>the</strong><br />
fire danger <strong>in</strong> <strong>the</strong> surround<strong>in</strong>g<br />
watershed <strong>in</strong>creases. Wildfires<br />
can destroy <strong>the</strong> vegetative cover<br />
<strong>in</strong> whole watersheds, produc<strong>in</strong>g a<br />
fire-flood sequence of events that<br />
result <strong>in</strong> <strong>in</strong>creased siltation of <strong>the</strong><br />
reservoirs, pollution of <strong>the</strong> water<br />
supply, and <strong>in</strong> severe cases, <strong>the</strong><br />
destruction of <strong>the</strong> whole water<br />
system.<br />
The Hayman <strong>Fire</strong> and its<br />
impact on <strong>the</strong> Denver water<br />
system are worth look<strong>in</strong>g at as<br />
harb<strong>in</strong>gers of what many communities<br />
may face as <strong>the</strong> wildfire<br />
problem <strong>in</strong> <strong>the</strong> wildland-urban<br />
<strong>in</strong>terface escalates and water<br />
shortages proliferate <strong>in</strong> <strong>the</strong> <strong>West</strong>.<br />
Figure 26. The Hayman <strong>Fire</strong> burn area.<br />
82<br />
Figure 27. Straw bale check dams <strong>in</strong> Hayman <strong>Fire</strong> above reservoir.
The Hayman <strong>Fire</strong><br />
<strong>Fire</strong> conditions along <strong>the</strong> Rocky Mounta<strong>in</strong> Front Range <strong>in</strong> Colorado <strong>in</strong> <strong>the</strong> summer of 2002<br />
were as bad as or worse than at any time <strong>in</strong> recorded climatological data. A meager w<strong>in</strong>ter snow<br />
pack <strong>in</strong> <strong>the</strong> mounta<strong>in</strong>s was followed by <strong>the</strong> failure of <strong>the</strong> summer “monsoon” ra<strong>in</strong> pattern to<br />
develop over <strong>the</strong> Southwest. By summer, <strong>the</strong> drought conditions were fifty percent worse than<br />
<strong>the</strong> historic worst drought conditions, which occurred <strong>in</strong> 1851. The fuel moisture <strong>in</strong> hundredhour<br />
fuels on <strong>the</strong> Pike-San Isabel National Forests was measured at 9 percent. At this stage of<br />
drought, even large old trees have lost <strong>the</strong>ir ability to resist fire and whole forests are subject to<br />
stand-replac<strong>in</strong>g wildfires.<br />
The Hayman <strong>Fire</strong> started on June 8, 2002 at 1600 hours near a campground on <strong>the</strong> Pike<br />
National Forest. It was a human-caused fire, set by a U.S. Forest Service employee us<strong>in</strong>g a<br />
paper torch. The fire spread immediately and rapidly out of <strong>the</strong> campground, despite early<br />
detection and report<strong>in</strong>g, and despite an aggressive <strong>in</strong>itial attack (Figure 28).<br />
By now a rag<strong>in</strong>g <strong>in</strong>ferno, <strong>the</strong> Hayman <strong>Fire</strong> raced through five miles of <strong>the</strong> Cheesman<br />
Reserve <strong>in</strong> less than 1½ hours,<br />
sometimes reach<strong>in</strong>g speeds of up<br />
to 85 miles per hour. Of <strong>the</strong><br />
8,200 acres burned on <strong>the</strong> reserve,<br />
more than half (4,594<br />
acres) burned at high <strong>in</strong>tensity,<br />
kill<strong>in</strong>g all vegetative cover and<br />
severely damag<strong>in</strong>g <strong>the</strong> surface<br />
soil layer. Only 206 acres of <strong>the</strong><br />
reserve escaped <strong>the</strong> effects of <strong>the</strong><br />
fire.<br />
Hayman <strong>Fire</strong> facts:<br />
137,760 acres;<br />
133 homes lost;<br />
466 o<strong>the</strong>r structures lost;<br />
$40 million to suppress; and<br />
$36 million rehab costs.<br />
The fire was not conta<strong>in</strong>ed<br />
until July 2, 2002 after burn<strong>in</strong>g<br />
137,760 acres of Ponderosa P<strong>in</strong>e<br />
and mixed conifer forest <strong>in</strong> four<br />
Colorado counties. It was not<br />
declared under control until July<br />
18, 2002. The Hayman <strong>Fire</strong>, <strong>the</strong><br />
Figure 28. The Hayman <strong>Fire</strong> burned over 137,000 acres <strong>in</strong> four<br />
counties of Colorado.<br />
83
Figure 29. The rehabilitation cost $36 million. Note that <strong>the</strong> greatest burn severity was <strong>in</strong> <strong>the</strong> north,<br />
<strong>in</strong> <strong>the</strong> Denver watershed.<br />
largest wildfire <strong>in</strong> Colorado history, destroyed 133 residences, 466 outbuild<strong>in</strong>gs, and one commercial<br />
build<strong>in</strong>g and cost more than $40 million to suppress. Additional millions have and are<br />
be<strong>in</strong>g spent on burned area emergency rehabilitation and to prevent damage to Denver’s water<br />
system facilities (Figures 29 and 30).<br />
84<br />
The Ponderosa P<strong>in</strong>e Forest<br />
The ecosystems and landscape of <strong>the</strong> Front<br />
Range have changed considerably over <strong>the</strong> last 150<br />
years, as <strong>the</strong> <strong>in</strong>fluences of a variety of human activities<br />
have taken effect. Large wildfires and epidemics<br />
of <strong>in</strong>sect and disease damages are becom<strong>in</strong>g more<br />
common. Logg<strong>in</strong>g, overgraz<strong>in</strong>g, and fire exclusion<br />
have resulted <strong>in</strong> younger, denser forests with thick<br />
undergrowth which makes <strong>the</strong> forest more susceptible<br />
to catastrophic wildfires.<br />
The forest is a liv<strong>in</strong>g community of species<br />
where trees are dom<strong>in</strong>ant. Ponderosa is <strong>the</strong> most<br />
widely distributed p<strong>in</strong>e <strong>in</strong> <strong>the</strong> US and can adapt to a<br />
wide range of ecological conditions. It frequently<br />
starts to appear at <strong>the</strong> transition from hotter, drier<br />
grass and brush lands to cooler, moisture climates<br />
and ranges from California to <strong>the</strong> Dakotas. Ponderosa<br />
P<strong>in</strong>e communities exist throughout <strong>the</strong> Colorado<br />
Front Range at elevations from 5,000 to 9,000 feet.<br />
At lower elevations Ponderosa is frequently <strong>the</strong> only<br />
conifer present, but at higher elevations or <strong>in</strong> moist<br />
canyons o<strong>the</strong>r species such as Lodgepole P<strong>in</strong>e,<br />
Douglas Fir, and Quak<strong>in</strong>g Aspen may be found<br />
<strong>in</strong>termixed with <strong>the</strong> Ponderosa P<strong>in</strong>es. The Ponderosa P<strong>in</strong>e forest supports a great variety of<br />
plant and animal species, some of which are now classified as rare, threatened, or endangered.<br />
The Ponderosa P<strong>in</strong>e forests of <strong>the</strong> mid 1800’s consisted of fewer, larger trees spaced some<br />
distance apart. Recent research suggests that <strong>the</strong> crown closure <strong>in</strong> <strong>the</strong> mature forest was only<br />
about 30 percent and that 25-40 percent of <strong>the</strong> forest was open meadows. Fairly frequent low-
<strong>in</strong>tensity forest fires reduced ground litter build-up, released soil<br />
nutrients bound <strong>in</strong> vegetation, destroyed compet<strong>in</strong>g vegetation, prevented<br />
<strong>in</strong>trusion by undesirable species, and lessened <strong>the</strong> chance of<br />
epidemic disease and <strong>in</strong>sect outbreaks. <strong>Fire</strong>s occurred regularly, but<br />
were not able to climb <strong>in</strong>to <strong>the</strong> crowns due to lack of ladder fuels <strong>in</strong><br />
<strong>the</strong> understory. Due to <strong>the</strong> lack of crown closure, fires seldom spread<br />
across whole stands of trees as crown fires.<br />
The Ponderosa P<strong>in</strong>e forests began to be heavily logged <strong>in</strong> <strong>the</strong> late<br />
1800’s, with <strong>the</strong> majority of <strong>the</strong> large, mature p<strong>in</strong>es be<strong>in</strong>g taken for<br />
lumber. Rema<strong>in</strong><strong>in</strong>g slash was broadcast burned, add<strong>in</strong>g to <strong>the</strong> site<br />
disturbance created by logg<strong>in</strong>g. Dur<strong>in</strong>g <strong>the</strong> early 1900’s (and especially<br />
<strong>in</strong> 1910 dur<strong>in</strong>g <strong>the</strong> “Big Blow-up”), vast areas of western forests<br />
were ravaged by catastrophic wildfires feed<strong>in</strong>g on <strong>the</strong> slash left by<br />
<strong>in</strong>discrim<strong>in</strong>ate logg<strong>in</strong>g. These conflagrations created a demand for<br />
<strong>in</strong>creased fire protection, lead<strong>in</strong>g eventually to <strong>the</strong> 10 a.m. conta<strong>in</strong>ment<br />
policy that dom<strong>in</strong>ated fire protection philosophy for much of <strong>the</strong><br />
1900’s. Fewer fires were allowed to burn <strong>in</strong> <strong>the</strong> forests, and <strong>the</strong><br />
forests grew denser.<br />
In <strong>the</strong> pre-settlement forest, fires<br />
seldom spread across whole stands<br />
as crown fires.<br />
Much forest land <strong>in</strong> <strong>the</strong> <strong>West</strong> is<br />
overcrowded, undermanaged, and<br />
overprotected.<br />
These sites disturbed by logg<strong>in</strong>g or fire became seedbeds that<br />
supported large numbers of new p<strong>in</strong>e seedl<strong>in</strong>gs. In areas where not<br />
enough seed trees were left, <strong>the</strong> soil also was ready to support large<br />
numbers of o<strong>the</strong>r species, frequently brush and less-desirable hardwood<br />
tree species. The second generation forest that grew back was<br />
more diverse and much more crowded. This second generation forest<br />
was also little managed until <strong>the</strong> supply of old growth timber began to<br />
run low. By <strong>the</strong> 1980’s much of <strong>the</strong> forest land <strong>in</strong> <strong>the</strong> <strong>West</strong> was<br />
overcrowded, undermanaged, and overprotected.<br />
At <strong>the</strong> same time <strong>the</strong> forest was gett<strong>in</strong>g thicker, so were people.<br />
The population of <strong>the</strong> <strong>West</strong> cont<strong>in</strong>ued to <strong>in</strong>crease dramatically, with<br />
new homes and communities push<strong>in</strong>g constantly onto what used to be<br />
forest lands. This juxtaposition of man’s structures and <strong>the</strong> forest has<br />
come to be known as <strong>the</strong> “Wildland/Urban Interface” and it is <strong>the</strong><br />
85
primary concern of fire protection experts <strong>in</strong> <strong>the</strong> new millennium. Each<br />
year, somewhere <strong>in</strong> <strong>the</strong> <strong>West</strong>, large wildfires threaten or destroy hundreds<br />
of structures, and sometimes even whole towns. The <strong>in</strong>creas<strong>in</strong>g population<br />
has also generated greater demands for protection of <strong>the</strong> environment,<br />
result<strong>in</strong>g <strong>in</strong> a sharp decl<strong>in</strong>e <strong>in</strong> logg<strong>in</strong>g and greatly <strong>in</strong>creased costs for<br />
lumber. Today, many compet<strong>in</strong>g, and frequently conflict<strong>in</strong>g, special<br />
<strong>in</strong>terest groups make manag<strong>in</strong>g <strong>the</strong> wildlands extremely complicated. Our<br />
litigious society has made it more difficult to use prescribed fire without<br />
some form of protection from liability, limit<strong>in</strong>g our capability to restore<br />
<strong>the</strong> forest to a healthy condition. Too many voices clamor for <strong>the</strong> protection<br />
of a favorite species at <strong>the</strong> expense of <strong>the</strong> health of <strong>the</strong> total ecosystem.<br />
Much work is needed to restore forest health, a condition which will<br />
benefit most species, <strong>in</strong>clud<strong>in</strong>g human be<strong>in</strong>gs, <strong>in</strong> <strong>the</strong> long run. A healthy<br />
forest provides wood, water, wildlife, and recreation. A decadent forest<br />
provides <strong>in</strong>creased opportunity for devastat<strong>in</strong>g wildfires.<br />
Protect<strong>in</strong>g Watersheds<br />
The Colorado State Forest Service (CSFS), Denver Water Board, and<br />
<strong>the</strong> U.S. Forest Service have formed a partnership to protect and restore<br />
threatened forest watersheds along <strong>the</strong> South Platte River. Several locations<br />
have been identified as be<strong>in</strong>g at high risk for catastrophic losses from<br />
fire, <strong>in</strong>sects, or disease. Projects have been designed and funded to restore<br />
forest health, <strong>in</strong>clud<strong>in</strong>g a demonstration site at Trumbull. This area was<br />
carefully harvested (logged) dur<strong>in</strong>g <strong>the</strong> w<strong>in</strong>ter of 2000/2001 to achieve<br />
several objectives: recreate natural open<strong>in</strong>gs, encourage new plant growth<br />
<strong>in</strong> browse species for deer and elk, create grassy meadows with wildflowers<br />
used by a R&E butterfly, create uneven-aged timber stands that are<br />
more resistant to <strong>in</strong>sect and disease epidemics, <strong>in</strong>crease <strong>the</strong> diversity of<br />
plant species, and reduce <strong>the</strong> potential for high <strong>in</strong>tensity wildfires (Figure<br />
31).<br />
Figure 30. The Hayman <strong>Fire</strong> burned over 137,000 acres; most of it <strong>in</strong> <strong>the</strong> Denver<br />
watershed.<br />
This effort is a start toward reduc<strong>in</strong>g <strong>the</strong> potential for large, damag<strong>in</strong>g<br />
wildfires such as <strong>the</strong> Buffalo Creek <strong>Fire</strong> of 1996, which although it only<br />
86
urned 12,000 acres and only destroyed about a dozen homes, had disastrous consequences for<br />
<strong>the</strong> watershed. In <strong>the</strong> two years follow<strong>in</strong>g this fire, <strong>the</strong> watershed experienced 13 so-called<br />
“100-year flood” events, result<strong>in</strong>g <strong>in</strong> massive erosion, siltation of streams, and recurr<strong>in</strong>g damage<br />
to water system facilities cost<strong>in</strong>g federal, state, and local taxpayers millions of dollars to<br />
repair.<br />
Unfortunately, <strong>the</strong> Hayman <strong>Fire</strong> occurred before very much of <strong>the</strong> landscape at risk could<br />
receive treatment. The Hayman <strong>Fire</strong> did burn <strong>in</strong>to <strong>the</strong> area of <strong>the</strong> Polhemus prescribed burn<br />
conducted <strong>in</strong> <strong>the</strong> fall of 2001.<br />
Unfortunately, <strong>the</strong> prescribed fire<br />
did not burn hot enough to<br />
substantially reduce <strong>the</strong> presence<br />
of ladder fuels, and thus did not<br />
significantly reduce <strong>the</strong> <strong>in</strong>tensity<br />
of <strong>the</strong> Hayman <strong>Fire</strong>. The<br />
Hayman <strong>Fire</strong> also ran <strong>in</strong>to <strong>the</strong><br />
area burned by <strong>the</strong> Schoonover<br />
<strong>Fire</strong> <strong>the</strong> previous month, which<br />
split <strong>the</strong> head of <strong>the</strong> fire, compound<strong>in</strong>g<br />
suppression difficulties.<br />
These events re<strong>in</strong>force <strong>the</strong><br />
need to assure that fuel modification<br />
projects are properly designed,<br />
situated, and executed to<br />
achieve strategic goals.<br />
Figure 31. Th<strong>in</strong>ned and burned p<strong>in</strong>e forest <strong>in</strong> Colorado.<br />
The Forest Service and<br />
Denver Water have already spent millions of dollars <strong>in</strong> rehabilitation of <strong>the</strong> burned area and <strong>in</strong><br />
measures designed to m<strong>in</strong>imize erosion and siltation of <strong>the</strong> reservoir. Much more money will<br />
have to be spent to reforest <strong>the</strong> watershed, with salvage logg<strong>in</strong>g of <strong>the</strong> burned timber provid<strong>in</strong>g<br />
little cost offset. Even without a major flood situation, <strong>the</strong> cost of <strong>the</strong> Hayman <strong>Fire</strong> to <strong>the</strong><br />
people of <strong>the</strong> Denver area will cont<strong>in</strong>ue to <strong>in</strong>crease <strong>in</strong> <strong>the</strong> com<strong>in</strong>g years. In <strong>the</strong> event a major<br />
(or multiple serious) flood occurs, a significant portion of <strong>the</strong> Denver water system is at risk of<br />
damage or destruction.<br />
87
Who Really Benefits From Watershed <strong>Fire</strong> Protection<br />
In <strong>the</strong> arid <strong>West</strong>, water is a valuable commodity. So valuable that local, state, and federal<br />
governments all heavily subsidize <strong>the</strong> development, transportation, distribution, and treatment<br />
of water. A variety of users benefit from <strong>the</strong> complex system of reservoirs, canals, and pipel<strong>in</strong>es<br />
that move water from <strong>the</strong> mounta<strong>in</strong> watersheds to developed areas.<br />
Nearly everybody benefits from<br />
watershed fire protection.<br />
The majority of <strong>the</strong> water <strong>in</strong> <strong>the</strong> <strong>West</strong> is used by agriculture for <strong>the</strong> production of food and<br />
fiber. Vast areas of arid land grow multiple crops dur<strong>in</strong>g long grow<strong>in</strong>g seasons, us<strong>in</strong>g 137<br />
billion gallons of water a day. Farm animals and aquaculture (fish farm<strong>in</strong>g) account for only<br />
about 3% of <strong>the</strong> total agricultural water demand. Power plants use 130 billion gallons a day, not<br />
count<strong>in</strong>g <strong>the</strong> billions more gallons used by hydroelectric plants, <strong>the</strong>n returned to streams. Industry<br />
uses 36 billion gallons a day; commercial users account for ano<strong>the</strong>r 8 billion gallons. A<br />
typical U.S. household uses about one hundred gallons of water a day – per person, ano<strong>the</strong>r 25<br />
billion gallons.<br />
All of <strong>the</strong>se downstream water users benefit from watershed fire protection <strong>in</strong> addition to<br />
<strong>the</strong> direct users of <strong>the</strong> watersheds such as hikers, boaters, hunters, and fishermen. Adequate<br />
supplies of good quality water are critical to <strong>the</strong> success of most of mank<strong>in</strong>d’s endeavors.<br />
Properly managed forest lands produce more and better quality water than overstocked decadent<br />
forests or than severely burned forest lands.<br />
Some of <strong>the</strong> characteristics of <strong>the</strong> current generation of overstocked, decadent forests<br />
<strong>in</strong>clude:<br />
• Individual trees and shrubs are more easily stressed due to lack of water <strong>in</strong> dry years due<br />
to <strong>the</strong> effects of over competition for water on crowded sites.<br />
• The dead to live fuel ratio is higher, mak<strong>in</strong>g <strong>the</strong> forest subject to higher <strong>in</strong>tensity<br />
wildfires.Dur<strong>in</strong>g drought years, heavy die-back adds more dead fuel.<br />
• Stand density (fuel load<strong>in</strong>g) is so high that prescribed fire cannot be safely used.<br />
• There is greater risk of <strong>in</strong>sect and disease epidemics.<br />
88
• Water production is lower, as more trees use more water.<br />
• Marg<strong>in</strong>al streams are more likely to go dry, endanger<strong>in</strong>g aquatic life.<br />
• There is greater risk of flood<strong>in</strong>g and erosion after high <strong>in</strong>tensity fires have killed <strong>the</strong><br />
majority of <strong>the</strong> vegetation <strong>in</strong> any watershed.<br />
After a high <strong>in</strong>tensity forest fire, <strong>the</strong> potential exists for major flood<strong>in</strong>g and serious erosion<br />
which can damage roads, bridges, reservoirs, water and sewage systems as well as homes and<br />
bus<strong>in</strong>esses far downstream. Because we are all taxpayers, we all pay for both <strong>the</strong> direct costs of<br />
putt<strong>in</strong>g out large, damag<strong>in</strong>g forest fires and <strong>the</strong> <strong>in</strong>direct costs of repair<strong>in</strong>g and replac<strong>in</strong>g <strong>the</strong><br />
<strong>in</strong>frastructure damaged by post-fire floods, erosion, and landslides. Therefore, we would all<br />
benefit from efforts to restore forest health, reduce <strong>the</strong> potential for high <strong>in</strong>tensity wildfires, and<br />
improve <strong>the</strong> volume and quality of water produced by our forests.<br />
All taxpayers benefit from healthy<br />
forests.<br />
The National <strong>Fire</strong> Plan – A Coord<strong>in</strong>ated Approach<br />
Kootenai County, Idaho<br />
As <strong>the</strong> National <strong>Fire</strong> Plan began to take shape, Idaho Department of Lands, Bureau of<br />
<strong>Fire</strong> Management personnel recognized an opportunity to help Idaho avoid more disastrous fire<br />
seasons like that of 2000. Already engaged <strong>in</strong> a significant cooperative effort with <strong>the</strong> federal<br />
wildland fire agencies to mitigate fire risk, especially <strong>in</strong> <strong>the</strong> wildland/urban <strong>in</strong>terface, <strong>the</strong>y<br />
focused a good deal of effort on br<strong>in</strong>g<strong>in</strong>g o<strong>the</strong>r possible players to <strong>the</strong> plate and <strong>in</strong> develop<strong>in</strong>g<br />
political support for large scale fire mitigation projects.<br />
When <strong>the</strong> National <strong>Fire</strong> Plan 10-Year Strategy Implementation Plan was signed by Idaho<br />
Governor Dirk Kempthorne <strong>in</strong> May, 2002, Idaho fire officials were ready to develop a statewide<br />
process for implement<strong>in</strong>g <strong>the</strong> National <strong>Fire</strong> Plan <strong>in</strong> Idaho. Their efforts have lead to a model<br />
program for effectively implement<strong>in</strong>g <strong>the</strong> full potential of <strong>the</strong> National <strong>Fire</strong> Plan.<br />
The Idaho Strategy<br />
As a result of seven meet<strong>in</strong>gs held with State, federal, and local fire and emergency<br />
services personnel around <strong>the</strong> State, Idaho Department of Lands fire managers noted several<br />
problems that needed to be overcome to effectively implement <strong>the</strong> National <strong>Fire</strong> Plan:<br />
89
• There was a lack of coord<strong>in</strong>ated effort between agencies <strong>in</strong> some areas.<br />
• There was a lack of understand<strong>in</strong>g of roles and responsibilities between agencies and<br />
among <strong>the</strong> public.<br />
• There was a lack of <strong>in</strong>formation shar<strong>in</strong>g among different <strong>in</strong>terdependent programs.<br />
• Local fire and emergency services personnel were overwhelmed by all <strong>the</strong> programs and<br />
paperwork.<br />
Dur<strong>in</strong>g this exploration process, <strong>the</strong>y also discovered an opportunity to comb<strong>in</strong>e efforts at<br />
wildland fire mitigation plann<strong>in</strong>g with <strong>the</strong> new Federal Emergency Management Agency required<br />
Community Mitigation Plans for natural disasters. Accord<strong>in</strong>gly, <strong>the</strong> Idaho Bureau of<br />
Disaster Services was <strong>in</strong>vited to jo<strong>in</strong> <strong>the</strong> statewide plann<strong>in</strong>g group.<br />
The Idaho Strategy is based on <strong>the</strong> follow<strong>in</strong>g key assumptions that guided <strong>the</strong> State level<br />
plann<strong>in</strong>g group. To achieve <strong>the</strong> objective of mitigat<strong>in</strong>g <strong>the</strong> danger of wildland fire to <strong>the</strong> citizens,<br />
improvements, and natural resources of Idaho:<br />
• Local leadership and local knowledge are key;<br />
• Local decision-mak<strong>in</strong>g should be facilitated and respected;<br />
• Previous work should not be neglected or negated by <strong>the</strong> new process.<br />
A wide range of state and federal agencies pooled <strong>the</strong>ir efforts to draft <strong>the</strong> Idaho National<br />
<strong>Fire</strong> Plan Strategy, <strong>in</strong>clud<strong>in</strong>g:<br />
Idaho Association of Counties<br />
Idaho Resource Conservation and Development Council<br />
Idaho <strong>Fire</strong> Chiefs Association<br />
Idaho State <strong>Fire</strong> Marshal<br />
Idaho Bureau of Disaster Services<br />
Idaho Department of Lands<br />
Idaho Governor’s Office<br />
90
USDA Forest Service<br />
USDI Bureau of Land Management<br />
USDI Bureau of Indian Affairs<br />
The Idaho Strategy was approved on July 26 th , 2002 and calls for a three-tier approach to<br />
implement<strong>in</strong>g <strong>the</strong> National <strong>Fire</strong> Plan statewide. At <strong>the</strong> local level is <strong>the</strong> county-based group<br />
which will conduct risk analysis, prioritize implementation project lists, facilitate implementation<br />
among agencies and local <strong>in</strong>terest groups, and provide cont<strong>in</strong>uity for mitigation efforts<br />
(Figure 32). Typical participants <strong>in</strong> <strong>the</strong> county-level groups <strong>in</strong>clude:<br />
• Federal agency fire management officials<br />
• State fire management officials (both <strong>the</strong> Department of<br />
Lands and <strong>the</strong> State <strong>Fire</strong> Marshal)<br />
• Local fire chiefs<br />
• County Commissioners<br />
• Local and State disaster preparedness officials<br />
• Resource Conservation and Development Councils<br />
• Citizen groups (homeowners associations, service clubs,<br />
etc.)<br />
• Special <strong>in</strong>terest groups.<br />
At <strong>the</strong> State level, <strong>the</strong> statewide group will provide coord<strong>in</strong>ation and oversight, prioritize<br />
projects, provide advice and counsel to <strong>the</strong> county-level groups, provide long-term direction,<br />
and explore opportunities to make mitigation projects f<strong>in</strong>ancially self-susta<strong>in</strong><strong>in</strong>g. Members of<br />
<strong>the</strong> statewide group <strong>in</strong>clude:<br />
91
• State and Federal fire officials<br />
• Idaho Association of Counties<br />
• Idaho <strong>Fire</strong> Chiefs’ Association<br />
• Idaho Department of Commerce<br />
• Idaho Governor’s Office<br />
The Department of Commerce provides ano<strong>the</strong>r possible fund<strong>in</strong>g source with grants for<br />
community development and risk assessment, which can <strong>in</strong>clude fire protection plann<strong>in</strong>g.<br />
Wildfires frequently have significant impacts on local economies, <strong>in</strong>itially good by spurr<strong>in</strong>g<br />
local purchases of goods and services dur<strong>in</strong>g wildfire suppression and rehabilitation, but often<br />
bad <strong>in</strong> <strong>the</strong> long-term as tourism, recreation, and logg<strong>in</strong>g<br />
decl<strong>in</strong>e <strong>in</strong> post-fire periods.<br />
The third component of <strong>the</strong><br />
Idaho Strategy for National <strong>Fire</strong><br />
Plan implementation is a web-based<br />
statewide <strong>in</strong>formation shar<strong>in</strong>g and<br />
coord<strong>in</strong>ation method, under <strong>the</strong><br />
guidance of <strong>the</strong> statewide group.<br />
This <strong>in</strong>formation is currently available<br />
on <strong>the</strong> Idaho Department of<br />
Lands website (http//<br />
www2.state.id.us/lands/news.htm).<br />
It allows all participat<strong>in</strong>g agencies<br />
and any <strong>in</strong>terested <strong>in</strong>dividuals to<br />
keep up-to-date on National <strong>Fire</strong><br />
Plan projects statewide, and greatly<br />
facilitates <strong>the</strong> annual report<strong>in</strong>g<br />
requirements to <strong>the</strong> federal sponsor<br />
agencies.<br />
As mentioned earlier, it was discovered<br />
that <strong>the</strong>re was an opportunity to comb<strong>in</strong>e<br />
wildland fire hazard mitigation plann<strong>in</strong>g<br />
under <strong>the</strong> National <strong>Fire</strong> Plan with <strong>the</strong> Commu-<br />
Figure 32. The implantation of <strong>the</strong> National <strong>Fire</strong> Plan<br />
<strong>in</strong> Idaho was a statewide effort.<br />
92
nity Mitigation Plans for natural disasters now be<strong>in</strong>g required by Federal Emergency Management<br />
Agency before local agencies can be eligible for <strong>the</strong> Federal Hazard Mitigation Grant<br />
Program. Many communities were unaware of <strong>the</strong> Federal Emergency Management Agency<br />
requirement and now will be able to position <strong>the</strong>mselves for that fund<strong>in</strong>g source as well as<br />
National <strong>Fire</strong> Plan grants. Funds from various sources were used to fund complementary efforts<br />
(Figure 33)<br />
State-level Efforts<br />
The Idaho Department of Lands, <strong>in</strong> cooperation with <strong>the</strong> federal agencies adm<strong>in</strong>isters<br />
much of <strong>the</strong> pass-through fund<strong>in</strong>g available to local agencies under <strong>the</strong> National <strong>Fire</strong> Plan. Two<br />
of <strong>the</strong> oldest aid programs are State <strong>Fire</strong> Assistance, which provides federal funds to state<br />
wildland fire agencies, and Volunteer <strong>Fire</strong> Assistance, which is directed at local government fire<br />
agencies. Under <strong>the</strong> National <strong>Fire</strong> Plan, this fund<strong>in</strong>g level has been dramatically <strong>in</strong>creased,<br />
allow<strong>in</strong>g <strong>the</strong> Department of Lands not only to improve its own protection system, but to <strong>in</strong>crease<br />
its support to local government fire agencies, which are frequently <strong>the</strong> first responders to<br />
wildland fires. Such assistance helps local fire protection districts meet needs rang<strong>in</strong>g from<br />
wildland fire safety cloth<strong>in</strong>g, to newer, more reliable fire apparatus, to better public education<br />
programs. Most of <strong>the</strong> available fund<strong>in</strong>g is prioritized for agencies serv<strong>in</strong>g <strong>the</strong> wildland/urban<br />
<strong>in</strong>terface, where homes and people are at greatest risk.<br />
FEMA grant funds can be used for<br />
wildfire protection plans.<br />
A newer state-level fund<strong>in</strong>g source is Rural <strong>Fire</strong> Assistance monies from <strong>the</strong> US Department<br />
on Interior<br />
agencies, which are<br />
targeted at rural fire<br />
protection districts<br />
to help <strong>the</strong>m improve<br />
<strong>the</strong>ir capabilities<br />
to fight wildland<br />
fires more efficiently<br />
and safely.<br />
These rural fire<br />
departments provide<br />
critical <strong>in</strong>itial attack<br />
fire protection to<br />
millions of acres of<br />
Figure 33. Funds from various sources were used to fund <strong>the</strong> complementary<br />
programs <strong>in</strong> Kootenai County.<br />
93
public doma<strong>in</strong> lands adm<strong>in</strong>istered by <strong>the</strong> Bureau of Land Management, and, when<br />
properly equipped and tra<strong>in</strong>ed, can be an important resource for large wildland<br />
fires.<br />
Under <strong>the</strong> National <strong>Fire</strong> Plan, <strong>the</strong> Idaho Department of Lands has been<br />
able to provide fund<strong>in</strong>g for wildfire mitigation projects on more than 13,000 acres<br />
of private forest lands <strong>in</strong> <strong>the</strong> State. Most of <strong>the</strong>se efforts are aimed at reduc<strong>in</strong>g<br />
dangerous fuel levels <strong>in</strong> <strong>the</strong> woods, frequently by mechanical harvest<strong>in</strong>g or treatment<br />
methods, but also with prescribed fire. Usually, fuel load<strong>in</strong>g is so high that<br />
some form of fuel treatment is needed before fire can be re<strong>in</strong>troduced to <strong>the</strong><br />
woods, especially <strong>in</strong> <strong>the</strong> wildland/urban <strong>in</strong>terface.<br />
Figure 34. National <strong>Fire</strong> Plan money was matched<br />
with funds from <strong>the</strong> State parks to construct this fuel<br />
break.<br />
An example of a cooperative state-level hazard<br />
reduction program is <strong>the</strong> project at Heyburn State Park <strong>in</strong><br />
<strong>the</strong> nor<strong>the</strong>rn Idaho panhandle, where some 70 summer<br />
cab<strong>in</strong>s were at serious risk from wildfire <strong>in</strong> an overcrowded,<br />
decadent forest sett<strong>in</strong>g. Idaho Department of<br />
Lands, <strong>in</strong> cooperation with <strong>the</strong> Idaho Department of Parks<br />
and Recreation, designed a 100-foot wide fuelbreak to<br />
protect <strong>the</strong> park and <strong>the</strong> cab<strong>in</strong>s from encroach<strong>in</strong>g wildfire<br />
(Figure 34). The 1.5 mile fuelbreak was created by a<br />
commercial th<strong>in</strong>n<strong>in</strong>g logg<strong>in</strong>g operation, followed by<br />
mechanical reduction of slash by a contractor. Fund<strong>in</strong>g<br />
was provided by a $26,000 grant from Idaho Department<br />
of Lands, with Idaho Department of Parks and Recreation<br />
match<strong>in</strong>g that grant. Almost 75% of <strong>the</strong> fund<strong>in</strong>g that Idaho<br />
Department of Parks and Recreation was able to contribute<br />
was derived from <strong>the</strong> sale of <strong>the</strong> harvested timber.<br />
Idaho Department of Lands will also be sponsor<strong>in</strong>g a <strong>Fire</strong>Wise Communities Workshop <strong>in</strong><br />
Coeur D’Alene on May 21-22, 2003 which will provide an opportunity for local government,<br />
fire, emergency services, and plann<strong>in</strong>g officials to learn more about protect<strong>in</strong>g communities<br />
from encroach<strong>in</strong>g wildfires.<br />
94
Kootenai County <strong>Fire</strong>Smart<br />
The county-level plann<strong>in</strong>g group <strong>in</strong> Kootenai County, which encompasses <strong>the</strong> valuable<br />
and desirable Coeur D’Alene Lake recreation area, chose to operate with a centralized, countywide<br />
approach to implement<strong>in</strong>g <strong>the</strong> National <strong>Fire</strong> Plan. Organiz<strong>in</strong>g under <strong>the</strong> moniker Kootenai<br />
County <strong>Fire</strong>Smart, <strong>the</strong>y obta<strong>in</strong>ed a grant from IDOC to do fire plann<strong>in</strong>g, and ano<strong>the</strong>r grant from<br />
<strong>the</strong> Bureau of Land Management Communities at Risk program to do risk assessment for all<br />
communities <strong>in</strong> <strong>the</strong> county. The risk assessment becomes <strong>the</strong> basis for both wildland fire mitigation<br />
project plann<strong>in</strong>g under <strong>the</strong> National <strong>Fire</strong> Plan, and also assists communities <strong>in</strong> develop<strong>in</strong>g<br />
<strong>the</strong>ir Community Mitigation Plans for Federal Emergency Management Agency.<br />
Hav<strong>in</strong>g completed <strong>the</strong> risk assessment and fire plann<strong>in</strong>g, Kootenai County <strong>Fire</strong>Smart was<br />
<strong>the</strong>n able to establish its project priorities. With solid local support generated dur<strong>in</strong>g <strong>the</strong> plann<strong>in</strong>g<br />
and risk assessment efforts, <strong>the</strong>y decided to try to undertake an ambitious large-scale<br />
hazard fuel treatment that, over three years, would create defensible space around more than<br />
2,000 structures <strong>in</strong> targeted high risk areas of <strong>the</strong> county. Under <strong>the</strong> <strong>Fire</strong>Smart hazard reduction<br />
project, homeowners <strong>in</strong><br />
<strong>the</strong> high risk areas can<br />
get defensible space<br />
established on <strong>the</strong>ir<br />
properties for free,<br />
provided <strong>the</strong>y agree to<br />
properly ma<strong>in</strong>ta<strong>in</strong> <strong>the</strong><br />
premises for at least ten<br />
years (Figure 35 and 36).<br />
The program began by<br />
utiliz<strong>in</strong>g <strong>the</strong> <strong>Fire</strong> Education<br />
Corps of <strong>the</strong> Student<br />
Conservation Association<br />
to beg<strong>in</strong> educat<strong>in</strong>g<br />
owners about <strong>the</strong><br />
<strong>Fire</strong>Smart project and on<br />
<strong>the</strong> need for defensible<br />
space around <strong>the</strong>ir<br />
homes. The <strong>Fire</strong> Education<br />
Corps also created<br />
Figure 35. Kootenai County <strong>Fire</strong>Smart coord<strong>in</strong>ated <strong>the</strong> development of<br />
“defensible space” around hundreds of homes.<br />
<strong>Fire</strong>Smart is work<strong>in</strong>g hard to reduce<br />
<strong>the</strong> wildland/urban <strong>in</strong>terface fire<br />
problem <strong>in</strong> Kootenai County, Idaho.<br />
95
model defensible space demonstration sites to help people<br />
appreciate <strong>the</strong> “clean and green” outcome of properly executed<br />
fuel hazard reduction projects. With its act toge<strong>the</strong>r,<br />
its assessment completed, and its priorities established,<br />
Kootenai County <strong>Fire</strong>Smart was able to land a National <strong>Fire</strong><br />
Plan grant for $1,816,905 <strong>in</strong> Fiscal Year 2002 to fund its<br />
project.<br />
Meanwhile, Idaho Department of Lands was able to<br />
also route SFA, VFA, and RFA funds to eight rural fire<br />
departments <strong>in</strong> Kootenai County, allow<strong>in</strong>g <strong>the</strong>m to not only<br />
improve <strong>the</strong>ir suppression capability, but to beg<strong>in</strong> to sponsor<br />
wildland/urban <strong>in</strong>terface education programs <strong>in</strong> <strong>the</strong>ir communities<br />
that should help generate more homeowner <strong>in</strong>terest<br />
<strong>in</strong> <strong>the</strong> <strong>Fire</strong>Smart hazard reduction project. In total, Kootenai<br />
County received nearly $2 million <strong>in</strong> National <strong>Fire</strong> Plan<br />
fund<strong>in</strong>g.<br />
Figure 36. Before and after pictures<br />
of a home <strong>in</strong> Kootenai County.<br />
With a good plan, solid <strong>in</strong>itial fund<strong>in</strong>g, and <strong>the</strong> opportunity to leverage additional fund<strong>in</strong>g<br />
from corporate sponsors and community service organizations, Kootenai County <strong>Fire</strong>Smart<br />
is poised to make a serious difference <strong>in</strong> <strong>the</strong> fire risk to people and homes <strong>in</strong> <strong>the</strong> wildland/urban<br />
<strong>in</strong>terface of nor<strong>the</strong>rn Idaho.<br />
96
The Healthy Forests Initiative<br />
Wildfire Prevention and Stronger Communities<br />
In August of 2002, President George W. Bush used <strong>the</strong> Squires Peak <strong>Fire</strong> <strong>in</strong> southwest<br />
Oregon as <strong>the</strong> backdrop for <strong>the</strong> <strong>in</strong>troduction of a White House-sponsored <strong>in</strong>itiative to improve<br />
fire prevention and forge stronger communities by speed<strong>in</strong>g up <strong>the</strong> approval process for forest<br />
th<strong>in</strong>n<strong>in</strong>g and health improvement projects on federal lands.<br />
Stand<strong>in</strong>g at a po<strong>in</strong>t where <strong>the</strong> Squires Peak <strong>Fire</strong> had crowned over a ridge top <strong>in</strong> dense<br />
timber, destroy<strong>in</strong>g an on-go<strong>in</strong>g logg<strong>in</strong>g operation for fuel reduction, <strong>the</strong> President noted that <strong>the</strong><br />
2002 fire season was already one of <strong>the</strong> worst <strong>in</strong> modern history, with fires affect<strong>in</strong>g hundreds<br />
of communities, necessitat<strong>in</strong>g <strong>the</strong> evacuation of thousands of residents, destroy<strong>in</strong>g millions of<br />
dollars worth of timber, and caus<strong>in</strong>g great damage to municipal watersheds.<br />
190 million acres of federal forest<br />
land at risk of catastrophic wildfire.<br />
The <strong>in</strong>itiative stated that catastrophic fires are caused by deteriorat<strong>in</strong>g forest and rangeland<br />
health due to suppression of fires and lack of active forest and range management practices. It<br />
identified 190 million acres of unnaturally dense forests on public land as be<strong>in</strong>g at risk of<br />
catastrophic wildfires. The report noted that <strong>the</strong>se deteriorated forest and rangelands significantly<br />
affect people, property, and ecosystem health and that “enhanced measures are needed to<br />
restore forest and rangeland health to reduce <strong>the</strong> risk of <strong>the</strong>se catastrophic wildfires”. It po<strong>in</strong>ted<br />
to “needless” red tape and lawsuits that delay effective implementation of forest health projects,<br />
cit<strong>in</strong>g several examples <strong>in</strong> <strong>the</strong> <strong>West</strong>.<br />
The <strong>in</strong>itiative <strong>in</strong>cludes direction to <strong>the</strong> secretaries of Agriculture and Interior, and <strong>the</strong><br />
chairman of <strong>the</strong> Council on Environmental Quality (CEQ) to improve regulatory processes to<br />
ensure more timely decisions, greater efficiency, and better results <strong>in</strong> reduc<strong>in</strong>g fire danger and<br />
restor<strong>in</strong>g forest health. Key measures <strong>in</strong>clude:<br />
• Improv<strong>in</strong>g procedures for develop<strong>in</strong>g and implement<strong>in</strong>g fuel treatment and forest<br />
restoration projects.<br />
• Reduc<strong>in</strong>g <strong>the</strong> number of overlapp<strong>in</strong>g environmental reviews.<br />
97
• Develop<strong>in</strong>g guidance for weigh<strong>in</strong>g <strong>the</strong> short-term risks aga<strong>in</strong>st <strong>the</strong> long-term benefits<br />
of treatment projects.<br />
• Develop<strong>in</strong>g guidance to ensure consistent NEPA procedures for fuel treatment and<br />
forest health projects.<br />
The report also stated that <strong>the</strong> President would work with Congress on legislation to:<br />
• Authorize federal agencies to enter <strong>in</strong>to long-term stewardship contracts with <strong>the</strong><br />
private sector, and state and local governments.<br />
• Expedite implementation of fuel reduction and forest health improvement projects.<br />
• Ensure that federal judges consider long-terms risks of harm to people, property, and<br />
<strong>the</strong> environment <strong>in</strong> decid<strong>in</strong>g challenges to projects.<br />
• Remove a rider that imposed extraord<strong>in</strong>ary procedural requirements on <strong>the</strong> Forest<br />
Service appeal process.<br />
• Fully implement <strong>the</strong> promises of <strong>the</strong> 1994 Northwest Forest Plan by remov<strong>in</strong>g needless<br />
adm<strong>in</strong>istrative obstacles and renew<strong>in</strong>g <strong>the</strong> commitment to a balanced conservation<br />
strategy.<br />
Key reasons that catastrophic wildfires harm people, property, and <strong>the</strong> environment were<br />
cited as:<br />
• Risk to firefighters<br />
• Increased air pollution<br />
• Community evacuations<br />
• Property damage<br />
• Disruption to local economies<br />
- Reduced tourism<br />
- Damage to municipal watersheds<br />
98
• Environmental damage<br />
- Damaged fisheries<br />
- Destroyed endangered species habitat<br />
- Soil sterilization and erosion<br />
- Spread of <strong>in</strong>vasive plant species<br />
- Disease and <strong>in</strong>sect <strong>in</strong>festations<br />
The <strong>in</strong>itiative paper notes that progress has been made <strong>in</strong> improv<strong>in</strong>g fire protection and<br />
forest health with recent <strong>in</strong>creases <strong>in</strong> fund<strong>in</strong>g for hazardous fuels treatment projects and additional<br />
suppression resources (+ 377 fire eng<strong>in</strong>es, 4,900 fire personnel, aircraft, bulldozers, etc.).<br />
It identified 1.9 million acres as already treated with th<strong>in</strong>n<strong>in</strong>g or prescribed burn<strong>in</strong>g, with<br />
ano<strong>the</strong>r 2.5 million acres slated to be completed by <strong>the</strong> end of <strong>the</strong> year.<br />
In referr<strong>in</strong>g to <strong>the</strong> 10-year Comprehensive Strategy Implementation Plan between federal<br />
wildfire agencies, affected states, tribal, and local governments, <strong>the</strong> <strong>in</strong>itiative notes that a key<br />
priority of this plan is more active forest and rangeland management to reduce <strong>the</strong> accumulation<br />
of fuels and to restore ecosystem health. This plan also establishes 23 priority tasks for<br />
federal, state, and local governments, most importantly:<br />
• Develop<strong>in</strong>g and implement<strong>in</strong>g a process for all levels of government to collaborate on<br />
fuel treatment and burned area rehabilitation projects.<br />
• Develop<strong>in</strong>g and implement<strong>in</strong>g consistent and effective contract<strong>in</strong>g, procurement, and<br />
grant processes for fuel treatment projects.<br />
• Assess<strong>in</strong>g federal regulatory processes and identify<strong>in</strong>g measures to improve timely<br />
decision-mak<strong>in</strong>g.<br />
The document also identifies significant actions <strong>the</strong> adm<strong>in</strong>istration is tak<strong>in</strong>g to improve <strong>the</strong><br />
effectiveness of its fuels treatment and forest health improvement programs, <strong>in</strong>clud<strong>in</strong>g:<br />
• Mak<strong>in</strong>g procedural improvements<br />
• Increas<strong>in</strong>g management effectiveness<br />
• Sponsor<strong>in</strong>g critical research<br />
• Restor<strong>in</strong>g record amounts of burned forests (BAER)<br />
99
• Provid<strong>in</strong>g grants to communities for hazard mitigation plans and projects, market<br />
utilization of small-diameter wood materials projects, and cost reimbursement for<br />
firefight<strong>in</strong>g efforts<br />
• Increas<strong>in</strong>g grants to improve local rural and volunteer fire departments<br />
• Enlist<strong>in</strong>g Student Conservation Association (SCA) volunteers<br />
Procedural delays (“red tape”) stall<br />
critical forest health restoration<br />
projects.<br />
The <strong>in</strong>itiative contends that procedural delays are stall<strong>in</strong>g critical forest and rangeland<br />
management projects, cit<strong>in</strong>g a FS study, The Process Predicament, with three factors contribut<strong>in</strong>g<br />
<strong>the</strong> most to project delays:<br />
• Excessive analysis<br />
• Ineffective public <strong>in</strong>volvement<br />
• Management <strong>in</strong>efficiencies<br />
Several examples are cited where <strong>the</strong> decision-mak<strong>in</strong>g and appeals processes are so long<br />
that by <strong>the</strong> time <strong>the</strong> project is f<strong>in</strong>ally approved, it is no longer viable. Reasons <strong>in</strong>clude runn<strong>in</strong>g<br />
out of funds, salvage timber deterioration, <strong>in</strong>sect <strong>in</strong>festations, and wildfires that burn <strong>the</strong> forest<br />
before it can be th<strong>in</strong>ned.<br />
The Healthy Forests Initiative uses <strong>the</strong> Squires Peak <strong>Fire</strong> <strong>in</strong> Oregon as a case study of how<br />
properly planned and executed fuel reduction projects can reduce potential wildfire damages,<br />
despite <strong>the</strong> current obstacle course of analysis paralysis.<br />
F<strong>in</strong>ally, <strong>the</strong> <strong>in</strong>itiative calls for actions to identify ways to put <strong>the</strong> Northwest Forest Plan,<br />
which has yet to come anywhere near its projected level of action, back on track toward restor<strong>in</strong>g<br />
a susta<strong>in</strong>able forest economy <strong>in</strong> <strong>the</strong> Pacific Northwest.<br />
The Healthy Forests Initiative is an attempt by <strong>the</strong> Adm<strong>in</strong>istration to overcome some of <strong>the</strong><br />
current obstacles to effective fuels reduction and forest health improvement projects. Unfortunately,<br />
vocal critics say <strong>the</strong> Adm<strong>in</strong>istration is only chipp<strong>in</strong>g away at environmental safeguards<br />
to speed up logg<strong>in</strong>g of old-growth forests. There is a press<strong>in</strong>g need to f<strong>in</strong>d a middle ground<br />
where land managers and environmentalists can agree that timely and properly executed fuel<br />
reduction projects, <strong>in</strong>clud<strong>in</strong>g commercial th<strong>in</strong>n<strong>in</strong>g logg<strong>in</strong>g operations, can reduce <strong>the</strong> threat of<br />
catastrophic wildfire and improve forest health, to <strong>the</strong> benefit not only of humans, but of all<br />
elements of <strong>the</strong> ecosystem.<br />
100
The Drought and 2002 <strong>Fire</strong> Season<br />
<strong>Fire</strong> Season 2002 <strong>in</strong> <strong>the</strong> <strong>West</strong> can be characterized as busy, <strong>in</strong>tense, and difficult, punctuated<br />
by record-sized major conflagrations. Nearly 40,000 wildfires burned nearly 7 million<br />
acres, not quite as much as <strong>in</strong> 2000, but far above average.<br />
Record sized major fires occurred <strong>in</strong> Arizona, Colorado, and Oregon. Major fires occurred<br />
throughout <strong>the</strong> <strong>West</strong>, from San Diego to Wenatche, and from Gold Beach to <strong>the</strong> Black Hills.<br />
There are two primary reasons for <strong>the</strong> widespread, high <strong>in</strong>tensity, destructive major fires of<br />
2002:<br />
• Drought<br />
• Decadent forest health<br />
<strong>Fire</strong> <strong>in</strong> <strong>the</strong> <strong>West</strong> 2002:<br />
40,000 wildfires;<br />
7 million acres burned.<br />
We have already discussed <strong>the</strong> forest health issue, and now need to take a look at <strong>the</strong><br />
extent of <strong>the</strong> drought conditions <strong>in</strong> <strong>the</strong> <strong>West</strong>.<br />
Drought and Forest <strong>Fire</strong>s <strong>in</strong> <strong>the</strong> <strong>West</strong><br />
Drought is no stranger to southwest United States. Repeated extended dry cycles over<br />
thousands of years have lead to <strong>the</strong> development of desert landscapes composed of species able<br />
to withstand extended periods without ra<strong>in</strong>.<br />
Across much of <strong>the</strong> SW <strong>the</strong>re are only three basic types of forests, each dependent on <strong>the</strong><br />
amount of water available <strong>in</strong> <strong>the</strong> soil annually. At <strong>the</strong> mid-elevations, above <strong>the</strong> scrub brush and<br />
cactus of <strong>the</strong> desert floor, where more ra<strong>in</strong>fall occurs due to orographic lift<strong>in</strong>g of <strong>the</strong> clouds, <strong>the</strong><br />
P<strong>in</strong>yon-Juniper (P-J) forest struggles to survive. P-J forest is characterized by widely spaced to<br />
scattered trees, <strong>in</strong>terspersed with <strong>the</strong> desert scrub and brush species. Only along seasonal watercourses<br />
or just below <strong>the</strong> snowl<strong>in</strong>e are you likely to f<strong>in</strong>d relatively dense stands of P-J.<br />
Ponderosa P<strong>in</strong>e is <strong>the</strong> most common conifer forest type <strong>in</strong> <strong>the</strong> SW, occurr<strong>in</strong>g at higher<br />
elevations where <strong>the</strong> w<strong>in</strong>ter snow pack banks water that <strong>the</strong> trees can draw on to susta<strong>in</strong> growth<br />
throughout much of <strong>the</strong> year.<br />
101
In <strong>the</strong> higher mounta<strong>in</strong>s, and along cool, moister canyon walls above <strong>the</strong> p<strong>in</strong>e belt, a true<br />
mixed conifer forest may be found, with Douglas Fir, true firs, <strong>in</strong>cense cedar, etc. mix<strong>in</strong>g with<br />
or supplant<strong>in</strong>g Ponderosa P<strong>in</strong>e.<br />
Long periods of drought are becom<strong>in</strong>g<br />
more common <strong>in</strong> <strong>the</strong> Southwest.<br />
In recent years, <strong>the</strong>re have been <strong>in</strong>creas<strong>in</strong>g numbers of large, damag<strong>in</strong>g forest fires <strong>in</strong> <strong>the</strong><br />
SW. Although to some degree this is <strong>the</strong> result of forest management practices such as logg<strong>in</strong>g<br />
and fire suppression that have lead to an <strong>in</strong>crease <strong>in</strong> fuels, a major contributor to this flammable<br />
situation has been climate variability. Indications are that <strong>the</strong> climate <strong>in</strong> much of <strong>the</strong><br />
<strong>West</strong> is chang<strong>in</strong>g, becom<strong>in</strong>g more variable, with greater extremes than we have experienced<br />
throughout much of <strong>the</strong> last hundred or so years. One of <strong>the</strong> facets of <strong>the</strong> “new climate” is<br />
<strong>in</strong>creased periods of prolonged drought, which leave <strong>the</strong> forests t<strong>in</strong>der dry and more susceptible<br />
to serious epidemics of <strong>in</strong>sects, diseases, and <strong>in</strong>tense forest fires.<br />
Drought and Forest <strong>Fire</strong>s<br />
Long periods of drought are becom<strong>in</strong>g more common <strong>in</strong> <strong>the</strong> SW and can be l<strong>in</strong>ked to<br />
major fire occurrence. The Palmer Drought Severity Index (PDSI) is a long-term measure of<br />
dryness or wetness, not affected by s<strong>in</strong>gle precipitation events, us<strong>in</strong>g a scale rang<strong>in</strong>g from<br />
extreme drought (4.0). In a 50-year composite of <strong>the</strong> PDSI for <strong>the</strong><br />
US, <strong>the</strong> southwest region scores<br />
<strong>the</strong> driest <strong>in</strong> <strong>the</strong> US (Figure 37).<br />
Accord<strong>in</strong>g to Mark W.<br />
Patterson of <strong>the</strong> University of<br />
Arizona, <strong>in</strong> his paper Forest<br />
<strong>Fire</strong>s and Drought <strong>in</strong> <strong>the</strong> U.S.<br />
Southwest, drought conditions<br />
<strong>in</strong>fluence <strong>the</strong> occurrence of forest<br />
fires <strong>in</strong> <strong>the</strong> SW. <strong>Fire</strong> history data<br />
collected from tree-r<strong>in</strong>g analyses<br />
was compared to <strong>the</strong> PDSI,<br />
show<strong>in</strong>g that “larger forest fires<br />
tend to occur when <strong>the</strong> PDSI is<br />
lower.”<br />
Figure 37. The heart of <strong>the</strong> Nation has historically been <strong>in</strong> a drought<br />
condition...it isn’t anyth<strong>in</strong>g new.<br />
102
In drought conditions, fire management practices are disrupted, as it is harder to conduct<br />
prescribed burns to reduce forest fuel accumulations, and it is harder to make successful <strong>in</strong>itial<br />
attack on wildfires. Larger, more <strong>in</strong>tense forest fires frequently result <strong>in</strong> <strong>the</strong> loss of homes,<br />
wildlife, and recreational opportunities. Even without <strong>the</strong> fires, drought conditions may dim<strong>in</strong>ish<br />
recreation by restrict<strong>in</strong>g campfires or necessitat<strong>in</strong>g closures.<br />
Large, <strong>in</strong>tense forest fires can radically alter significant areas of wildlife habitat, which<br />
may adversely impact animal populations, especially endangered species.<br />
Currently, <strong>the</strong> natural resource agencies of <strong>the</strong> <strong>West</strong> are attempt<strong>in</strong>g to re<strong>in</strong>troduce frequent,<br />
low-<strong>in</strong>tensity fires to <strong>the</strong> ecosystem, to try to restore forest health. One of <strong>the</strong> problems<br />
with implement<strong>in</strong>g this policy change <strong>in</strong> an effective way is that, even <strong>in</strong> normal precipitation<br />
years, <strong>the</strong> fuel accumulations are too heavy to use fire without first reduc<strong>in</strong>g stand density and<br />
elim<strong>in</strong>at<strong>in</strong>g ladder fuels which contribute to crown fires. Some environmentalists resist th<strong>in</strong>n<strong>in</strong>g<br />
projects, view<strong>in</strong>g <strong>the</strong>m as logg<strong>in</strong>g <strong>in</strong> disguise. This makes it more expensive to conduct<br />
hazard reduction, mean<strong>in</strong>g that fewer acres can be treated with available funds. In drought<br />
years, it is nearly impossible to achieve proper fire danger conditions to conduct prescribed<br />
burns, even <strong>in</strong> th<strong>in</strong>ned/treated forests.<br />
Drought conditions make it harder to<br />
use prescribed fire.<br />
Efforts to return forests to pre-fire suppression natural conditions are likely to be compounded<br />
by several conditions:<br />
• Increased fuel load<strong>in</strong>g, which makes fires burn more <strong>in</strong>tensely.<br />
• Increased presence of brushy understory vegetation (“ladder fuels”), which lead surface<br />
fires <strong>in</strong>to <strong>the</strong> crowns of trees.<br />
• Increased stand density, with closed canopy forests more susceptible to crown fires.<br />
• Different climatic conditions, result<strong>in</strong>g <strong>in</strong> greater fire danger much of <strong>the</strong> time.<br />
• Different climatic conditions may also affect <strong>the</strong> succession of species follow<strong>in</strong>g fire<br />
and <strong>the</strong> survival of various species, both desirable and unwanted.<br />
103
The Four Corners region was experienc<strong>in</strong>g<br />
“exceptional drought” <strong>in</strong> <strong>the</strong><br />
spr<strong>in</strong>g of 2002.<br />
At <strong>the</strong> start of <strong>the</strong> 2002,<br />
drought was widespread <strong>in</strong> <strong>the</strong><br />
U.S. and was especially serious<br />
<strong>in</strong> <strong>the</strong> SW. <strong>Fire</strong> season started<br />
early, and large fires were common<br />
<strong>in</strong> <strong>the</strong> spr<strong>in</strong>g months,<br />
especially <strong>in</strong> New Mexico,<br />
Arizona, and Colorado (Figure<br />
38).<br />
Meteorologists had predicted<br />
<strong>the</strong> drought and its accompany<strong>in</strong>g<br />
heat wave would persist<br />
through <strong>the</strong> summer from New<br />
Mexico north to Montana and<br />
Idaho. As predicted, <strong>the</strong> drought<br />
grew worse, especially for <strong>the</strong><br />
Four Corners and eastern Rocky<br />
Mounta<strong>in</strong> areas, with much of<br />
<strong>the</strong> <strong>West</strong> be<strong>in</strong>g <strong>in</strong> severe to<br />
exceptional drought conditions<br />
by September (Figure 39).<br />
Ra<strong>in</strong>fall <strong>in</strong> October f<strong>in</strong>ally<br />
brought an end to <strong>the</strong> occurrence<br />
of large wildfires <strong>in</strong> <strong>the</strong> <strong>West</strong>, but<br />
<strong>the</strong> drought persists. It is unlikely<br />
that enough precipitation<br />
will occur dur<strong>in</strong>g a forecast “El<br />
N<strong>in</strong>o” w<strong>in</strong>ter to ameliorate <strong>the</strong><br />
drought conditions <strong>in</strong> <strong>the</strong> entire<br />
<strong>West</strong>ern US before fire season<br />
2003.<br />
104<br />
Figure 38. The drought monitor map for June 4 shows <strong>the</strong><br />
Southwest and Nor<strong>the</strong>rn Rockies <strong>in</strong> a severe drought.<br />
Figure 39. The drought monitor map for September 4 still shows <strong>the</strong><br />
Southwest and Nor<strong>the</strong>rn Rockies <strong>in</strong> a severe drought.
The 2002 <strong>Fire</strong> Season<br />
The cont<strong>in</strong>u<strong>in</strong>g drought <strong>in</strong> <strong>the</strong> <strong>West</strong> made fire season 2002 <strong>the</strong> fifth year of severe drought<br />
<strong>in</strong> <strong>the</strong> last six years. Even <strong>in</strong> May, <strong>the</strong> countryside <strong>in</strong> most states was sere and wi<strong>the</strong>red as<br />
August <strong>in</strong> California. The sou<strong>the</strong>rn Rocky Mounta<strong>in</strong>s were <strong>the</strong> focus of <strong>the</strong> worst of <strong>the</strong><br />
drought, with <strong>the</strong> Four Corners area rated as suffer<strong>in</strong>g “exceptional drought”, and ra<strong>in</strong> and<br />
snowfall at less than 65% of <strong>the</strong> annual average (Figure 40).<br />
Colorado suffered <strong>the</strong><br />
driest spr<strong>in</strong>g <strong>in</strong> its 107-year<br />
history of wea<strong>the</strong>r records, and<br />
Arizona it’s second driest.<br />
Testament to <strong>the</strong> drought was<br />
not difficult to f<strong>in</strong>d, as P<strong>in</strong>yon<br />
P<strong>in</strong>es <strong>in</strong> Arizona’s P-J forests<br />
wi<strong>the</strong>red and died across huge<br />
areas. In <strong>the</strong> mounta<strong>in</strong>s, 30% of<br />
<strong>the</strong> water-stressed Ponderosa<br />
P<strong>in</strong>es <strong>in</strong> <strong>the</strong> Flagstaff/Williams<br />
area had succumbed to bark<br />
beetle attacks, leav<strong>in</strong>g <strong>the</strong> green<br />
forest canopy splotched with<br />
brown treetops. Reservoirs<br />
sported brown bathtub r<strong>in</strong>gs,<br />
and stocks ponds turned <strong>in</strong>to<br />
dust bowls.<br />
Figure 40. The Drought Monitor map for May 7, 2002 didn’t look<br />
good. The Rocky Mounta<strong>in</strong> and South <strong>West</strong>ern states were <strong>in</strong> extreme<br />
drought conditions.<br />
Colorado had <strong>the</strong> driest spr<strong>in</strong>g <strong>in</strong><br />
wea<strong>the</strong>r records history.<br />
The drought covered 40% of <strong>the</strong> country, with <strong>the</strong> sou<strong>the</strong>ast (except Florida this time) also<br />
hard hit. In <strong>the</strong> <strong>West</strong>, drought conditions ranged from Sou<strong>the</strong>rn California to Montana, and as<br />
far east as western Nebraska and Kansas. Corn crops shriveled. Birds abandoned <strong>the</strong>ir nests.<br />
Wildflowers failed to bloom. Streams stopped flow<strong>in</strong>g, trapp<strong>in</strong>g fish <strong>in</strong> oxygen-depleted hot<br />
tubs; 33,000 salmon and steelhead suffocated <strong>in</strong> California’s Klamath River. Cities and counties<br />
imposed water ration<strong>in</strong>g regulations.<br />
105
Wildland fire officials geared up for an early and severe fire season, and sought budget<br />
augmentations to help cope with extreme fire danger <strong>in</strong> overstocked, decadent forests <strong>in</strong>creas<strong>in</strong>gly<br />
crowded with new homes.<br />
The Indian <strong>Fire</strong> threatened 2,000<br />
homes <strong>in</strong> Prescott.<br />
Monster <strong>Fire</strong>s Spr<strong>in</strong>g Up<br />
The best <strong>in</strong>dicator of how a drought-aided spr<strong>in</strong>g fire season might shake out could have<br />
been <strong>the</strong> Indian <strong>Fire</strong>, which started on May 15 th <strong>in</strong> <strong>the</strong> middle of <strong>the</strong> afternoon <strong>in</strong> <strong>the</strong> Prescott<br />
National Forest just south of Prescott, Arizona. Upon arrival of <strong>the</strong> <strong>in</strong>itial attack resources, <strong>the</strong><br />
fire was already 10-15 acres <strong>in</strong> size and beg<strong>in</strong>n<strong>in</strong>g to crown and spot <strong>in</strong> heavy Ponderosa P<strong>in</strong>e<br />
forest. Headed uphill <strong>in</strong> front of a prevail<strong>in</strong>g southwest w<strong>in</strong>d, <strong>the</strong> Indian fire was charg<strong>in</strong>g right<br />
at <strong>the</strong> city. The <strong>in</strong>teragency command teams quickly ordered many eng<strong>in</strong>e strike teams for<br />
structure protection assignments ahead of <strong>the</strong> fire, and <strong>in</strong>itiated a heavy air show to try to keep<br />
<strong>the</strong> fire out of town. A tricky fir<strong>in</strong>g operation <strong>in</strong> a fuel reduction project, aided by air support<br />
and lessen<strong>in</strong>g w<strong>in</strong>ds, resulted <strong>in</strong> conta<strong>in</strong>ment <strong>the</strong> first night at 1,365 acres, with only 5 homes<br />
lost. 80% of <strong>the</strong> Indian <strong>Fire</strong> burned at high <strong>in</strong>tensity, and more than 2,000 homes <strong>in</strong> Prescott<br />
were directly <strong>in</strong> <strong>the</strong> path of <strong>the</strong> fire. Suppression costs were calculated at $1.2 million with $1.8<br />
million <strong>in</strong> damages.<br />
Near <strong>the</strong> end of May, three major fires <strong>in</strong> three different western States h<strong>in</strong>ted at what<br />
might be <strong>in</strong> store for <strong>the</strong> rest of <strong>the</strong> summer. On May 21 st , <strong>the</strong> Bullock <strong>Fire</strong> started <strong>in</strong> Arizona’s<br />
Coronado National Forest, burn<strong>in</strong>g 30,563 acres of <strong>the</strong> Gila River watershed until controlled on<br />
June 14 th , before <strong>the</strong> official start of summer. The Borrego <strong>Fire</strong> <strong>in</strong> New Mexico’s Santa Fe<br />
National Forest started <strong>the</strong> next day and burned 12,995 acres, rack<strong>in</strong>g up nearly $8 million <strong>in</strong><br />
suppression costs. On <strong>the</strong> 31 st of May <strong>in</strong> Utah, <strong>the</strong> human-caused Sanford fire began its march<br />
across 64,909 acres of <strong>the</strong> Dixie National Forest.<br />
June started off with a bang with <strong>the</strong> Wolf <strong>Fire</strong> on California’s Los Padres National Forest,<br />
which would burn 21,645 acres before be<strong>in</strong>g controlled on June 30 th , and rack up an <strong>in</strong>credible<br />
(for its size) $18 million <strong>in</strong> suppression costs. The Ponil <strong>Fire</strong> <strong>in</strong> New Mexico started <strong>the</strong> next<br />
day, and cost $14 million to control more than three weeks later, hav<strong>in</strong>g burned 92,194 acres.<br />
On June 5 th , two new major fires started, with <strong>the</strong> Copper <strong>Fire</strong> on <strong>the</strong> Angeles National Forest <strong>in</strong><br />
Sou<strong>the</strong>rn California burn<strong>in</strong>g 23,407 acres and <strong>the</strong> Big Wash fire <strong>in</strong> Utah burn<strong>in</strong>g 5,400 acres.<br />
The first week of June ended with <strong>the</strong> start of <strong>the</strong> Hensel <strong>Fire</strong> <strong>in</strong> Wyom<strong>in</strong>g, which burned<br />
14,730 acres.<br />
106
Figure 41. The drought picture is worsen<strong>in</strong>g <strong>in</strong> <strong>the</strong> western states.<br />
Even <strong>the</strong> south is beg<strong>in</strong>n<strong>in</strong>g to get beh<strong>in</strong>d <strong>in</strong> ra<strong>in</strong>.<br />
In Colorado, by <strong>the</strong> second<br />
week of June, fuel conditions<br />
were unprecedented with 1000-<br />
hour fuels at historic low levels,<br />
<strong>the</strong> brush fuels already below<br />
critical live fuel moisture, and<br />
<strong>the</strong> meager grass crop fully cured<br />
(Figure 41). Summer wea<strong>the</strong>r<br />
had arrived a month early, with<br />
temperatures <strong>in</strong> <strong>the</strong> 90’s, and<br />
relative humidity of 12 percent.<br />
All of <strong>the</strong> <strong>in</strong>gredients for a<br />
conflagration were all <strong>in</strong> place on<br />
June 8 th , when a FS employee<br />
deliberately started <strong>the</strong> Hayman<br />
<strong>Fire</strong> on <strong>the</strong> Pike National Forest<br />
southwest of Denver. Hayman<br />
would grow to be <strong>the</strong> largest fire<br />
<strong>in</strong> recorded Colorado history, burn<strong>in</strong>g 137,760 acres <strong>in</strong> four counties. By <strong>the</strong> time it was f<strong>in</strong>ally<br />
controlled more than a month later, <strong>the</strong> Hayman <strong>Fire</strong> would burn 600 structures, cost $45<br />
million to suppress, and devastate a major portion of <strong>the</strong> South Platte River watershed, source<br />
of much of Denver’s water supply.<br />
The Hayman <strong>Fire</strong> is <strong>the</strong> largest fire <strong>in</strong><br />
Colorado history.<br />
About 81,000 people evacuated...just<br />
<strong>in</strong> Colorado.<br />
That same day, <strong>the</strong> Coal Seam <strong>Fire</strong> started near Glenwood Spr<strong>in</strong>gs, Colorado and burned<br />
12,209 acres <strong>in</strong> <strong>the</strong> next month. As if firefighters needed more work, <strong>the</strong> next day saw <strong>the</strong> start<br />
of <strong>the</strong> Missionary Ridge <strong>Fire</strong> (70,485 acres) on <strong>the</strong> San Juan NF <strong>in</strong> southwestern Colorado. The<br />
Missionary Ridge <strong>Fire</strong> would threaten multiple communities <strong>in</strong> its three-week life span, spawn<br />
a fire tornado, and cost an astound<strong>in</strong>g $41 million dollars to control. In <strong>the</strong> months of June and<br />
July, 2002, major fires <strong>in</strong> Colorado would threaten at least 140 subdivisions all over <strong>the</strong> State,<br />
necessitat<strong>in</strong>g <strong>the</strong> evacuation of about 81,000 people.<br />
Just to keep <strong>the</strong> few uncommitted fire crews on <strong>the</strong>ir toes, <strong>the</strong> Blue Cut <strong>Fire</strong> on Sou<strong>the</strong>rn<br />
California’s San Bernard<strong>in</strong>o National Forest started its rampage across 6,864 acres on June 16 th .<br />
107
The Rodeo-Chediski <strong>Fire</strong> burned more<br />
than 100,000 acres <strong>in</strong> one day!<br />
While great numbers of suppression resources were be<strong>in</strong>g committed to <strong>the</strong> Hayman and<br />
o<strong>the</strong>r Colorado fires, Arizona was about to break back <strong>in</strong>to <strong>the</strong> big fire spotlight. The Bureau of<br />
Indian Affairs (BIA) Fort Apache Agency, with fire protection jurisdiction for <strong>the</strong> 1.6 million<br />
acre White Mounta<strong>in</strong> Apache Indian Reservation had sent crews, eng<strong>in</strong>es, and overhead to<br />
Colorado, and was pa<strong>in</strong>fully aware of <strong>the</strong> shortage of air tankers, helicopters, and Type 1 crews.<br />
On June 18 th , at about 1600 hours, <strong>the</strong> Rodeo <strong>Fire</strong> started about 2 miles nor<strong>the</strong>ast of <strong>the</strong> town of<br />
Cibecue, <strong>in</strong> <strong>the</strong> northwest corner of <strong>the</strong> reservation. With record low fuel moisture and humidity<br />
(2%), <strong>the</strong> fire, set by an Indian fire crew member <strong>in</strong> hopes of employment, burned 15 acres<br />
<strong>in</strong> <strong>the</strong> first 13 m<strong>in</strong>utes and established a good lead over <strong>the</strong> <strong>in</strong>itial attack resources. Two days<br />
later, with a major fire at hand and scarce resources f<strong>in</strong>ally start<strong>in</strong>g to arrive <strong>in</strong> stag<strong>in</strong>g areas, <strong>the</strong><br />
Fort Apache Agency received a report of a new fire, this one started by a lost hiker. BIA immediately<br />
diverted air resources from <strong>the</strong> Rodeo <strong>Fire</strong> and heavily augmented <strong>the</strong> <strong>in</strong>itial attack<br />
dispatch with ground resources from stag<strong>in</strong>g, nearly conta<strong>in</strong><strong>in</strong>g <strong>the</strong> Chediski fire at about 40<br />
acres. But <strong>the</strong> w<strong>in</strong>d kicked up, <strong>the</strong> fire spotted across shaky conta<strong>in</strong>ment l<strong>in</strong>es, hit <strong>the</strong> extra dry<br />
timber, and quickly spread to more than 10,000 acres by nightfall. Both fires were plume<br />
dom<strong>in</strong>ated forest fires, with frequent collapses of <strong>the</strong> thunderheads atop <strong>the</strong> convection columns<br />
spread<strong>in</strong>g fire <strong>in</strong> all directions each afternoon. Once <strong>the</strong> two fires merged on June 23 rd , not even<br />
<strong>the</strong> bare rock face of <strong>the</strong> Mogollon Rim could keep <strong>the</strong>m from spread<strong>in</strong>g north and threaten<strong>in</strong>g<br />
a dozen resort and summer home communities at <strong>the</strong> edge of <strong>the</strong> Apache-Sitgreaves National<br />
Forest. In <strong>the</strong> end, <strong>the</strong> Rodeo-Chediski <strong>Fire</strong> would become <strong>the</strong> largest <strong>in</strong> Arizona history and<br />
easily <strong>the</strong> biggest fire <strong>in</strong> <strong>the</strong> <strong>West</strong> <strong>in</strong> many decades (at least for about a month). The f<strong>in</strong>al toll<br />
was 468,863 acres, with 466 structures and 400 million board feet of timber destroyed. In one<br />
day (June 23 rd ), <strong>the</strong> fire burned more than 100,000 acres! Suppression costs were estimated at<br />
$60 to 70 million, but damages are still be<strong>in</strong>g calculated. Arizona was certa<strong>in</strong>ly back <strong>in</strong> <strong>the</strong> fire<br />
news.<br />
But June’s fire legacy was not over yet over for Colorado. On June 19 th , <strong>the</strong> undervalued<br />
Million <strong>Fire</strong> ($9,400,000 suppression cost) was started on <strong>the</strong> Rio Grande National Forest and<br />
burned 9,346 acres before be<strong>in</strong>g controlled. Three days later, <strong>the</strong> Spr<strong>in</strong>g Creek Complex of<br />
lightn<strong>in</strong>g fires broke out on <strong>the</strong> White River National Forest <strong>in</strong> west central Colorado, burn<strong>in</strong>g<br />
13,490 acres <strong>in</strong> <strong>the</strong> next month. Dur<strong>in</strong>g this same period, major fires started <strong>in</strong> New Mexico,<br />
with <strong>the</strong> Roybal Complex of lightn<strong>in</strong>g fires burn<strong>in</strong>g 5,666 acres by <strong>the</strong> end of June, and <strong>in</strong> Utah,<br />
where <strong>the</strong> Rattle Complex burned until August, cover<strong>in</strong>g 94,519 acres. The last of <strong>the</strong> major<br />
fires to start <strong>in</strong> June was <strong>the</strong> Grizzly Gulch <strong>Fire</strong> <strong>in</strong> South Dakota, which burned 10,771 acres<br />
between June 29 th and July 23 rd .<br />
108
While <strong>the</strong>se major fires cont<strong>in</strong>ued to burn, <strong>the</strong> first week <strong>in</strong> July brought progress. The<br />
situation report for Monday, July 8 th noted that although 244 new fires had been reported <strong>the</strong><br />
previous day, only seven of <strong>the</strong>m became large fires, and six exist<strong>in</strong>g large fires had been<br />
controlled. All of this activity occurred on a day when 25 major fires were still burn<strong>in</strong>g <strong>in</strong> <strong>the</strong><br />
<strong>West</strong>. W<strong>in</strong>dy, hot, and dry wea<strong>the</strong>r was forecast to cont<strong>in</strong>ue, with Wyom<strong>in</strong>g targeted for highest<br />
fire danger. But on July 9 th , <strong>the</strong> appropriately named Burn Canyon <strong>Fire</strong> (31,300 acres) on <strong>the</strong><br />
Grand Mesa National Forest <strong>in</strong> west central Colorado and <strong>the</strong> Eyerly Complex of lightn<strong>in</strong>g fires<br />
(23,573 acres) <strong>in</strong> Oregon started, edg<strong>in</strong>g <strong>the</strong> stubborn Mule <strong>Fire</strong> (3,932 acres), which started <strong>in</strong><br />
Wyom<strong>in</strong>g <strong>the</strong> next day, out of <strong>the</strong> headl<strong>in</strong>es.<br />
July 12 th brought dry thunderstorms to central and sou<strong>the</strong>rn Oregon, touch<strong>in</strong>g off hundreds<br />
of new fires (Figure 42). The largest of <strong>the</strong>se would be <strong>the</strong> Toolbox Complex on <strong>the</strong> Fremont<br />
National Forest <strong>in</strong> south-central Oregon, which would burn more than 120,000 acres before<br />
be<strong>in</strong>g f<strong>in</strong>ally controlled nearly two months later. The Monument-Malheur Complex (44,062<br />
acres) on <strong>the</strong> Malheur National Forest, <strong>the</strong> North Umpqua Complex (1,663 acres) and <strong>the</strong> Tiller<br />
Complex (69,000 acres) on <strong>the</strong> Umpqua National Forest, and <strong>the</strong> W<strong>in</strong>ter <strong>Fire</strong> (35,779 acres) <strong>in</strong><br />
<strong>the</strong> jurisdiction of <strong>the</strong> Oregon Department of <strong>Forestry</strong> (ODF) also started on that day. The next<br />
day brought <strong>the</strong> discovery of<br />
many new fires, three of which<br />
would grow to become major<br />
fires. The 747 Complex, on <strong>the</strong><br />
O & C timberlands of <strong>the</strong> BLM,<br />
with fire protection contracted to<br />
<strong>the</strong> ODF, would grow to 16,856<br />
acres before be<strong>in</strong>g controlled on<br />
August 5 th . The Sour Biscuit<br />
Complex on <strong>the</strong> Siskiyou National<br />
Forest <strong>in</strong> southwestern<br />
Oregon would burn 41,897 acres<br />
and cost $8 million to suppress.<br />
But <strong>the</strong> “mo<strong>the</strong>r of all fires” for<br />
<strong>the</strong> 2002 fire season was also<br />
discovered on <strong>the</strong> Siskiyou<br />
National Forest. Renamed <strong>the</strong><br />
Biscuit <strong>Fire</strong> after smaller fires<br />
Figure 42. The situation isn’t chang<strong>in</strong>g <strong>in</strong> <strong>the</strong> west. Colorado,<br />
Arizona and New Mexico are ripe for major fires.<br />
On a typical day <strong>in</strong> <strong>the</strong> middle of fire<br />
season, 25-30 major fires were<br />
burn<strong>in</strong>g.<br />
Dry lightn<strong>in</strong>g hit Oregon hard!<br />
109
Giant sequoia groves threatened by<br />
McNally <strong>Fire</strong>.<br />
P<strong>in</strong>e <strong>Fire</strong> destroys 153 structures.<br />
merged, this monster would burn nearly one half million acres, <strong>in</strong>clud<strong>in</strong>g nearly all of <strong>the</strong><br />
Kalmiopsis Wilderness Area, threaten several towns (only 13 structures were lost), and burn<br />
<strong>in</strong>to California’s Smith River National Recreation Area before be<strong>in</strong>g f<strong>in</strong>ally controlled on<br />
September 30 th follow<strong>in</strong>g wett<strong>in</strong>g ra<strong>in</strong>s. Suppression costs for <strong>the</strong> Biscuit <strong>Fire</strong> were estimated at<br />
an unbelievable $149 million.<br />
While Oregon bore <strong>the</strong> brunt of <strong>the</strong> new major fire bus<strong>in</strong>ess for much of July, significant<br />
new large fires cropped up elsewhere. On July 12 th , <strong>the</strong> Gate Complex of lightn<strong>in</strong>g fires near<br />
Carson City on <strong>the</strong> Humboldt-Toiyabe National Forest started, eventually burn<strong>in</strong>g 9,900 acres<br />
and gett<strong>in</strong>g Nevada on <strong>the</strong> charts. On July 15 th , <strong>the</strong> Deer Po<strong>in</strong>t <strong>Fire</strong> started <strong>in</strong> Wash<strong>in</strong>gton’s<br />
Wenatchee National Forest, spread<strong>in</strong>g across more than 42,000 acres, and runn<strong>in</strong>g up $15<br />
million <strong>in</strong> suppression costs. Far to <strong>the</strong> south, <strong>the</strong> McNally <strong>Fire</strong> started <strong>in</strong> <strong>the</strong> Kern River<br />
watershed of <strong>the</strong> Sequoia National Forest <strong>in</strong> California on July 21 st . In its 64-day life, <strong>the</strong><br />
McNally <strong>Fire</strong> would become <strong>the</strong> biggest fire <strong>in</strong> <strong>the</strong> history of <strong>the</strong> Sequoia National Forest (well<br />
known for major fires) at 150,000 acres, threaten some of <strong>the</strong> largest stands of Giant Sequoia<br />
trees, and provide lots of photo ops for <strong>the</strong> Sou<strong>the</strong>rn California news media. This fire, which<br />
cost $59 million to suppress, also was set by an irrational human be<strong>in</strong>g. The next day, <strong>the</strong><br />
lightn<strong>in</strong>g-caused Stanza <strong>Fire</strong> on <strong>the</strong> Klamath National Forest <strong>in</strong> far nor<strong>the</strong>rn California began<br />
burn<strong>in</strong>g 2,880 acres. Also on July 22 nd , <strong>the</strong> Garden Valley Complex of lightn<strong>in</strong>g fires started on<br />
<strong>the</strong> Boise National Forest <strong>in</strong> Idaho, eventually burn<strong>in</strong>g only 1,131 acres, but cost<strong>in</strong>g over $8<br />
million to suppress.<br />
The last two major fires to start <strong>in</strong> July were <strong>the</strong> East Fork <strong>in</strong> Utah on <strong>the</strong> Wasatch-Cache<br />
National Forest on <strong>the</strong> 28 th , and <strong>the</strong> P<strong>in</strong>es <strong>Fire</strong> <strong>in</strong> <strong>the</strong> California Department of <strong>Forestry</strong> and <strong>Fire</strong><br />
Protection’s San Diego Unit on <strong>the</strong> 29 th . The P<strong>in</strong>es <strong>Fire</strong> would cover 61,690 acres of rugged<br />
chaparral mounta<strong>in</strong>s and destroy 153 structures before be<strong>in</strong>g controlled on August 22 nd at a cost<br />
of $27 million. The situation report for July 30, 2002 noted 32 major fires burn<strong>in</strong>g <strong>in</strong> <strong>the</strong> <strong>West</strong>,<br />
and forecast a warn<strong>in</strong>g for dry lightn<strong>in</strong>g and gusty w<strong>in</strong>ds <strong>in</strong> Montana.<br />
The first two weeks of August brought a break <strong>in</strong> new major fire occurrence, but th<strong>in</strong>gs<br />
began to pick up around <strong>the</strong> middle of <strong>the</strong> month. On August 12 th , <strong>the</strong> Mount Zirkel Complex<br />
of lightn<strong>in</strong>g fires started, burn<strong>in</strong>g 31,016 acres on <strong>the</strong> Routt National Forest <strong>in</strong> north-central<br />
Colorado. On <strong>the</strong> 16 th , <strong>the</strong> Apple <strong>Fire</strong> started on <strong>the</strong> Umpqua National Forest <strong>in</strong> Oregon, burn<strong>in</strong>g<br />
17,600 acres with more than $18 million <strong>in</strong> suppression costs.<br />
110
Also on <strong>the</strong> 16 th of August, <strong>the</strong> Battle Creek <strong>Fire</strong> <strong>in</strong> South Dakota started its run across 13,700<br />
acres. August wound down with only one more new major fire, <strong>the</strong> Commissary Ridge <strong>Fire</strong>, which<br />
burned 3,500 acres <strong>in</strong> Wyom<strong>in</strong>g.<br />
September started off with a bang, with <strong>the</strong> Curve <strong>Fire</strong> on Sou<strong>the</strong>rn California’s Angeles<br />
National Forest burn<strong>in</strong>g 20,857 acres (and 73 structures), with suppression costs total<strong>in</strong>g more than<br />
$14 million. Comparative peace and quiet reigned for most of <strong>the</strong> rest of September, with major fires<br />
all over <strong>the</strong> <strong>West</strong> be<strong>in</strong>g brought under control and many weary fire crews f<strong>in</strong>ally return<strong>in</strong>g to <strong>the</strong>ir<br />
home bases. A series of fires <strong>in</strong> California near <strong>the</strong> end of <strong>the</strong> month rounded out <strong>the</strong> 2002 <strong>Fire</strong><br />
Season. The Williams <strong>Fire</strong> on <strong>the</strong> Angeles National Forest burned 36,530 acres and 76 structures<br />
start<strong>in</strong>g on <strong>the</strong> 22 nd of September. The Croy <strong>Fire</strong> <strong>in</strong> CDF’s Santa Clara Unit burned 3,127 acres and<br />
34 structures on <strong>the</strong> 23 rd . The Cone <strong>Fire</strong> on <strong>the</strong> Lassen National Forest <strong>in</strong> nor<strong>the</strong>astern California was<br />
<strong>the</strong> last major fire of <strong>the</strong> season, burn<strong>in</strong>g 2,006 acres start<strong>in</strong>g on <strong>the</strong> 26 th .<br />
Lightn<strong>in</strong>g was aga<strong>in</strong> <strong>the</strong> primary<br />
cause of major fires, but several were<br />
arson.<br />
Summary<br />
The 2002 <strong>Fire</strong> Season, while not quite as big as <strong>the</strong> 2000 <strong>Fire</strong> Season, will never<strong>the</strong>less go<br />
down <strong>in</strong> <strong>the</strong> record books:<br />
· Federal <strong>Fire</strong>s 17,000 for 4.5 million acres.<br />
· State <strong>Fire</strong>s 67,000 for 2.6 million acres.<br />
· Total <strong>Fire</strong>s 87,000 for 7.3 million acres.<br />
Observations and Success Stories<br />
As happened <strong>in</strong> <strong>the</strong> 2000 <strong>Fire</strong> Season, this year <strong>the</strong> primary cause of <strong>the</strong> major fires <strong>in</strong> <strong>the</strong> west<br />
was lightn<strong>in</strong>g, and most orig<strong>in</strong>ated on federal land. Given that <strong>the</strong> National Forest and Public Doma<strong>in</strong><br />
lands <strong>in</strong> <strong>the</strong> <strong>West</strong> conta<strong>in</strong> some of <strong>the</strong> highest mounta<strong>in</strong>s and most remote, unpopulated area, it<br />
is to be expected that <strong>the</strong>se areas would receive <strong>the</strong> biggest share of lightn<strong>in</strong>g. Given that:<br />
• The Federal lands, especially <strong>the</strong> National Forests, have gone nearly unmanaged dur<strong>in</strong>g <strong>the</strong><br />
“analysis paralysis” of <strong>the</strong> past decade, it is reasonable to expect that it will be more difficult to<br />
control multiple fires <strong>in</strong> <strong>the</strong>se decadent forest and brush lands;<br />
• The <strong>West</strong> was <strong>in</strong> a state of severe to extreme drought this summer, it is reasonable to expect<br />
that fires would burn with <strong>in</strong>creased <strong>in</strong>tensity and be more resistant to control;<br />
111
• There were 25-35 major fires burn<strong>in</strong>g at any time dur<strong>in</strong>g <strong>the</strong> fire season (Figures 43), it is<br />
reasonable to expect that <strong>the</strong>re would be significant shortages of scarce suppression resources,<br />
especially air tankers and helicopters;<br />
• The wildland/urban <strong>in</strong>terface <strong>in</strong> <strong>the</strong> <strong>West</strong> cont<strong>in</strong>ues to expand, it is reasonable to expect that<br />
large numbers of structures may be threatened by any major fire;<br />
• Few states have str<strong>in</strong>gent <strong>Fire</strong>Safe regulations and a large proportion of property owners <strong>in</strong><br />
<strong>the</strong> wildland/urban <strong>in</strong>terface are still resistant to creat<strong>in</strong>g and ma<strong>in</strong>ta<strong>in</strong><strong>in</strong>g defensible space<br />
around <strong>the</strong>ir homes, it is reasonable to expect that large numbers of structures will be lost <strong>in</strong><br />
major fires;<br />
Shortages of limited resources (e.g.,<br />
airtankers, helicopters) persisted<br />
throughout <strong>the</strong> fire season.<br />
• <strong>Fire</strong>s under <strong>the</strong>se conditions will burn erratically, it is to be expected that firefighters and<br />
civilians will be endangered, <strong>in</strong>jured, and killed fight<strong>in</strong>g wildfires;<br />
• Some agencies are still reluctant to enter <strong>in</strong>to closest resource cooperative agreements, and<br />
fail to do advance strategic and operational plann<strong>in</strong>g and jo<strong>in</strong>t tra<strong>in</strong><strong>in</strong>g with adjacent agencies, it<br />
is to be expected that some fires will be mismanaged, escape <strong>in</strong>itial attack, and grow too large<br />
to handle until <strong>the</strong> wea<strong>the</strong>r moderates;<br />
• Many local rural fire departments are under staffed, under tra<strong>in</strong>ed, and under equipped, it is<br />
reasonable to expect that many fires will escape <strong>in</strong>itial attack suppression efforts;<br />
• Many local governments th<strong>in</strong>k that hazard reduction is not <strong>the</strong>ir responsibility, it is reasonable<br />
to expect that <strong>the</strong> WUI problem will cont<strong>in</strong>ue to worsen; and<br />
• These larger, more <strong>in</strong>tense fires are more difficult to suppress and threaten more structures<br />
each year, it is reasonable to expect that suppression costs will be horrendous.<br />
<strong>Fire</strong> Season 2002 certa<strong>in</strong>ly met all of <strong>the</strong>se expectations. While <strong>the</strong> total acreage burned may<br />
not exceed that of 2000, <strong>the</strong> fires were every bit as bad, and <strong>the</strong> toll on our forests, soils, watersheds,<br />
wildlife, scenery, homes, and local economies were just as devastat<strong>in</strong>g.<br />
112
Despite <strong>the</strong> bad news, <strong>the</strong>re are success<br />
stories and important lessons hidden by <strong>the</strong><br />
smoke from <strong>the</strong> fires of 2002:<br />
• Crown fires generally dropped down to<br />
<strong>the</strong> surface wherever <strong>the</strong>y encountered fuel<br />
reduction projects or old burns, prov<strong>in</strong>g that<br />
such projects make wildfires easier to<br />
conta<strong>in</strong>.<br />
• Much of <strong>the</strong> hazard reduction work be<strong>in</strong>g<br />
funded by <strong>the</strong> National <strong>Fire</strong> Plan is be<strong>in</strong>g<br />
done <strong>in</strong> strategic locations that will help<br />
protect communities from wildfires.<br />
• Efforts by agencies to work cooperatively<br />
pay off when time comes to operate under<br />
Area Command teams or MACS groups,<br />
because <strong>the</strong> players know each o<strong>the</strong>r, <strong>the</strong><br />
rules of <strong>the</strong> game, and what to expect from<br />
each agency <strong>in</strong>volved.<br />
• Wildland fire tra<strong>in</strong><strong>in</strong>g provided to local<br />
fire agencies makes <strong>the</strong>m a useful part of fire<br />
control efforts, ra<strong>the</strong>r than a pa<strong>in</strong> <strong>in</strong> <strong>the</strong> rear.<br />
• When agencies cooperate, limited funds<br />
can be leveraged with o<strong>the</strong>r fund<strong>in</strong>g sources<br />
and volunteer efforts to accomplish larger<br />
projects.<br />
• Preplann<strong>in</strong>g, jo<strong>in</strong>t tra<strong>in</strong><strong>in</strong>g, hazard reduction,<br />
closest resource <strong>in</strong>teragency response,<br />
and <strong>in</strong>teragency local <strong>in</strong>cident management<br />
teams pay off <strong>in</strong> fires <strong>in</strong> <strong>the</strong> wildland/urban<br />
<strong>in</strong>terface conta<strong>in</strong>ed early, with m<strong>in</strong>imal<br />
structure loss.<br />
Large and Damag<strong>in</strong>g <strong>Fire</strong>s 2002 <strong>Fire</strong> Season<br />
Arizona<br />
California<br />
Colorado<br />
Idaho<br />
New Mexico<br />
Nevada<br />
Oregon<br />
South Dakota<br />
Utah<br />
Wash<strong>in</strong>gton<br />
Wyom<strong>in</strong>g<br />
May June July August September October<br />
21 Bullock, 30,563 ac, 7 structures<br />
21 Rodeo/Chediski Complex, 468,638 ac, 496 structures<br />
15 Pack Rat Complex, 3,470 ac<br />
1 Wolf, 21,645 ac<br />
5 Cooper, 23,407 ac. 26 structures<br />
16 Bluecut, 6,864 ac<br />
13 Mussol<strong>in</strong>i, 3,260 ac<br />
21 McNally, 150,696 ac<br />
22 Stanza, 2,880ac<br />
29 P<strong>in</strong>es, 61,690 ac, 153 structures<br />
1 Curve, 20,857 ac, 73 structures<br />
22 Williams, 36,530 ac, 76 structures<br />
23 Croy, 3,127 ac, 34 structures<br />
26 Cone, 2,006 ac<br />
21 Schoonover, 3860 ac. 13 structures<br />
8 Coal Seam, 12,209 ac, 43 structures<br />
8 Hayman, 137,760 ac, 600 structures<br />
9 Missionary Ridge, 70,662 ac, 77 structures<br />
19 Million, 9,346 ac, 13 structures<br />
22 Spr<strong>in</strong>g Creek Complex, 13,490 ac<br />
9 Burn Canyon, 31,300 ac<br />
14 Green Creek, 4,400 ac<br />
17 Big Elk, 4,413 ac, 3 deaths<br />
12 Mt Zirkel, 31,016 ac<br />
22 Borrego, 12,995 ac, 1 structure<br />
2 Ponil, 9,194 ac<br />
13 Roybal, 5,666 ac<br />
Figure 43. There were over 40 major fires <strong>in</strong> <strong>the</strong> <strong>West</strong>.<br />
113<br />
Month<br />
22 Garden Valley Complex, 1,131 ac<br />
12 Gate Complex, 9,900 ac, 2 structures<br />
9 Eyerly Complex, 23,573 ac, 37 structures<br />
12 North Umpqua Complex, 1,663 ac<br />
12 Tool Box Complex, 120,085 ac<br />
12 Monument-Malheur Complex, 44,062 ac<br />
12 W<strong>in</strong>ter, 35,894 ac, 5 structures<br />
12 Tiller Complex, 69,000 ac<br />
13 Biscuit (Florence) 499,945 ac, 13 structures<br />
13 Sour Biscuit, 41,897 ac<br />
13 747 Complex, 16,856<br />
23 Cache Mounta<strong>in</strong>, 4,200 ac<br />
29 Grizzly Gulch, 10,771 ac, 22 structures<br />
16 Battle Creek, 13,700 ac, 4 structures<br />
31 Sanford, 64,909 ac<br />
5 Big Wash, 5,400 ac<br />
20 Rattle Complex, 94,519 ac, 2 structures<br />
28 East Fork, 14,208 ac, 55 structures<br />
15 Deer Po<strong>in</strong>t, 42,674 ac, 5 structures<br />
7 Hensel, 14,730 ac, 7 structures<br />
11 Mule, 3,932 ac<br />
29 Commissary Ridge, 3,500 ac, 2 structures
Safety and Wildland <strong>Fire</strong>fight<strong>in</strong>g Strategy<br />
When <strong>in</strong> offensive mode, you go after<br />
<strong>the</strong> fire.<br />
When <strong>in</strong> defensive mode, you protect<br />
valuable property.<br />
When <strong>in</strong> avoidance, you avoid risk at<br />
all cost.<br />
A strategy is a consciously selected approach to achiev<strong>in</strong>g a goal. In wildland firefight<strong>in</strong>g,<br />
<strong>the</strong> goal is frequently to first conta<strong>in</strong> (stop <strong>the</strong> spread) and <strong>the</strong>n control (ext<strong>in</strong>guish) <strong>the</strong> fire.<br />
Sometimes <strong>the</strong> goal may be modified with qualifiers such as time constra<strong>in</strong>ts, adm<strong>in</strong>istrative<br />
restra<strong>in</strong>ts, or fiscal limitations, thus complicat<strong>in</strong>g <strong>the</strong> fire manager’s mission. Selection of an<br />
appropriate strategy early <strong>in</strong> <strong>the</strong> game is one of <strong>the</strong> keys to successful firefight<strong>in</strong>g.<br />
Offensive Strategy<br />
An offensive strategy is one <strong>in</strong> which <strong>the</strong> fire manager elects to use his resources to go<br />
after <strong>the</strong> fire “here and now”; i.e. under <strong>the</strong> conditions as <strong>the</strong>y currently exist <strong>in</strong> <strong>the</strong> place <strong>the</strong><br />
fire is now located. This is not necessarily direct attack <strong>in</strong> which suppression resources must<br />
work directly on <strong>the</strong> fire edge, but more a philosophical choice about which has <strong>the</strong> upper hand<br />
at <strong>the</strong> moment, <strong>the</strong> fire or <strong>the</strong> suppression force. An offensive strategy is <strong>the</strong> correct choice<br />
when <strong>the</strong> current and expected fire behavior is with<strong>in</strong> parameters that allow available suppression<br />
resources to be effective and <strong>the</strong> location of <strong>the</strong> fire is readily accessible to <strong>the</strong> suppression<br />
force. A roadside grass fire on a normal summer afternoon is an example of a situation where an<br />
offensive strategy is appropriate.<br />
Defensive Strategy<br />
A defensive strategy is one <strong>in</strong> which <strong>the</strong> fire manager decides that direct attack on <strong>the</strong><br />
fire under current conditions or <strong>in</strong> its present location is not practical and it is prudent to back<br />
off to a more advantageous location or wait for conditions to change. A defensive strategy is <strong>the</strong><br />
correct choice when fire behavior exceeds <strong>the</strong> capabilities of <strong>the</strong> available suppression resources,<br />
or <strong>the</strong> fire is not immediately accessible to <strong>the</strong> suppression force. A runn<strong>in</strong>g brush fire<br />
on a steep slope with no road access for ground resources is an example of a situation where a<br />
defensive strategy, such as back<strong>in</strong>g off to a ridgetop road for a fir<strong>in</strong>g operation well <strong>in</strong> advance<br />
of <strong>the</strong> fire head, may be appropriate.<br />
Avoidance Strategy<br />
Avoidance strategy is where <strong>the</strong> fire manager decides not to confront <strong>the</strong> fire at all, thus<br />
avoid<strong>in</strong>g <strong>the</strong> risk of select<strong>in</strong>g an <strong>in</strong>appropriate strategy. This situation occurs not because a fire<br />
manager has “chickened out”, but because an agency has created a set of constra<strong>in</strong>ts on <strong>the</strong> fire<br />
manager that are so onerous as to preclude any chance of success.<br />
114
The fire manager is forced to withdraw <strong>the</strong> suppression force completely and retreat to <strong>the</strong><br />
relative safety of an adm<strong>in</strong>istrative facility to await a change <strong>in</strong> conditions that would <strong>in</strong>validate<br />
<strong>the</strong> constra<strong>in</strong>ts. An example of avoidance strategy would be <strong>the</strong> current “disengagement criteria”<br />
foisted on <strong>the</strong> Forest Service by OSHA <strong>in</strong> <strong>the</strong> aftermath of <strong>the</strong> unnecessary firefighter<br />
fatalities on <strong>the</strong> Thirty Mile <strong>Fire</strong>.<br />
Recently <strong>the</strong>re has been considerable debate, mostly <strong>in</strong>itiated by <strong>the</strong> <strong>in</strong>experienced and<br />
subscribed to by <strong>the</strong> uniformed, that <strong>Fire</strong> Order #1: “Fight fire aggressively, but provide for<br />
safety first” is an oxymoron. That is to say that aggressive firefight<strong>in</strong>g is <strong>in</strong>herently unsafe. This<br />
erroneous hypo<strong>the</strong>sis has lead to <strong>the</strong> new vision of firefighter safety espoused <strong>in</strong> <strong>the</strong> Thirty Mile<br />
<strong>Fire</strong> OSHA report that firefighters should be removed from exposure to heat and smoke when a<br />
wildfire is active enough to be “dangerous”. This has resulted <strong>in</strong> <strong>the</strong> totally new concept of<br />
“disengagement criteria” under which, when <strong>the</strong> fire acts up, everybody goes home.<br />
<strong>Fire</strong> Order #1: Fight fire aggressivley,<br />
but provide for safety first.<br />
The problem with <strong>the</strong> concept of disengagement is that it assumes wildfires are homogenous<br />
masses of light source energy that can be measured and compared to a set of arbitrary<br />
criteria, result<strong>in</strong>g <strong>in</strong> a scientifically correct answer to an unanswerable question. <strong>Fire</strong>s are not<br />
homogeneous, and even <strong>in</strong> <strong>the</strong> worst fire behavior conditions, <strong>the</strong>re are places and circumstances<br />
on nearly every fire where effective fire control work can be done <strong>in</strong> relative safety. On<br />
a w<strong>in</strong>d-driven fire, this means start<strong>in</strong>g at <strong>the</strong> heel and work<strong>in</strong>g <strong>the</strong> flanks, avoid<strong>in</strong>g <strong>the</strong> dangerous<br />
head of <strong>the</strong> fire until <strong>the</strong> w<strong>in</strong>d dies down. On a high <strong>in</strong>tensity timber fire it means back<strong>in</strong>g<br />
off and construct<strong>in</strong>g <strong>in</strong>direct control l<strong>in</strong>es well <strong>in</strong> advance of <strong>the</strong> fire front. It means stay<strong>in</strong>g out<br />
of chimneys above chaparral brush fields where fires can quickly flare up. It means mak<strong>in</strong>g a<br />
concentrated control effort <strong>in</strong> those places that are relatively safe at those times when fire<br />
<strong>in</strong>tensity is least (e.g. night).<br />
Total disengagement from a wildfire is not a safety enhancement, it is a dereliction of<br />
duty. While <strong>the</strong>re may be times <strong>in</strong> <strong>the</strong> worst of fire behavior situations where <strong>the</strong> most prudent<br />
course of action is to fall back, retreat should never become surrender. When forced to leave a<br />
section of l<strong>in</strong>e, firefighters should regroup, reassess, redeploy, ga<strong>in</strong> additional suppression<br />
resources, and recommit at ano<strong>the</strong>r location where <strong>the</strong>y can effectively employ productive<br />
tactics.<br />
115
Disengagement allows a fire to grow larger, burn more <strong>in</strong>tensely, and threaten more resources,<br />
property, and people. Disengagement is <strong>in</strong>action ra<strong>the</strong>r than action. Disengagement is<br />
admitt<strong>in</strong>g you don’t know what you are do<strong>in</strong>g.<br />
Failure to fight fire strategically and aggressively actually <strong>in</strong>creases <strong>the</strong> level of danger<br />
to which firefighters and civilians may be exposed by allow<strong>in</strong>g fires to become larger, more<br />
<strong>in</strong>tense, and longer lived. Disengagement is not a solution to firefighter <strong>in</strong>juries and deaths; it is<br />
only an avoidance strategy.<br />
Failure to fight fire aggressively actually<br />
<strong>in</strong>creases <strong>the</strong> level of danger.<br />
Effectively implement<strong>in</strong>g <strong>Fire</strong> Order #1 should be <strong>the</strong> first priority of all wildland fire<br />
agencies. <strong>Fire</strong>fighter safety can be enhanced by:<br />
• Improv<strong>in</strong>g <strong>the</strong> level of tra<strong>in</strong><strong>in</strong>g and experience of firel<strong>in</strong>e supervisors;<br />
• Improv<strong>in</strong>g <strong>the</strong> level of fire behavior tra<strong>in</strong><strong>in</strong>g made available to all firefighters;<br />
• Equipp<strong>in</strong>g each firefighter with a portable radio and a smoke mask;<br />
• Establish<strong>in</strong>g defensible space around structures worth protect<strong>in</strong>g;<br />
• Provid<strong>in</strong>g appropriate command and control of suppression forces;<br />
• Obta<strong>in</strong><strong>in</strong>g more reliable and efficient fire apparatus;<br />
• Establish<strong>in</strong>g automatic/mutual aid agreements to improve <strong>the</strong> availability of scarce<br />
resources;<br />
• Reduc<strong>in</strong>g <strong>the</strong> reliance on contract fire crews;<br />
• Utiliz<strong>in</strong>g air tankers for <strong>in</strong>itial attack.<br />
Avoid<strong>in</strong>g <strong>the</strong> avoidance strategy situations should become a mantra for fire managers, for<br />
avoidance strategy robs you of choices and commits you to a predeterm<strong>in</strong>ed, and probably<br />
<strong>in</strong>appropriate, action.<br />
116
Why <strong>Fire</strong>s Will Get Bigger, Costlier and more Damag<strong>in</strong>g<br />
In our <strong>in</strong>vestigation of major fires <strong>in</strong> recent years, several major factors are frequently<br />
identified that can expla<strong>in</strong> why fires cont<strong>in</strong>ue to get bigger and more expensive to control. In<br />
most major fires, two or more of <strong>the</strong>se factors comb<strong>in</strong>e to result <strong>in</strong> a fire that is beyond <strong>the</strong><br />
capability of <strong>the</strong> suppression system to control until one or more of <strong>the</strong>se factors is reduced or<br />
elim<strong>in</strong>ated. The concept is similar to accident <strong>in</strong>vestigation <strong>the</strong>ory, where usually several “little”<br />
factors add up to serious consequences.<br />
Contribut<strong>in</strong>g Factors<br />
To illustrate this concept, we developed a sidebar graphic, Why fires will get bigger!, to<br />
highlight <strong>the</strong> presence or absence of <strong>the</strong>se contribut<strong>in</strong>g factors <strong>in</strong> any given fire story.<br />
Follow<strong>in</strong>g is a more detailed explanation of <strong>the</strong> components of each<br />
of <strong>the</strong>se significant factors:<br />
Wea<strong>the</strong>r Conditions<br />
• Drought <strong>in</strong>cludes warmer, drier<br />
wea<strong>the</strong>r mak<strong>in</strong>g fire danger higher;<br />
• W<strong>in</strong>d has greater <strong>in</strong>fluence on high<br />
<strong>in</strong>tensity fires;<br />
• More ignitions are likely <strong>in</strong> warm,<br />
dry wea<strong>the</strong>r;<br />
• Hot wea<strong>the</strong>r reduces firefighter<br />
effectiveness;<br />
• Vegetation is drier and more flammable;<br />
• The dead-live fuel ratio <strong>in</strong> most<br />
species is higher;<br />
117
• Drier fuels are easier to ignite;<br />
• Drier fuels burn with greater <strong>in</strong>tensity and<br />
are more difficult to ext<strong>in</strong>guish;<br />
• Water sources may be less available.<br />
Fuel Conditions<br />
• The high fuel volumes <strong>in</strong><br />
decadent forests;<br />
• There are more dead fuels<br />
which are highly flammable;<br />
• Heavy fuels burn with<br />
greater <strong>in</strong>tensity;<br />
• Heavy fuels are more resistant to control<br />
efforts.<br />
Wildland/Urban Interface<br />
• More people mean more fires;<br />
• Structure protection workload detracts from perimeter control effort;<br />
• More complex strategy situations are likely.<br />
Inadequate Pre-suppression<br />
• Lack of fuelbreaks/firebreaks makes conta<strong>in</strong>ment more difficult;<br />
• Lack of th<strong>in</strong>n<strong>in</strong>g/slash treatment makes more fuel available;<br />
• Inability to control regrowth reduces effective life span of treatment projects;<br />
118
119<br />
• Lack of prescribed burn<strong>in</strong>g<br />
means more available fuel.<br />
Failed Suppression Action<br />
• Lack of immediate, aggressive<br />
<strong>in</strong>itial attack;<br />
• Not us<strong>in</strong>g <strong>the</strong> “closest available<br />
resources” regardless of agency;<br />
• Lack of <strong>in</strong>teragency cooperation<br />
reduces efficiency;<br />
• Adm<strong>in</strong>istrative constra<strong>in</strong>ts (e.g.<br />
wilderness areas, ESA, etc.) limit<br />
suppression force effectiveness.<br />
Suppression Costs and<br />
Damages<br />
In most <strong>in</strong>stances, <strong>the</strong>se factors<br />
also contribute to <strong>the</strong> f<strong>in</strong>al cost of<br />
suppression. Not only is <strong>the</strong>re a<br />
relationship between fire size and<br />
suppression cost, <strong>the</strong>re is a relationship<br />
between fire complexity and<br />
suppression cost. Any time that a<br />
wildfire occurs <strong>in</strong> <strong>the</strong> WUI, more<br />
resources will be needed on Initial<br />
Attack to protect <strong>the</strong> structures that<br />
will immediately be threatened. <strong>Fire</strong>s<br />
<strong>in</strong> <strong>the</strong> WUI will require more air<br />
tankers and helicopters than fires <strong>in</strong> <strong>the</strong> wilderness, just to protect improvements. Frequently<br />
<strong>the</strong>se additional forces will be from outside agencies under some type of agreement for hire,<br />
driv<strong>in</strong>g up suppression costs.
Higher <strong>in</strong>tensity fires will require more people to control and take longer to ext<strong>in</strong>guish,<br />
result<strong>in</strong>g <strong>in</strong> more overtime and higher costs.<br />
As more improvements are added <strong>in</strong> <strong>the</strong> wildland/urban <strong>in</strong>terface, more structures will be<br />
lost, and damages will <strong>in</strong>crease. Higher <strong>in</strong>tensity fires will do more damage to timber, water,<br />
recreation, and soil, all of which are of <strong>in</strong>creas<strong>in</strong>g economic importance.<br />
Thus, without mitigation of as many of <strong>the</strong>se factors as possible, fires will cont<strong>in</strong>ue to get<br />
more costly, not just because <strong>the</strong>y are larger, but also because <strong>the</strong>y are more damag<strong>in</strong>g and more<br />
complex to manage.<br />
120
Major <strong>Fire</strong>s<br />
Space does not permit any worthwhile discussion of all <strong>the</strong> major fires of <strong>the</strong> 2002 fire<br />
season. The authors selected as examples two major fires <strong>in</strong> two states that we thought were<br />
especially important to understand<strong>in</strong>g <strong>the</strong> severity of <strong>the</strong> 2002 fire season. We also selected two<br />
fires <strong>in</strong> two states that did not become large, damag<strong>in</strong>g fires as worthy examples of how effective<br />
<strong>in</strong>teragency presuppression and suppression efforts can stop fires at reasonable sizes and<br />
costs, despite severe fire danger.<br />
We did not prepare a biography of <strong>the</strong> biggest fire (Biscuit – OR) because it orig<strong>in</strong>ated <strong>in</strong><br />
and burned mostly FS wilderness, a scenario covered <strong>in</strong> detail <strong>in</strong> <strong>the</strong> <strong>Fire</strong> Season 2000 report.<br />
We selected <strong>the</strong> Hayman <strong>Fire</strong> (CO) because it was multi-jurisdictional, impacted multiple<br />
NFP-funded projects, threatened and destroyed a lot of structures, and placed <strong>in</strong> jeopardy a<br />
major portion of <strong>the</strong> South Platte River watershed that is so critical to <strong>the</strong> water supply for<br />
Denver.<br />
Eight states had fires that qualified<br />
for FEMA reimbursement <strong>in</strong> 2002.<br />
We selected <strong>the</strong> Rodeo-Chediski <strong>Fire</strong> (AZ) because <strong>the</strong> starts were human-caused, <strong>the</strong> fire<br />
agency was affected by reduced availability of IA resources due to o<strong>the</strong>r major fires, fire behavior<br />
was dom<strong>in</strong>ated by drought conditions, and <strong>the</strong> fire simultaneously threatened multiple<br />
communities, some of which had NFP-funded projects.<br />
We selected <strong>the</strong> Squires Peak <strong>Fire</strong> (OR) because it occurred <strong>in</strong> an area where <strong>in</strong>teragency<br />
cooperation is good, multiple hazard reduction projects are be<strong>in</strong>g strategically coord<strong>in</strong>ated, and<br />
<strong>the</strong> area is representative of <strong>the</strong> rural wildland/urban <strong>in</strong>terface condition.<br />
We selected <strong>the</strong> Indian <strong>Fire</strong> (AZ) because it is a classic wildland/urban <strong>in</strong>terface fire<br />
problem that had a successful outcome due to effective <strong>in</strong>teragency cooperation.<br />
We hope <strong>the</strong> biographies of <strong>the</strong>se four fires conta<strong>in</strong> lessons that are important to <strong>the</strong> improvement<br />
of <strong>the</strong> wildland fire protection system <strong>in</strong> <strong>the</strong> <strong>West</strong>.<br />
121
The Squires Peak <strong>Fire</strong> – Oregon<br />
The Applegate River watershed of southwestern Oregon is an <strong>in</strong>terior bas<strong>in</strong> west of<br />
Medford that carries runoff from <strong>the</strong> Siskiyou Mounta<strong>in</strong>s northwest <strong>in</strong>to <strong>the</strong> Rogue River. The<br />
area is characterized by rugged mounta<strong>in</strong>s with many small valleys along feeder streams. Cover<br />
type is primarily mixed conifer forest with scattered, but significant, patches of oak woodland.<br />
The area is bordered to <strong>the</strong> south and <strong>the</strong> southwest by <strong>the</strong> Siskiyou National Forest, on <strong>the</strong><br />
south by <strong>the</strong> Rogue River National Forest, and on <strong>the</strong> east by private lands, mostly timber<br />
company hold<strong>in</strong>gs and large ranches.<br />
Checkerboard ownership patterns<br />
complicate fire protection projects.<br />
Much of <strong>the</strong> Applegate River watershed is a checkerboard pattern of public doma<strong>in</strong> lands<br />
and private lands. Towns are small and scattered, but much of <strong>the</strong> private land is developed and<br />
occupied. The population is <strong>in</strong>creas<strong>in</strong>g and <strong>the</strong> Wildland/Urban Interface problem is grow<strong>in</strong>g.<br />
As <strong>the</strong> lumber <strong>in</strong>dustry has decl<strong>in</strong>ed <strong>in</strong> <strong>the</strong> area and unemployment <strong>in</strong>creased, many local<br />
landowners have subdivided and sold off part of <strong>the</strong>ir hold<strong>in</strong>gs to make enough money to stay<br />
<strong>in</strong> <strong>the</strong> area. The newcomers (primarily retirees) are build<strong>in</strong>g larger homes on smaller parcels,<br />
and <strong>the</strong> growth appears to be susta<strong>in</strong>ed.<br />
The Medford District is <strong>the</strong> Bureau of Land Management’s (BLM) largest adm<strong>in</strong>istrative<br />
unit, with large blocks of commercial timberland of <strong>in</strong>creas<strong>in</strong>g value. There is a large staff<br />
dedicated to manag<strong>in</strong>g <strong>the</strong> forest resources on <strong>the</strong> public lands, which are capable of provid<strong>in</strong>g<br />
significant revenue, and are managed for susta<strong>in</strong>ed timber yield under <strong>the</strong> O and C Act of 1937.<br />
<strong>Fire</strong> Hazard and Risk<br />
The area is mixed conifer forest and oak woodland, with <strong>in</strong>terspersed patches of brush and<br />
frequent large meadows (Figures 44 and 45). Much of <strong>the</strong> forest has been logged, and is second<br />
or third generation regrowth. The climate is on <strong>the</strong> dry side, with long hot summers, and cool,<br />
moist w<strong>in</strong>ters. Much of <strong>the</strong> ra<strong>in</strong>fall is <strong>in</strong>tercepted by <strong>the</strong> Coast Range Mounta<strong>in</strong>s to <strong>the</strong> west,<br />
although <strong>the</strong> Siskiyou Mounta<strong>in</strong>s are high enough to receive substantial amounts of ra<strong>in</strong> and<br />
snow at <strong>the</strong> higher elevations. From May through October <strong>the</strong>re is little ra<strong>in</strong>fall, except from<br />
scattered thunderstorms that form over <strong>the</strong> mounta<strong>in</strong>s. Summer temperatures are frequently <strong>in</strong><br />
<strong>the</strong> 90’s and relative humidity is low. High fire danger is normal <strong>in</strong> <strong>the</strong> summer, and <strong>in</strong> normal<br />
years extreme fire danger is present for at least 30 days, longer <strong>in</strong> drought years.<br />
122
Because of <strong>the</strong> checkerboard<br />
ownership patterns, <strong>the</strong>re<br />
may be a wide variety of land<br />
management strategies <strong>in</strong> a<br />
relatively small geographic area.<br />
Little of <strong>the</strong> public land is <strong>in</strong><br />
large enough blocks to be<br />
managed on a strategic scale,<br />
and <strong>the</strong>re are not many large<br />
landowners on <strong>the</strong> private side.<br />
Much of <strong>the</strong> undeveloped land<br />
is <strong>in</strong> absentee ownership and<br />
held for speculation, with little<br />
direct <strong>in</strong>tensive management.<br />
As a result, <strong>the</strong>re has been a<br />
significant build up of fuels and<br />
much of <strong>the</strong> area is overstocked<br />
with trees and thick with brush<br />
undergrowth. Canopy closure is<br />
common and ladder fuels are<br />
abundant.<br />
Most wildfires <strong>in</strong> <strong>the</strong><br />
Applegate River watershed are<br />
human-caused, although lightn<strong>in</strong>g<br />
from thunderstorms that<br />
build up over <strong>the</strong> higher mounta<strong>in</strong>s<br />
can become a significant<br />
risk factor at times. Major<br />
lightn<strong>in</strong>g busts occurred <strong>in</strong> this<br />
area <strong>in</strong> 1987, 1995, and 2000.<br />
The Applegate River watershed<br />
is a fire-dependent ecosystem<br />
with numerous fire-adapted<br />
Bureau of Land Management<br />
Bureau of Land Management<br />
Figure 44. Untreated oak/p<strong>in</strong>e forest <strong>in</strong> SW Oregon.<br />
Figure 45. Site after th<strong>in</strong>n<strong>in</strong>g and slash treatment.<br />
Projects on multiple ownerships must<br />
be l<strong>in</strong>ked to achieve strategic goals.<br />
123
species of plants and animals dependent on fire to recycle nutrients, regulate plant succession<br />
and wildlife habitat, ma<strong>in</strong>ta<strong>in</strong> biological diversity, reduce biomass, and control <strong>in</strong>sects and<br />
diseases. Unfortunately, wildfires are becom<strong>in</strong>g larger, more <strong>in</strong>tense, and more difficult to<br />
control.<br />
Use of “closest available resources”<br />
streng<strong>the</strong>ns <strong>in</strong>itial attack.<br />
<strong>Fire</strong> Protection<br />
Wildland fire protection is provided by <strong>the</strong> U.S. Forest Service (FS) for national forest<br />
system lands and by <strong>the</strong> Oregon Department of <strong>Forestry</strong> (ODF) for private lands. To avoid<br />
duplication of services <strong>in</strong> <strong>the</strong> checkerboard ownerships, BLM has contracted fire protection for<br />
<strong>the</strong> public lands it manages to ODF.<br />
Private property structural fire protection is provided by a number of <strong>Fire</strong> Protection<br />
Districts (FPDs), funded by a comb<strong>in</strong>ation of property taxes, special assessments and bonds,<br />
and donations. Typical of <strong>the</strong>se districts is <strong>the</strong> Applegate Valley Rural <strong>Fire</strong> Protection District<br />
No. 9 (AVRFD9) which has six stations, but only a small paid staff, with mostly volunteer<br />
firefighters.<br />
The fire protection agencies have a high level of cooperation, with jo<strong>in</strong>t tra<strong>in</strong><strong>in</strong>g and<br />
<strong>in</strong>teragency fire management teams (Type 2) be<strong>in</strong>g <strong>the</strong> norm. Use of “<strong>the</strong> closest available<br />
resources” for <strong>in</strong>itial attack is practiced, regardless of jurisdiction. A typical response to a<br />
wildfire <strong>in</strong> <strong>the</strong> Applegate River watershed would <strong>in</strong>clude ODF, FS, and FPD resources <strong>in</strong> <strong>the</strong><br />
<strong>in</strong>itial attack dispatch. Dur<strong>in</strong>g critical fire wea<strong>the</strong>r additional contract dozers and water tenders<br />
may be put on standby.<br />
Preparedness<br />
Several years ago, concerned citizens <strong>in</strong> <strong>the</strong> Applegate River Valley formed a non-profit,<br />
tax-exempt, charitable organization called <strong>the</strong> Applegate Partnership to address critical watershed<br />
and forest health issues <strong>in</strong> <strong>the</strong>ir area. One of <strong>the</strong> major focuses was to restore and improve<br />
river conditions for migrat<strong>in</strong>g salmon and steelhead. To this end, <strong>the</strong> Applegate River Watershed<br />
Council (ARWC) was formed and was successful <strong>in</strong> obta<strong>in</strong><strong>in</strong>g grant funds from a variety<br />
of sources for several river restoration projects.<br />
In undertak<strong>in</strong>g <strong>the</strong>se projects, it soon became apparent to <strong>the</strong> participants that watershed<br />
conditions, and <strong>in</strong>deed <strong>the</strong> health of <strong>the</strong> entire ecosystem, was directly related to forest health<br />
issues that were directly related to fire protection and fuel management issues. The scope of <strong>the</strong><br />
124
partnership has expanded to become a community-based resource conservation and management<br />
project <strong>in</strong>volv<strong>in</strong>g <strong>the</strong> federal and state natural resources agencies, conservation and environmental<br />
groups, <strong>the</strong> timber <strong>in</strong>dustry, and local citizens. It facilitates cooperation <strong>in</strong> <strong>the</strong> use of<br />
land and resource management practices that promote ecosystem health and diversity. (For<br />
more <strong>in</strong>formation, see www.ARWC.org).<br />
The partnership has come to recognize <strong>the</strong> roles (both helpful and harmful) of fire <strong>in</strong> <strong>the</strong>ir<br />
watershed and <strong>the</strong> importance of manag<strong>in</strong>g fires (both prescribed and wild) to maximize beneficial<br />
effects and m<strong>in</strong>imize damages to <strong>the</strong> ecosystem. Its newspaper, Applegator, has become an<br />
important and effective tool <strong>in</strong> educat<strong>in</strong>g local residents about <strong>the</strong> importance of hazard reduction<br />
and preparedness for wildfires. The partnership cont<strong>in</strong>ues to be a broad-based coalition of<br />
players mak<strong>in</strong>g effective contributions to significant improvements <strong>in</strong> fire protection.<br />
The National <strong>Fire</strong> Plan <strong>in</strong> Action<br />
The Applegate Partnership and it participat<strong>in</strong>g agencies were <strong>in</strong> excellent position to take<br />
full advantage of grant fund<strong>in</strong>g opportunities that became available under <strong>the</strong> National <strong>Fire</strong> Plan<br />
(NFP). In 2001, <strong>the</strong> Applegate Partnership received a NFP grant to prepare a comprehensive<br />
fire protection strategy for <strong>the</strong> communities <strong>in</strong> <strong>the</strong> Applegate River watershed. The plan is not a<br />
detailed tactical plan, but a compilation of collaborative concepts, strategies, and goals that can<br />
be used to effectively plan specific land management projects and activities that will contribute<br />
to ecosystem health.<br />
Commonly known as <strong>the</strong> Applegate <strong>Fire</strong> Plan, <strong>the</strong> document<br />
establishes <strong>the</strong> follow<strong>in</strong>g primary goals:<br />
1. To improve community awareness of <strong>the</strong> concept of<br />
land stewardship, and foster respect for ecosystems and <strong>the</strong><br />
processes that ma<strong>in</strong>ta<strong>in</strong> <strong>the</strong>m;<br />
2. To develop a wide array of strategies for fuel reduction<br />
and fire suppression that residents can accept as sensible<br />
precautions aga<strong>in</strong>st catastrophic fire and that <strong>the</strong> land<br />
managers can <strong>in</strong>corporate <strong>in</strong>to <strong>the</strong>ir management practices;<br />
125
3. To develop a system of emergency communications for <strong>the</strong> Applegate neighborhoods;<br />
and<br />
4. To restore fire-adapted species <strong>in</strong> <strong>the</strong> ecosystem, encourag<strong>in</strong>g more fire-resilient forests.<br />
Applegate <strong>Fire</strong> Plan:<br />
Awareness<br />
Strategies<br />
Communications<br />
Restoration<br />
The plan identifies <strong>the</strong> fire regimes and condition classes that def<strong>in</strong>e fire hazard <strong>in</strong> <strong>the</strong> 500,000-<br />
acre watershed. It talks about <strong>the</strong> risk of fire from a variety of human activities, and <strong>the</strong> <strong>in</strong>crease <strong>in</strong><br />
fire occurrence that comes with <strong>in</strong>creased population. It def<strong>in</strong>es 19 Strategic Plann<strong>in</strong>g Areas (SPAs)<br />
based on comb<strong>in</strong>ations of small watersheds. It covers <strong>the</strong> effects of fire on vegetation, soils, water,<br />
air, and animals, as well as scenic and property values.<br />
The Applegate <strong>Fire</strong> Plan suggests hazard reduction strategies that beg<strong>in</strong> at <strong>the</strong> Wildland/Urban<br />
Interface <strong>in</strong> high hazards zones (“communities at risk”), <strong>the</strong>n <strong>the</strong> lands immediately adjacent to<br />
homes and roads, <strong>the</strong>n all lands <strong>in</strong> high fire hazard areas, and f<strong>in</strong>ally any areas where fire can contribute<br />
to or detract from ecosystem health. It focuses on <strong>the</strong> concept of “hazard reduction without<br />
borders,” where all agencies and<br />
landowners cooperate to achieve<br />
strategic goals of hazard reduction<br />
of general benefit to <strong>the</strong> community<br />
as a whole. Specific hazard<br />
reduction recommendations were<br />
developed for each of <strong>the</strong> 19 SPAs.<br />
It describes a variety of methodologies<br />
for fuel reduction, and <strong>the</strong><br />
sites to which each is most suited<br />
(Figures 46, 47 and 48). The plan<br />
def<strong>in</strong>es various levels of defensible<br />
space for various comb<strong>in</strong>ations of<br />
slope and fuel load<strong>in</strong>g, as well as<br />
provid<strong>in</strong>g guidel<strong>in</strong>es for fire<br />
resistant plant<strong>in</strong>gs.<br />
The Applegate <strong>Fire</strong> Plan<br />
summarizes exist<strong>in</strong>g policies,<br />
statutes, and regulations at <strong>the</strong><br />
Bureau of Land Management<br />
Figure 46. BLM fuel reduction block adjacent to a subdivision <strong>in</strong> <strong>the</strong><br />
Applegate River Valley, OR.<br />
126
Bureau of Land Management Bureau of Land Management<br />
Figure 47. “Slash Buster” at work <strong>in</strong> oak woodland <strong>in</strong> SW Oregon.<br />
Figure 48. Southwest Oregon oak woodland after treatment.<br />
federal, state, and local levels that<br />
relate to fire protection. Interest<strong>in</strong>gly,<br />
<strong>the</strong> Jackson and Joseph<strong>in</strong>e<br />
County fire safety requirements<br />
are stricter than <strong>the</strong> new Oregon<br />
state requirements which do not<br />
take effect until 2004.<br />
The Plan proposes a strategy<br />
for emergency communications<br />
plann<strong>in</strong>g at <strong>the</strong> neighborhood<br />
level to <strong>in</strong>sure better fire<br />
report<strong>in</strong>g, neighborhood notification,<br />
and receiv<strong>in</strong>g and dissem<strong>in</strong>at<strong>in</strong>g<br />
fire <strong>in</strong>formation from <strong>the</strong><br />
fire agencies. It provides <strong>in</strong>formation<br />
on escape routes, safety<br />
zones, and evacuation routes, and<br />
checklists for home fire safety<br />
measures. It provides resource<br />
<strong>in</strong>formation for land management<br />
plann<strong>in</strong>g and fire protection<br />
plann<strong>in</strong>g, <strong>in</strong>clud<strong>in</strong>g possible<br />
fund<strong>in</strong>g sources for projects and<br />
guidel<strong>in</strong>es for hir<strong>in</strong>g contractors.<br />
To measure accomplishments,<br />
<strong>the</strong> Plan establishes a<br />
monitor<strong>in</strong>g team to track projects<br />
and ga<strong>the</strong>r data on project effectiveness<br />
5 and 10 years after<br />
completion. F<strong>in</strong>ally, <strong>the</strong> Plan<br />
identifies an even dozen specific<br />
th<strong>in</strong>gs that agency personnel and<br />
127
Bureau of Land Management<br />
Figure 49. Untreated p<strong>in</strong>e forest near Squires Peak <strong>Fire</strong>.<br />
residents can do to make <strong>the</strong> plan a viable, efficient, and effective way to reduce<br />
fire hazard, <strong>in</strong>crease fire preparedness, and improve forest health <strong>in</strong> <strong>the</strong> Applegate<br />
community.<br />
O<strong>the</strong>r National <strong>Fire</strong> Plan Projects<br />
Applegate Valley Rural <strong>Fire</strong> Protection District No. 9, <strong>in</strong> cooperation with<br />
ODF, has obta<strong>in</strong>ed two grants with total fund<strong>in</strong>g of $250,000 for fuel reduction<br />
efforts <strong>in</strong> <strong>the</strong> district. The money will be used to reimburse costs to property<br />
owners who complete projects to achieve defensible space around <strong>the</strong>ir homes<br />
accord<strong>in</strong>g to <strong>the</strong> standards established <strong>in</strong> <strong>the</strong> Applegate <strong>Fire</strong> Plan.<br />
BLM’s Medford District has received additional fund<strong>in</strong>g which will allow it<br />
to expand its fire management activities and complete more of <strong>the</strong> th<strong>in</strong>n<strong>in</strong>g and<br />
fuel reduction projects it has had planned for some time. Staff<strong>in</strong>g has doubled, and<br />
project funds should support an <strong>in</strong>crease <strong>in</strong> treated area from 8,000-9,000 acres per<br />
year to 10,000-13,000 acres per year. BLM awarded a five-year, $20 million<br />
contract to two<br />
contractors to do fuels treatment<br />
work on <strong>the</strong> public lands <strong>in</strong> <strong>the</strong><br />
Medford District (Figures 49 and<br />
50). Because fuel load<strong>in</strong>g is too<br />
high to use prescribed fire <strong>in</strong><br />
<strong>in</strong>itial applications, much of <strong>the</strong><br />
area will be th<strong>in</strong>ned and mechanically<br />
treated (e.g.<br />
Slashbuster, etc.), <strong>the</strong>n burned at<br />
a later date.<br />
The Medford District<br />
received $8.6 million <strong>in</strong> NFP<br />
funds for federal fiscal year<br />
2002, which allows it to <strong>in</strong>crease<br />
its fuel reduction acreage target<br />
to 23,000 acres. NFP fund<strong>in</strong>g<br />
allows BLM to do more hazard<br />
Bureau of Land Management<br />
Figure 50. P<strong>in</strong>e forest after commercial th<strong>in</strong>n<strong>in</strong>g cut with slash ready<br />
for w<strong>in</strong>ter burn<strong>in</strong>g.<br />
128
eduction work outside <strong>the</strong> commercial timber belt and adjacent to communities at risk (Figures<br />
51 and 52). Cost estimates for post-logg<strong>in</strong>g hazard reduction work <strong>in</strong> southwest Oregon are<br />
listed as:<br />
• Mechanical slash treatment<br />
• Manual slash treatment<br />
• Prescribed burn<br />
$300-400/acre<br />
$800-1200/acre<br />
$200-300/acre<br />
ODF has established cost-share fuel treatment programs to assist landowners <strong>in</strong> 18 of <strong>the</strong><br />
26 designated communities at risk <strong>in</strong> southwestern Oregon. N<strong>in</strong>eteen communities and nonprofit<br />
organizations have received 29 grants total<strong>in</strong>g $4.3 million <strong>in</strong> <strong>the</strong> last two years. ODF has<br />
received an additional $2.25 million which it has used to assist 640 landowners to achieve<br />
defensible space.<br />
Southwest Oregon has 26<br />
communities-at-risk.<br />
ODF and BLM work cooperatively with each o<strong>the</strong>r and with private landowners to achieve<br />
fuel reduction projects that are l<strong>in</strong>ked across property l<strong>in</strong>es to achieve pre-planned strategic<br />
hazard reduction goals.<br />
Bureau of Land Management<br />
Bureau of Land Management<br />
Figure 51. Direct attack dozer l<strong>in</strong>e conta<strong>in</strong>ed <strong>the</strong> Squires Peak <strong>Fire</strong> <strong>in</strong><br />
areas that had been th<strong>in</strong>ned.<br />
Figure 52. Back<strong>in</strong>g surface fire <strong>in</strong> th<strong>in</strong>ned p<strong>in</strong>e/fir/oak stand.<br />
129
The Squires Peak <strong>Fire</strong><br />
The Squires Peak <strong>Fire</strong> began from a lightn<strong>in</strong>g strike dur<strong>in</strong>g a typical summer afternoon<br />
thunderstorm <strong>in</strong> <strong>the</strong> vic<strong>in</strong>ity of Squires Peak, about 17 miles west of Ashland, Oregon on Saturday,<br />
July 13, 2002 at about 1700 hours.<br />
There was little ra<strong>in</strong>fall with <strong>the</strong> thunderstorm, and <strong>the</strong><br />
conditions were just right for <strong>the</strong> fire to burn aggressively <strong>in</strong><br />
heavy fuels all through <strong>the</strong> first night. On Sunday, <strong>the</strong> fire cont<strong>in</strong>ued<br />
to spread, with suppression efforts be<strong>in</strong>g frustrated by <strong>in</strong>accessible<br />
terra<strong>in</strong>, erratic w<strong>in</strong>ds, and spot fires. On Monday and<br />
Tuesday, suppression efforts started to pay off, and where fuel<br />
treatment projects (logg<strong>in</strong>g, th<strong>in</strong>n<strong>in</strong>g, burns, etc.) had taken<br />
place, <strong>the</strong> fire rema<strong>in</strong>ed a surface fire vulnerable to direct attack<br />
(Figure 52). Crews were able to construct direct dozer and hand<br />
l<strong>in</strong>es <strong>in</strong> many areas, and go <strong>in</strong>direct with follow-up burn<strong>in</strong>g out<br />
<strong>in</strong> o<strong>the</strong>r areas. Conta<strong>in</strong>ment appeared not far off.<br />
On Tuesday even<strong>in</strong>g,<br />
strong down-slope w<strong>in</strong>ds of up<br />
to 20 mph caused spott<strong>in</strong>g<br />
outside conta<strong>in</strong>ment l<strong>in</strong>es and<br />
<strong>the</strong> fire began to make significant<br />
runs down and across<br />
dra<strong>in</strong>ages, with susta<strong>in</strong>ed runs<br />
Bureau of Land Management<br />
Figure 53. Crown fire <strong>in</strong> unth<strong>in</strong>ned p<strong>in</strong>e forest; Squires Peak <strong>Fire</strong>,<br />
Oregon.<br />
130
<strong>in</strong> <strong>the</strong> crowns of <strong>the</strong> trees. More<br />
spot fires spread fire <strong>in</strong>to multiple<br />
dra<strong>in</strong>ages, and <strong>the</strong> fire<br />
moved off of Squires Peak <strong>in</strong>to<br />
several populated dra<strong>in</strong>ages. The<br />
fire behavior pattern became one<br />
of back<strong>in</strong>g fires under th<strong>in</strong>ned<br />
timber stands and mov<strong>in</strong>g down<br />
slope without <strong>the</strong> effect of w<strong>in</strong>d,<br />
but mak<strong>in</strong>g strong runs <strong>in</strong><br />
unth<strong>in</strong>ned timber stands (Figures<br />
53 and 54) and uphill on south<br />
slopes, with torch<strong>in</strong>g, crown<strong>in</strong>g,<br />
and multiple spot fires (Figures<br />
55). Numerous homes and<br />
outbuild<strong>in</strong>gs <strong>in</strong> <strong>the</strong> rural <strong>in</strong>terface<br />
were threatened, and many<br />
families evacuated. Most families<br />
were well prepared, thanks to<br />
<strong>the</strong>ir understand<strong>in</strong>g of <strong>the</strong> issues<br />
identified <strong>in</strong> <strong>the</strong> Applegate <strong>Fire</strong><br />
Plan.<br />
Bureau of Land Management<br />
Figure 54. Stand <strong>in</strong> Figure 10 after Squires Peak <strong>Fire</strong>.<br />
Susta<strong>in</strong>ed crown fires swept whole<br />
slopes <strong>in</strong> unth<strong>in</strong>ned timber stands.<br />
On Wednesday, erratic<br />
w<strong>in</strong>ds cont<strong>in</strong>ued to fan <strong>the</strong> fire<br />
across conta<strong>in</strong>ment l<strong>in</strong>es and to<br />
drive spot fires <strong>in</strong>to new terra<strong>in</strong>.<br />
On Thursday, ODF fire managers<br />
drew “a l<strong>in</strong>e <strong>in</strong> <strong>the</strong> sand” at<br />
Sterl<strong>in</strong>g Creek Road. Tak<strong>in</strong>g<br />
advantage of <strong>the</strong> terra<strong>in</strong>, an area<br />
where fuels had been treated, and<br />
more favorable w<strong>in</strong>ds, <strong>the</strong> fire<br />
was conta<strong>in</strong>ed without cross<strong>in</strong>g<br />
<strong>the</strong> road.<br />
Bureau of Land Management<br />
Figure 55. Home with defensible space survived <strong>the</strong> Squire Peaks<br />
<strong>Fire</strong>.<br />
131
The Squires Peak <strong>Fire</strong> was conta<strong>in</strong>ed at 3,000 acres<br />
with no homes lost and nobody seriously <strong>in</strong>jured. Cooperation<br />
between <strong>the</strong> responsible agencies and open dialogue<br />
with <strong>the</strong> local residents contributed materially to a<br />
successful suppression effort.<br />
On August 22, 2002, follow<strong>in</strong>g ano<strong>the</strong>r siege of<br />
lightn<strong>in</strong>g fires <strong>in</strong> southwest Oregon, and dur<strong>in</strong>g <strong>the</strong> height<br />
of <strong>the</strong> massive Biscuit <strong>Fire</strong> some thirty miles to <strong>the</strong> west, President George W. Bush stood at a<br />
spot <strong>in</strong>side <strong>the</strong> Squires Peak <strong>Fire</strong> where <strong>the</strong> fire had burned <strong>in</strong>tensely through a heavy stand of<br />
timber scheduled to be logged, followed by slash treatment and prescribed burn<strong>in</strong>g. Aga<strong>in</strong>st a<br />
background of blackened trees, <strong>the</strong> President called for changes <strong>in</strong> federal policy and regulations<br />
that would make it easier for <strong>the</strong> FS and BLM to conduct th<strong>in</strong>n<strong>in</strong>g, slash treatment, and<br />
prescribed burns that would reduce fire hazard and contribute to improved forest health. He<br />
also called on Congress to provide fund<strong>in</strong>g to implement <strong>the</strong> 1994 Northwest Forest Plan,<br />
which could yield up to a billion board feet of lumber and 100,000 jobs while reduc<strong>in</strong>g fire<br />
hazard and improv<strong>in</strong>g forest health.<br />
The Squires Peak <strong>Fire</strong> certa<strong>in</strong>ly was not large, especially <strong>in</strong> a year with two<br />
fires approach<strong>in</strong>g half a million acres, but it may have a significant impact as <strong>the</strong><br />
icon for expanded efforts to th<strong>in</strong> our forests and reduce fire hazards.<br />
The Indian <strong>Fire</strong>, Prescott, Arizona<br />
Prescott, Arizona is a rapidly grow<strong>in</strong>g community situated <strong>in</strong> <strong>the</strong> p<strong>in</strong>e forested<br />
mounta<strong>in</strong>s of central Arizona, adjacent to <strong>the</strong> Prescott National Forest. Nearly<br />
50,000 people live <strong>in</strong> <strong>the</strong> Prescott metropolitan area and major growth has been <strong>the</strong><br />
hallmark of <strong>the</strong> last decade, with many of <strong>the</strong> new arrivals be<strong>in</strong>g retirees <strong>in</strong>tent on<br />
escap<strong>in</strong>g <strong>the</strong> stress of large cities or <strong>the</strong> brutal w<strong>in</strong>ters of <strong>the</strong> Great Lakes region.<br />
At an elevation of 5,350 feet, Prescott offers attractive scenery, cool summers, and<br />
mild w<strong>in</strong>ters to its residents. It also offers <strong>the</strong> opportunity for high <strong>in</strong>tensity, large,<br />
damag<strong>in</strong>g wildfires (Figure 56).<br />
Figure 56. Wildland/urban <strong>in</strong>terface <strong>in</strong> Prescott, Arizona.<br />
At lower elevations of <strong>the</strong> Prescott Bas<strong>in</strong> <strong>the</strong> vegetation consists of mixed<br />
brush species such as manzanita, mounta<strong>in</strong> mahogany, scrub oak and cliff rose,<br />
132
with scattered p<strong>in</strong>yon p<strong>in</strong>e and<br />
juniper trees. As elevation<br />
<strong>in</strong>creases, so does <strong>the</strong> density of<br />
Ponderosa P<strong>in</strong>e. In many parts of<br />
<strong>the</strong> metropolitan area, <strong>the</strong> brush<br />
is high, thick, and decadent.<br />
Over <strong>the</strong> last 50 years, <strong>the</strong> Ponderosa<br />
P<strong>in</strong>e forest has changed<br />
significantly <strong>in</strong> character, primarily<br />
as a result of logg<strong>in</strong>g and fire<br />
exclusion. Much of <strong>the</strong> exist<strong>in</strong>g<br />
forest, especially on <strong>the</strong> state and<br />
private lands, but also on <strong>the</strong><br />
national forest, is overstocked<br />
with heavy undergrowth of brush<br />
fuels. Dur<strong>in</strong>g <strong>the</strong> last few years,<br />
a l<strong>in</strong>ger<strong>in</strong>g drought <strong>in</strong> <strong>the</strong> Southwest<br />
U.S. has resulted <strong>in</strong> high<br />
mortality of all forest plant<br />
species. The brush species have<br />
reacted to water stress by <strong>in</strong>creas<strong>in</strong>g<br />
<strong>the</strong>ir dead/live fuel ratios,<br />
some of which were already high<br />
due to <strong>the</strong> advanced age of <strong>the</strong><br />
brush fields. In many parts of<br />
Prescott, <strong>the</strong> scenery looks<br />
remarkably similar to Sou<strong>the</strong>rn<br />
California fuel types. The<br />
Ponderosa P<strong>in</strong>e forest has suffered<br />
<strong>in</strong>creased epidemics of<br />
disease and <strong>in</strong>sects, and many of<br />
<strong>the</strong> trees are dead or dy<strong>in</strong>g.<br />
Aerial fuels are abundant, allow<strong>in</strong>g<br />
surface fires plenty of opportunity<br />
to climb <strong>in</strong>to <strong>the</strong> crowns of<br />
Figure 57. Prescribed fire <strong>in</strong> Ponderosa P<strong>in</strong>e, Arizona.<br />
Figure 58. Fuel wood cut and stacked; slash lopped, ready for<br />
broadcast burn<strong>in</strong>g.<br />
133
<strong>the</strong> p<strong>in</strong>e trees. Without normal summer “monsoon” ra<strong>in</strong>storms, <strong>the</strong> hot, dry desert climate<br />
provides <strong>the</strong> perfect wea<strong>the</strong>r conditions for high <strong>in</strong>tensity wildfires. Normal summer monsoons<br />
have occurred only once <strong>in</strong> <strong>the</strong> last six years.<br />
Prescott, AZ is a community-at-risk.<br />
Homes are be<strong>in</strong>g built at an <strong>in</strong>creas<strong>in</strong>g pace, with subdivisions creep<strong>in</strong>g up <strong>the</strong> mounta<strong>in</strong>s<br />
on <strong>the</strong> outskirts of town. Early subdivisions were built without fire protection water systems<br />
and with narrow, w<strong>in</strong>d<strong>in</strong>g roads, frequently with only one way <strong>in</strong> and out. No statewide fire<br />
defense regulations are <strong>in</strong> place. Many people, alarmed how many trees are already dead, are<br />
reluctant to support additional th<strong>in</strong>n<strong>in</strong>g. There are no legal requirements or f<strong>in</strong>ancial <strong>in</strong>centives<br />
to establish defensible space around homes. When you add <strong>in</strong>creas<strong>in</strong>g numbers of homes to<br />
this volatile wildland sett<strong>in</strong>g, you have successfully created <strong>the</strong> recipe for a large, damag<strong>in</strong>g<br />
wildfire to sweep through <strong>the</strong> wildland/urban <strong>in</strong>terface with great risks to people and <strong>the</strong>ir<br />
homes.<br />
Pre-suppression Activities<br />
The primary public land management agencies <strong>in</strong> <strong>the</strong> Prescott metropolitan area are <strong>the</strong><br />
U.S.D.A. Forest Service (FS), Prescott National Forest and <strong>the</strong> Arizona State Land Department<br />
(ASLD). O<strong>the</strong>r than Arizona Public Services (APS), an electric utility, <strong>the</strong>re are few major<br />
landowners <strong>in</strong> <strong>the</strong> private sector, so <strong>the</strong> private lands tend to be <strong>in</strong> small ownerships, usually<br />
less than an acre <strong>in</strong> size.<br />
The Prescott National Forest (PNF) has an active fuel management program, with additional<br />
fund<strong>in</strong>g from <strong>the</strong> National <strong>Fire</strong> Plan provid<strong>in</strong>g <strong>in</strong>creased opportunities for hazard reduction<br />
projects of cost-effective scale. The forest staff recognizes <strong>the</strong> necessity of protect<strong>in</strong>g <strong>the</strong><br />
adjacent private lands from wildfires orig<strong>in</strong>at<strong>in</strong>g on <strong>the</strong> forest, as well as <strong>the</strong> need to protect<br />
forest resources from <strong>the</strong> <strong>in</strong>creased fire risks posed by urbanization of <strong>the</strong> neighbor<strong>in</strong>g wildlands.<br />
Considerable effort has been directed at fuel management projects on <strong>the</strong> w<strong>in</strong>dward edge<br />
of <strong>the</strong> forest southwest of town (Figure 59).<br />
The State lands tend to be <strong>in</strong> scattered, one section (640 acres) blocks, although <strong>the</strong>re are<br />
some patches of contiguous blocks <strong>in</strong> <strong>the</strong> Prescott area that provide opportunity for macro-land<br />
management projects. The ASLD <strong>Fire</strong> Management Division has less than thirty full time<br />
permanent employees for <strong>the</strong> whole state, so it must leverage its meager resources by enter<strong>in</strong>g<br />
<strong>in</strong>to cooperative arrangements with private landowners and o<strong>the</strong>r public agencies <strong>in</strong> order to<br />
accomplish <strong>in</strong>tegrated fuel hazard reduction <strong>in</strong> strategic blocks.<br />
134
Arizona Public Services<br />
(APS) is fully cognizant of both<br />
<strong>the</strong> risk of wildfire orig<strong>in</strong>at<strong>in</strong>g<br />
from its electrical utility operations<br />
and <strong>the</strong> risk of wildfire to<br />
its electric utility <strong>in</strong>frastructure.<br />
For example, APS is currently<br />
build<strong>in</strong>g <strong>the</strong> world’s largest solar<br />
power plant (450KW) on a 50-<br />
acre site near <strong>the</strong> Prescott airport.<br />
Not want<strong>in</strong>g to f<strong>in</strong>d out what<br />
effect <strong>the</strong> smoke and soot from a<br />
major forest fire could do to this<br />
facility, <strong>the</strong> utility has become a<br />
major player <strong>in</strong> hazard reduction<br />
efforts <strong>in</strong> <strong>the</strong> Prescott area.<br />
Figure 59. Th<strong>in</strong>n<strong>in</strong>g with fuel wood removal; slash piled for burn<strong>in</strong>g.<br />
Formed to address <strong>the</strong> threat of large, damag<strong>in</strong>g wildfires <strong>in</strong> <strong>the</strong> wildland-urban <strong>in</strong>terface,<br />
<strong>the</strong> Prescott Area Wildland/Urban Interface Commission (PAWUIC) consists of civic leaders<br />
and <strong>in</strong>terested citizens with advisors from <strong>the</strong> land management and fire protection agencies.<br />
Born a dozen years ago under <strong>the</strong> leadership of <strong>the</strong> Prescott City Manager, <strong>the</strong> chairman of <strong>the</strong><br />
Yavapai County Board of Supervisors and <strong>the</strong> supervisor of <strong>the</strong> Prescott N.F., <strong>the</strong> PAWUIC,<br />
with <strong>in</strong>itial fund<strong>in</strong>g from APS, has been successfully pursu<strong>in</strong>g various grant funds for hazard<br />
reduction projects <strong>in</strong> <strong>the</strong> Prescott <strong>in</strong>terface.<br />
Key players:<br />
Arizona State Lands Dept.<br />
Prescott National Forest<br />
Prescott <strong>Fire</strong> Department<br />
Central Yavapai <strong>Fire</strong> District<br />
Arizona Public Services<br />
In addition to creation of an <strong>in</strong>teragency operat<strong>in</strong>g and evacuation plan for wildfires, one<br />
tangible example of <strong>the</strong>ir efforts is <strong>the</strong> creation of two brush fire crews operated jo<strong>in</strong>tly by <strong>the</strong><br />
Prescott <strong>Fire</strong> Department (PFD) and <strong>the</strong> Central Yavapai <strong>Fire</strong> District (CYFD). These fullytra<strong>in</strong>ed<br />
fire crews are equipped with trucks, chippers, and tools, and perform hazard reduction<br />
work on private lands <strong>in</strong> targeted high hazard areas of <strong>the</strong> wildland/urban <strong>in</strong>terface. In one<br />
target subdivision <strong>in</strong> a high hazard area, more than half of all <strong>the</strong> lots have already been treated.<br />
While local politics still make stiff fire regulations unpopular, <strong>the</strong> commission has greatly<br />
<strong>in</strong>creased public awareness of <strong>the</strong> defensible space concept.<br />
135
ASLD, us<strong>in</strong>g fund<strong>in</strong>g from NFP grants and <strong>the</strong> Prescott brush crew, has been able to<br />
pretreat blocks of state lands with<strong>in</strong> <strong>the</strong> metropolitan area <strong>in</strong> preparation for prescribed burns<br />
aimed at reduc<strong>in</strong>g fuel volumes and lower<strong>in</strong>g age class <strong>in</strong> <strong>the</strong> brush species. This type of<br />
project has <strong>the</strong> potential to decrease fire hazard, improve scenic value, and improve forage<br />
value for wildlife, an important part of <strong>the</strong> liv<strong>in</strong>g <strong>in</strong> <strong>the</strong> woods experience.<br />
The Prescott National Forest conducts several prescribed burn operations each year, as<br />
well as brush crush<strong>in</strong>g and tree th<strong>in</strong>n<strong>in</strong>g operations, both for fire hazard reduction and <strong>in</strong>sect<br />
control purposes.<br />
Defensible space is be<strong>in</strong>g created with<br />
National <strong>Fire</strong> Plan grant funds.<br />
<strong>Fire</strong> Suppression Organization<br />
The primary providers of fire protection services <strong>in</strong> <strong>the</strong> Prescott Bas<strong>in</strong> are <strong>the</strong> Prescott <strong>Fire</strong><br />
Department (PFD), <strong>the</strong> Central Yavapai <strong>Fire</strong> District (CYFD), and <strong>the</strong> Prescott National Forest<br />
(PNF).<br />
The Prescott <strong>Fire</strong> Department has five stations and operates two wildland eng<strong>in</strong>es <strong>in</strong><br />
addition to its regular structure eng<strong>in</strong>es. PFD has a Wildland/Urban Interface Hazard Fuels<br />
Reduction Team, operates an <strong>in</strong>teragency central dispatch, and has an automatic aid agreement<br />
with <strong>the</strong> CYFD.<br />
The Central Yavapai <strong>Fire</strong> District has four stations hous<strong>in</strong>g 3 eng<strong>in</strong>es, one qu<strong>in</strong>t, 2 water<br />
tenders, and one patrol rig and is a comb<strong>in</strong>ation paid/volunteer department serv<strong>in</strong>g <strong>the</strong> area<br />
outside <strong>the</strong> City of Prescott.<br />
The Prescott National Forest currently staffs six eng<strong>in</strong>es, one helicopter (Type 3) with fly<br />
crew, six lookouts, and fields 10 fire prevention technicians. It also has available one hotshot<br />
crew and one heavy air tanker, both considered national resources and subject to frequent offforest<br />
dispatches. Initial attack capability dur<strong>in</strong>g <strong>the</strong> current drought has been <strong>in</strong>creased by <strong>the</strong><br />
addition of one medium air tanker.<br />
The Forest Service eng<strong>in</strong>es are stationed <strong>in</strong> <strong>the</strong> PFD and CYFD stations dur<strong>in</strong>g <strong>the</strong> wildland<br />
fire season and <strong>the</strong> personnel from all three agencies, tra<strong>in</strong>, work and respond toge<strong>the</strong>r,<br />
us<strong>in</strong>g <strong>the</strong> “closest resource” dispatch philosophy. Aircraft respond on <strong>in</strong>itial attack dispatches<br />
<strong>in</strong> <strong>the</strong> wildland/urban <strong>in</strong>terface dur<strong>in</strong>g high fire danger periods.<br />
136
The ASLD <strong>Fire</strong> Management Division provides coord<strong>in</strong>ation of <strong>in</strong>teragency response to<br />
multi-jurisdictional wildfires and pays for local government fire apparatus respond<strong>in</strong>g to wildfires<br />
outside <strong>the</strong>ir own jurisdiction.<br />
The Indian <strong>Fire</strong><br />
It was a warm, sunny, day with a normal southwest breeze <strong>in</strong> Prescott on Wednesday, May<br />
15, 2002. At about 1455 hours personnel at both Prescott <strong>Fire</strong> Stations 71 and 72 observed a<br />
build<strong>in</strong>g column of smoke to <strong>the</strong> south of town. Soon 9-1-1 calls confirmed a wildfire on<br />
Indian Creek Road near <strong>the</strong><br />
campground. Units from <strong>the</strong><br />
PFD, CYFD, and PNF responded<br />
simultaneously. Upon arrival of<br />
<strong>the</strong> first units at <strong>the</strong> scene, seven<br />
m<strong>in</strong>utes later, <strong>the</strong> fire was already<br />
10-15 acres burn<strong>in</strong>g <strong>in</strong>tensely<br />
and crown<strong>in</strong>g <strong>in</strong> p<strong>in</strong>e timber. It<br />
appears <strong>the</strong> fire had been burn<strong>in</strong>g<br />
for some time before be<strong>in</strong>g<br />
noticed.<br />
Delayed report gives fire a head start.<br />
The fire spread quickly<br />
toward Highway 89 and was<br />
already 100 acres with long range<br />
spott<strong>in</strong>g occurr<strong>in</strong>g with<strong>in</strong> <strong>the</strong> first<br />
30 m<strong>in</strong>utes. Utiliz<strong>in</strong>g <strong>the</strong> strategy<br />
identified <strong>in</strong> <strong>the</strong> local pre-plan, a<br />
command post was established at <strong>the</strong> Indian Creek Campground and arriv<strong>in</strong>g chief officers<br />
immediately given division assignments, <strong>in</strong>clud<strong>in</strong>g <strong>the</strong> formation of a Structure Protection<br />
Group, as <strong>the</strong> fire was headed directly for <strong>the</strong> Ponderosa Park subdivision. Residents of <strong>the</strong><br />
area crowded <strong>the</strong> roadways try<strong>in</strong>g to reach <strong>the</strong>ir homes. Significant resources were ordered for<br />
structure protection assignments early on.<br />
As <strong>the</strong> fire <strong>in</strong>creased <strong>in</strong> size and <strong>in</strong>tensity, it was apparent that evacuation of <strong>the</strong> Ponderosa<br />
Park and Timberridge subdivisions, if not a much larger area, would be necessary. The Yavapai<br />
137
County Office of Emergency Management<br />
(YCOEM) began mobiliz<strong>in</strong>g<br />
additional resources accord<strong>in</strong>g to <strong>the</strong><br />
<strong>in</strong>teragency operat<strong>in</strong>g plan. Before<br />
nightfall, some 3,000 people would<br />
be evacuated from <strong>the</strong>ir homes and<br />
report to evacuation centers established<br />
by <strong>the</strong> Red Cross and o<strong>the</strong>r<br />
relief agencies.<br />
3,000 people evacuated.<br />
By 1700 hours, <strong>the</strong> fire had<br />
crossed Highway 89 near <strong>the</strong> summit,<br />
destroy<strong>in</strong>g a historic forest service<br />
station on <strong>the</strong> way, and was more<br />
than 500 acres and runn<strong>in</strong>g hard<br />
toward town. A total of six air<br />
tankers and one heavy-lift helicopter<br />
were now operat<strong>in</strong>g on <strong>the</strong> fire.<br />
With<strong>in</strong> one half hour of <strong>the</strong> open<strong>in</strong>g<br />
of <strong>the</strong> Prescott Emergency Operations<br />
Center (EOC), three subdivisions<br />
were be<strong>in</strong>g evacuated and buses had<br />
been ordered to evacuate <strong>the</strong> campers<br />
from Chapel Rock Camp. The fire<br />
had reached 900 acres (Figure 60).<br />
At this time it was apparent that<br />
a stand would have to be made at <strong>the</strong><br />
head of <strong>the</strong> fire to keep it from<br />
burn<strong>in</strong>g directly <strong>in</strong>to <strong>the</strong> City. Tim<strong>in</strong>g<br />
and circumstances dictated that<br />
<strong>the</strong> stand would be made at <strong>the</strong> edge<br />
Figure 60. The Indian <strong>Fire</strong> headed for <strong>the</strong> City of Prescott.<br />
of <strong>the</strong> Ca<strong>the</strong>dral P<strong>in</strong>es subdivision, directly border<strong>in</strong>g <strong>the</strong> Prescott NF. Structure protection<br />
forces were put <strong>in</strong> to place, residents were evacuated, residences were triaged, and wildland<br />
crews began a burnout around <strong>the</strong> structures at <strong>the</strong> edge of <strong>the</strong> subdivision <strong>in</strong> an area that had<br />
138
previously been mechanically<br />
th<strong>in</strong>ned and burned by <strong>the</strong> Forest<br />
Service <strong>in</strong> anticipation of just<br />
such a fire event.<br />
As <strong>the</strong> head of <strong>the</strong> fire entered<br />
<strong>the</strong> fuel treatment area, fire<br />
<strong>in</strong>tensity dim<strong>in</strong>ished so that air<br />
drops became effective, and <strong>the</strong><br />
w<strong>in</strong>d died down enough that <strong>the</strong><br />
fir<strong>in</strong>g operation was manageable.<br />
There was still plenty of excitement,<br />
as a spot fire hidden by <strong>the</strong><br />
heavy smoke ran through a brush<br />
patch below a house, ignit<strong>in</strong>g it.<br />
An adjacent house ignited from<br />
radiant heat from <strong>the</strong> first structure,<br />
and two more houses up <strong>the</strong> hill<br />
had spot fires start on <strong>the</strong> roofs before suppression forces could knock <strong>the</strong> heat out of <strong>the</strong> head.<br />
Figure 61. High <strong>in</strong>tensity wildfire; salvage logged and slash chipped<br />
<strong>in</strong> foreground.<br />
<strong>Fire</strong> spread from first house to<br />
three o<strong>the</strong>rs.<br />
By nightfall, <strong>the</strong> comb<strong>in</strong>ation of aggressive fire fight<strong>in</strong>g,<br />
close air support, reduced w<strong>in</strong>d, cooler temperatures,<br />
and higher humidity gave firefighters <strong>the</strong> upper hand. The<br />
fire was conta<strong>in</strong>ed <strong>the</strong> next day at 1,360 acres, with 4 structures<br />
lost and one heavily damaged. Fifteen houses that<br />
were with<strong>in</strong> <strong>the</strong> perimeter of <strong>the</strong> fire had been saved.<br />
Nearly 80% of <strong>the</strong> area burned by <strong>the</strong> Indian <strong>Fire</strong><br />
suffered a high <strong>in</strong>tensity burn; with nearly 100% kill of <strong>the</strong><br />
second growth Ponderosa P<strong>in</strong>e forest. Arson is suspected as<br />
<strong>the</strong> fire cause and a reward has been offered for <strong>in</strong>formation lead<strong>in</strong>g to <strong>the</strong> arrest and conviction of<br />
<strong>the</strong> responsible party (Figure 61).<br />
139
While <strong>the</strong> Indian <strong>Fire</strong> was certa<strong>in</strong>ly one of <strong>the</strong> most serious fires <strong>in</strong> recent history <strong>in</strong> <strong>the</strong> Prescott<br />
area, it had <strong>the</strong> potential to be a disaster of major proportions. More than 2,000 homes were <strong>in</strong> <strong>the</strong><br />
immediate path of <strong>the</strong> fire, nestled <strong>in</strong> woods made decadent by <strong>in</strong>sects and disease and made t<strong>in</strong>der<br />
dry by years of drought. Preplann<strong>in</strong>g, hazard reduction, <strong>in</strong>teragency cooperation, effective suppression<br />
actions, and a little luck kept <strong>the</strong> Indian <strong>Fire</strong> from becom<strong>in</strong>g a conflagration.<br />
The Rodeo-Chediski <strong>Fire</strong>, Arizona<br />
The Mogollon Rim cleaves <strong>the</strong> mounta<strong>in</strong>s of eastern Arizona as dramatically as <strong>the</strong> Great<br />
Wall once isolated Ch<strong>in</strong>a. The vertical rock face of <strong>the</strong> rim, reach<strong>in</strong>g more than 1,000 vertical<br />
feet, makes travel difficult at best. From a distance, <strong>the</strong> vast expanse of bare rock wall would<br />
appear to be a formidable firebreak, but it proved no great obstacle for <strong>the</strong> Rodeo-Chediski <strong>Fire</strong>,<br />
<strong>the</strong> largest wildfire <strong>in</strong> Arizona history.<br />
North of <strong>the</strong> rim <strong>the</strong> country<br />
tilts gently toward <strong>the</strong> north,<br />
fall<strong>in</strong>g from <strong>the</strong> cool p<strong>in</strong>e forests<br />
of <strong>the</strong> P<strong>in</strong>etop-Lakeside resort<br />
communities at 7,000 feet to <strong>the</strong><br />
high desert scrub on <strong>the</strong> Colorado<br />
Plateau south of <strong>the</strong> Colorado<br />
River and <strong>the</strong> Interstate 40<br />
corridor between W<strong>in</strong>slow and<br />
Holbrook, around 5,000 feet <strong>in</strong><br />
elevation (Figure 62). The transition<br />
from desert to conifer forest<br />
is dramatic as you head south<br />
from Holbrook and climb toward<br />
<strong>the</strong> luxuriant green forests along<br />
<strong>the</strong> rim (Figure 63). Along <strong>the</strong><br />
north side of <strong>the</strong> rim are nestled a<br />
dozen resort and summer home<br />
communities, where residents<br />
and visitors alike are somewhat<br />
protected from <strong>the</strong> oppressive<br />
heat of <strong>the</strong> desert summers.<br />
Figure 62. Unth<strong>in</strong>ned Ponderosa P<strong>in</strong>e forest near Rodeo, Arizona.<br />
140
South of <strong>the</strong> rim, <strong>the</strong> Fort Apache and San Carlos Indian Reservations cover 2.6 million<br />
acres of high desert and forest punctuated by scattered rugged mounta<strong>in</strong>s and deep river canyons.<br />
Two major watersheds, <strong>the</strong> White River and <strong>the</strong> Black River, flow out of <strong>the</strong> reservations,<br />
jo<strong>in</strong> to form <strong>the</strong> Salt River and flow down toward <strong>the</strong> Valley of <strong>the</strong> Sun and <strong>the</strong> Phoenix metropolitan<br />
area. Elevations range from <strong>the</strong> 11, 560 foot Mount Baldy <strong>in</strong> <strong>the</strong> White Mounta<strong>in</strong>s on<br />
<strong>the</strong> east side down to <strong>the</strong> 3,000<br />
foot level on <strong>the</strong> west and south<br />
ends of <strong>the</strong> reservations. Vegetation<br />
varies from high desert<br />
brush and scrub through dense<br />
Ponderosa P<strong>in</strong>e forest to mixed<br />
conifer forest on <strong>the</strong> shoulders of<br />
<strong>the</strong> high peaks. The forest<br />
supports two sawmills that are a<br />
significant source of <strong>in</strong>come for<br />
<strong>the</strong> White Mounta<strong>in</strong> Apache<br />
tribe. Several small towns are<br />
scattered across <strong>the</strong> reservations,<br />
but much of <strong>the</strong> country is open<br />
and undeveloped wildland. Only<br />
two major highways cross <strong>the</strong><br />
reservations, and much of <strong>the</strong><br />
land area is <strong>in</strong>accessible beyond<br />
a network of gravel and dirt Figure 63. The fire is torch<strong>in</strong>g <strong>in</strong> p<strong>in</strong>es.<br />
logg<strong>in</strong>g roads.<br />
Live fuel moistures were at record low<br />
levels.<br />
The area is dry, with much of <strong>the</strong> precipitation from sporadic scattered thunderstorms that<br />
occur frequently dur<strong>in</strong>g <strong>the</strong> summer “monsoon” ra<strong>in</strong> period. W<strong>in</strong>ter snows at <strong>the</strong> higher elevations<br />
bank much of <strong>the</strong> moisture required to support <strong>the</strong> p<strong>in</strong>e forest and keep <strong>the</strong> small streams<br />
trickl<strong>in</strong>g down through <strong>the</strong> desert towards <strong>the</strong> cities. For six of <strong>the</strong> last seven years, <strong>the</strong> area has<br />
experienced a severe drought. At <strong>the</strong> lower elevations, much of <strong>the</strong> p<strong>in</strong>yon p<strong>in</strong>e <strong>in</strong> <strong>the</strong> p<strong>in</strong>yonjuniper<br />
cover type of <strong>the</strong> desert highlands has died. In <strong>the</strong> p<strong>in</strong>e forests, <strong>in</strong>sect and disease epidemics<br />
have killed 20-30% of <strong>the</strong> Ponderosa P<strong>in</strong>e. The forests <strong>in</strong> <strong>the</strong> spr<strong>in</strong>g of 2002 looked<br />
gray-brown and tired <strong>in</strong>stead of lush green. Live fuel moisture read<strong>in</strong>gs <strong>in</strong> <strong>the</strong> brush and timber<br />
were at record low levels.<br />
141
Fort Apache Agency:<br />
1.7 million acres<br />
400 fires per year<br />
10 fire eng<strong>in</strong>es<br />
2 bulldozers<br />
1 helicopter<br />
5 lookouts<br />
Wildland <strong>Fire</strong> Protection<br />
<strong>Fire</strong> protection for <strong>the</strong> Fort Apache Indian Reservation is provided by <strong>the</strong> USDI Bureau of<br />
Indian Affairs (BIA), Fort Apache Agency. To cover <strong>the</strong> 400 or so fires each year on <strong>the</strong> 1.7<br />
million acres <strong>in</strong> its jurisdiction, <strong>the</strong> agency fields a suppression force <strong>in</strong>clud<strong>in</strong>g ten eng<strong>in</strong>es<br />
(Type 3), two bulldozers, one helicopter (Type 3), and five lookouts. Several well-tra<strong>in</strong>ed and<br />
experienced Southwest <strong>Fire</strong> Fighter (SWFF) crews are also based on <strong>the</strong> reservation. Unfortunately,<br />
under <strong>the</strong> BIA’s <strong>Fire</strong> Management Program Analysis (FMPA) processes, <strong>the</strong> Fort Apache<br />
Agency has been targeted for an 18% budget cut <strong>in</strong> <strong>the</strong> 2003 federal fiscal year, even as <strong>the</strong><br />
drought cont<strong>in</strong>ues.<br />
At <strong>the</strong> north edge of <strong>the</strong> reservations, on top of <strong>the</strong> Mogollon Rim, wildland fire protection<br />
is provided by <strong>the</strong> USDA Forest Service, Apache-Sitgreaves National Forest. A small proportion<br />
of <strong>the</strong> fire also burned on <strong>the</strong> Tonto National Forest. <strong>Fire</strong> management operations are under<br />
<strong>the</strong> Southwest Area Coord<strong>in</strong>at<strong>in</strong>g Group via <strong>the</strong> Southwest Coord<strong>in</strong>ation Center (SWCC) <strong>in</strong><br />
Albuquerque, New Mexico. This group coord<strong>in</strong>ates fire response for <strong>the</strong> federal agencies <strong>in</strong><br />
Arizona, New Mexico, and west Texas. The Apache-Sitgreaves forest has six fire eng<strong>in</strong>es<br />
spread across <strong>the</strong> top of <strong>the</strong> Mogollon Rim.<br />
The dozen or so small communities scattered along <strong>the</strong> top of <strong>the</strong> Mogollon Rim are<br />
protected by <strong>in</strong>dividual fire protection districts. These districts are mostly all volunteer, with<br />
only a few paid personnel. While most have wildland eng<strong>in</strong>es, <strong>the</strong> tra<strong>in</strong><strong>in</strong>g and experience<br />
levels vary greatly, and wildfire capabilities suffer <strong>in</strong> <strong>the</strong> summer as many volunteer firefighters<br />
take seasonal positions with <strong>the</strong> federal agencies.<br />
The Arizona State Land Department (ASLD), <strong>Fire</strong> Management Division is responsible for<br />
fire protection on <strong>the</strong> blocks of state land <strong>in</strong> <strong>the</strong> area, and coord<strong>in</strong>ates <strong>the</strong> response of local fire<br />
agencies to wildland fires throughout <strong>the</strong> state. ASLD has limited staff and only a few eng<strong>in</strong>es.<br />
Fuel Management Projects<br />
The federal land management agencies (FS, BIA, and BLM) and <strong>the</strong> ASLD <strong>Fire</strong> Management<br />
Division have long recognized that a major fire on <strong>the</strong> reservations, driven by prevail<strong>in</strong>g<br />
southwest w<strong>in</strong>ds, could crest <strong>the</strong> Mogollon Rim and threaten any of <strong>the</strong> small towns on top. To<br />
attempt to cope with this threat, <strong>the</strong>y have for many years engaged <strong>in</strong> a series of fuel reduction<br />
and fuel break projects on top of <strong>the</strong> rim. These projects are <strong>in</strong>tended to reduce <strong>the</strong> <strong>in</strong>tensity of<br />
wildfires approach<strong>in</strong>g <strong>the</strong> developed areas and provide defensible space <strong>in</strong> which suppression<br />
142
actions can be safely undertaken. Unfortunately, <strong>the</strong>se projects have not been coord<strong>in</strong>ated<br />
between <strong>the</strong> federal, state, and local agencies to tie toge<strong>the</strong>r <strong>in</strong>to an <strong>in</strong>terconnected strategic<br />
barrier that ignores jurisdictional boundaries <strong>the</strong> way wildfires do.<br />
Mechanical clear<strong>in</strong>g and prescribed fires are used frequently to reduce fuel accumulations,<br />
especially slash follow<strong>in</strong>g logg<strong>in</strong>g operations. While <strong>in</strong>creased fund<strong>in</strong>g for several of <strong>the</strong> agencies<br />
through <strong>the</strong> National <strong>Fire</strong> Plan (NFP) has made it possible to undertake more and larger<br />
projects <strong>in</strong> <strong>the</strong> last few years, <strong>the</strong> area of concern and <strong>the</strong> amount of work needed to reverse 50<br />
years of fire exclusion is immense.<br />
The <strong>Fire</strong> Story<br />
The fire situation at <strong>the</strong><br />
Fort Apache Agency and on <strong>the</strong><br />
neighbor<strong>in</strong>g Apache-Sitgreaves<br />
National Forest could not have<br />
been much worse <strong>in</strong> June of<br />
2002. Ano<strong>the</strong>r dry w<strong>in</strong>ter,<br />
followed by a warm, dry spr<strong>in</strong>g<br />
had reduced fuel moisture<br />
levels <strong>in</strong> both brush and timber<br />
fuel types to record lows (100<br />
hour fuels = 2%). The second<br />
week <strong>in</strong> June was so dry that<br />
several area wea<strong>the</strong>r stations<br />
were record<strong>in</strong>g new record low<br />
relative humidity read<strong>in</strong>gs.<br />
100-hour fuel moisture<br />
was 2 percent<br />
On <strong>the</strong> afternoon on June<br />
18, 2002 a new fire was reported near <strong>the</strong> town of Cibeque <strong>in</strong> <strong>the</strong> northwest corner of <strong>the</strong><br />
Fort Apache Indian Reservation. Set by an arsonist at <strong>the</strong> bottom of a slope <strong>in</strong> flashy fuels,<br />
<strong>the</strong> Rodeo fire was already 15 acres and spread<strong>in</strong>g rapidly uphill on <strong>the</strong> arrival of <strong>the</strong> first<br />
air tanker only 13 m<strong>in</strong>utes after <strong>the</strong> first report of <strong>the</strong> fire. Despite a heavy commitment of<br />
suppression resources, <strong>the</strong> fire raged unchecked. On June 19 th , <strong>the</strong> fire went from about<br />
1,000 acres to 50,000 + acres <strong>in</strong> less than n<strong>in</strong>e hours (Figures 64 and 65).<br />
143
By <strong>the</strong> morn<strong>in</strong>g of June 20 th , <strong>the</strong> Rodeo fire was more than 55,000 acres, and equipment<br />
and personnel from outside <strong>the</strong> area were report<strong>in</strong>g to stag<strong>in</strong>g <strong>in</strong> large numbers. Then<br />
“<strong>the</strong> o<strong>the</strong>r shoe dropped”. At about 0700 hours a lost hiker set a signal fire <strong>in</strong> hopes of<br />
attract<strong>in</strong>g rescuers. It worked. An immediate heavy response of resources from <strong>the</strong> stag<strong>in</strong>g<br />
area was diverted to <strong>the</strong> new fire, which was nearly conta<strong>in</strong>ed by <strong>the</strong> <strong>in</strong>itial attack crews at<br />
about 46 acres. But <strong>the</strong> daytime southwest w<strong>in</strong>ds picked up, driv<strong>in</strong>g <strong>the</strong> fire upslope <strong>in</strong>to<br />
<strong>the</strong> timber on a susta<strong>in</strong>ed run that burned 10,000 acres <strong>in</strong> <strong>the</strong> first day.<br />
Figure 64. The Chedisk-Rodeo <strong>Fire</strong> burned over 460 thousand acres.<br />
144
The Rodeo-Chediski <strong>Fire</strong> threatened<br />
half a dozen communities<br />
simultaneously!<br />
These two<br />
major fires<br />
cont<strong>in</strong>ued to<br />
grow for <strong>the</strong><br />
next several days. They were driven by<br />
moderate SW w<strong>in</strong>ds (15-30 mph) <strong>in</strong> <strong>the</strong><br />
<strong>in</strong>itial stages. When <strong>the</strong> w<strong>in</strong>d wasn’t blow<strong>in</strong>g,<br />
<strong>the</strong> fires burned with such <strong>in</strong>tensity <strong>in</strong><br />
<strong>the</strong> heavy, dry fuels that <strong>the</strong>y become plume<br />
dom<strong>in</strong>ated. In <strong>the</strong> late afternoon, when <strong>the</strong><br />
icecaps on top of <strong>the</strong> convection columns<br />
collapsed, <strong>the</strong> fires spread rapidly <strong>in</strong> all<br />
directions, defy<strong>in</strong>g <strong>the</strong> conta<strong>in</strong>ment strategies<br />
each day.<br />
Figure 65. The Rodeo-Chediski <strong>Fire</strong> threatened<br />
half a dozen communities simultaneously!<br />
On June 23 rd , <strong>the</strong> two fires merged <strong>in</strong>to one giant<br />
conflagration that burned over 100,000 acres <strong>in</strong> that<br />
s<strong>in</strong>gle day, probably a record susta<strong>in</strong>ed run for a wildland<br />
fire. On most days, <strong>the</strong> only places that crown<br />
fires were not susta<strong>in</strong>ed were <strong>in</strong> <strong>the</strong> small patches of<br />
forest where hazard reduction projects had been completed<br />
with<strong>in</strong> <strong>the</strong> last 5-7 years.<br />
145
Thousands of residents evacuated.<br />
The conflagration cont<strong>in</strong>ued its march northward, and barely hesitated at <strong>the</strong> formidable<br />
Mogollon Rim, spott<strong>in</strong>g across a wide front <strong>in</strong>to <strong>the</strong> p<strong>in</strong>e forest outside <strong>the</strong> rim<br />
communities. The strategic fire plann<strong>in</strong>g for <strong>the</strong> Mogollon Rim had predicted a wildfire<br />
impact<strong>in</strong>g a town on <strong>the</strong> rim, but not six communities at once. In <strong>the</strong> rim communities, hit<br />
and run aggressive fire fight<strong>in</strong>g became <strong>the</strong> norm as <strong>the</strong> fire swirled, danced, skipped, and<br />
spotted across <strong>the</strong> forest, between houses and over roads. Here, <strong>the</strong> fuel load<strong>in</strong>g was extremely<br />
heavy, as few residents had bought <strong>in</strong> to <strong>the</strong> concept of defensible space or th<strong>in</strong>n<strong>in</strong>g<br />
<strong>the</strong> forest <strong>in</strong> <strong>the</strong>ir yards. The largest of <strong>the</strong> rim communities, <strong>the</strong> town of Show Low<br />
(pop. 7,700, plus 5,000+ tourists <strong>in</strong> summer) was be<strong>in</strong>g threatened by a crown fire more<br />
than two miles wide advanc<strong>in</strong>g at a susta<strong>in</strong>ed rate of spread of 2-3 miles per hour. Thousands<br />
of residents fled to <strong>the</strong> north (Figure 66).<br />
A change <strong>in</strong> w<strong>in</strong>d direction saved Show Low itself, and <strong>the</strong> wea<strong>the</strong>r began to moderate,<br />
with less w<strong>in</strong>d and higher humidity giv<strong>in</strong>g firefighters a fight<strong>in</strong>g chance. Even with a<br />
massive response of fire suppression resources from all over <strong>the</strong> <strong>West</strong>, parts of <strong>the</strong> Rodeo-<br />
Chedeski <strong>Fire</strong> were not conta<strong>in</strong>ed until <strong>the</strong>y spread out <strong>in</strong>to <strong>the</strong> light fuels of <strong>the</strong> high<br />
desert.<br />
The Rodeo-Chedeski <strong>Fire</strong><br />
became one for <strong>the</strong> record<br />
books, burn<strong>in</strong>g 468,863 acres,<br />
and 446 structures (<strong>in</strong>clud<strong>in</strong>g<br />
200+ homes) <strong>in</strong> seven towns.<br />
Nearly 30,000 people were<br />
evacuated, some for more than<br />
a week. The fire consumed<br />
nearly 400 million board feet of<br />
timber on just <strong>the</strong> Fort Apache<br />
Reservation, probably ano<strong>the</strong>r<br />
250+ million on <strong>the</strong> national<br />
forests. Salvage logg<strong>in</strong>g of <strong>the</strong><br />
burned area will keep <strong>the</strong> two<br />
White Mounta<strong>in</strong> Apache Tribe<br />
sawmills busy for a couple of<br />
Figure 66. Structure survived despite <strong>in</strong>tense burn.<br />
146
years, but after that many jobs<br />
and much <strong>in</strong>come will be lost<br />
for a long time.<br />
The fire cost at least $60<br />
million to control, $30 million<br />
<strong>in</strong> burned area rehabilitation<br />
efforts, and caused nearly a<br />
billion dollars <strong>in</strong> direct damages,<br />
<strong>in</strong>clud<strong>in</strong>g $42 million <strong>in</strong><br />
structure (and property tax<br />
revenue) losses. The tributaries<br />
of <strong>the</strong> Salt River, an important<br />
part of <strong>the</strong> water supply for <strong>the</strong><br />
2.8 million people of <strong>the</strong> Phoenix<br />
metropolitan area, will<br />
rema<strong>in</strong> at risk from <strong>the</strong> fireflood<br />
cycle for several years.<br />
The forests of <strong>the</strong> White<br />
Mounta<strong>in</strong>s will eventually<br />
recover, most of <strong>the</strong> burned<br />
homes will be rebuilt, <strong>the</strong><br />
streams will run clear aga<strong>in</strong>,<br />
and eventually th<strong>in</strong>gs will<br />
return to “normal”. But<br />
eventually is a long time if<br />
you’ve sunk your life sav<strong>in</strong>gs<br />
<strong>in</strong>to a retirement home <strong>in</strong> <strong>the</strong><br />
forest or your job depends on<br />
logg<strong>in</strong>g, recreation, or tourism<br />
(Figure 67).<br />
Figure 67. Several of <strong>the</strong>se cab<strong>in</strong>s were destroyed by <strong>the</strong> fire;<br />
rebuild<strong>in</strong>g started immediately.<br />
147
148
Wildland <strong>Fire</strong> Activities<br />
Numbers of <strong>Fire</strong>s and Acres Burned<br />
by<br />
Agency<br />
for <strong>the</strong><br />
2002 <strong>Fire</strong> Season<br />
149
<strong>West</strong>ern United States<br />
Wildland <strong>Fire</strong> Activity Summary<br />
Wildland <strong>Fire</strong>s Prescribed <strong>Fire</strong>s Wildland <strong>Fire</strong> Use TOTAL<br />
No. <strong>Fire</strong>s<br />
No. Acres<br />
Burned<br />
No. <strong>Fire</strong>s<br />
No. Acres<br />
Burned<br />
No. <strong>Fire</strong>s<br />
No. Acres<br />
Burned<br />
No. <strong>Fire</strong>s<br />
No. Acres<br />
Burned<br />
State <strong>Forestry</strong> Agencies 25,097 2,198,083 1,867 75,314 1 1 26,965 2,273,398<br />
Federal Land Management Agencies<br />
Forest Service 7,824 2,171,407 3,106 254,384 269 39,974 11,199 2,465,765<br />
Bureau of Land Management 2,403 1,131,787 319 98,772 26 9,157 2,748 1,239,716<br />
National Park Service 342 169,356 102 22,004 103 7,725 547 199,085<br />
Fish and Wildlife Service 226 355,836 348 77,739 574 433,575<br />
Bureau of Indian Affairs 3,593 415,527 88 50,804 3,681 466,331<br />
TOTAL 14,388 4,243,913 3,963 503,703 398 56,856 18,749 4,804,472<br />
O<strong>the</strong>r <strong>Fire</strong> Agencies 3,031 252,121 14 3,727 2,957 219,357<br />
TOTAL 42,516 6,694,117 5,844 582,744 399 56,857 48,759 7,333,718<br />
Data Source : The data for <strong>the</strong>se charts was taken from <strong>the</strong> Detailed Situation Reports of <strong>the</strong> various Geographic Area Coord<strong>in</strong>ation Centers and <strong>the</strong> data report<strong>in</strong>g systems of<br />
<strong>the</strong> various states.<br />
150
Alaska<br />
Wildland <strong>Fire</strong> Activity Summary<br />
Wildland <strong>Fire</strong>s Prescribed <strong>Fire</strong>s Wildland <strong>Fire</strong> Use TOTAL<br />
No. <strong>Fire</strong>s<br />
No. Acres<br />
Burned<br />
No. <strong>Fire</strong>s<br />
No. Acres<br />
Burned<br />
No. <strong>Fire</strong>s<br />
No. Acres<br />
Burned<br />
No. <strong>Fire</strong>s<br />
No. Acres<br />
Burned<br />
State <strong>Forestry</strong> Agency* 399 802,515 399 802,515<br />
Federal Land Management Agencies<br />
Forest Service 21 17 21 17<br />
Alaska <strong>Fire</strong> Service(BLM)** 37 702,783 37 702,783<br />
National Park Service** 10 133,810 10 133,810<br />
Fish and Wildlife Service** 32 341,451 1 1,085 33 342,536<br />
Bureau of Indian Affairs** 1 4 1 4<br />
TOTAL 101 1,178,065 1 1,085 102 1,179,150<br />
O<strong>the</strong>r <strong>Fire</strong> Agencies 53 118,443 53 118,443<br />
TOTAL 553 2,099,023 1 1,085 554 2,100,108<br />
Data Source : The data for <strong>the</strong>se charts was taken from <strong>the</strong> Detailed Situation Reports of <strong>the</strong> various Geographic Area Coord<strong>in</strong>ation Centers.<br />
* State provided statistics were used <strong>in</strong> <strong>the</strong> caculations.<br />
**The Alaska <strong>Fire</strong> Service provides wildland fire protection for <strong>the</strong> US Department of Interior agencies <strong>in</strong> Alaska.<br />
151
Arizona<br />
Wildland <strong>Fire</strong> Activity Summary<br />
Wildland <strong>Fire</strong>s Prescribed <strong>Fire</strong>s Wildland <strong>Fire</strong> Use TOTAL<br />
No. <strong>Fire</strong>s<br />
No. Acres<br />
Burned<br />
No. <strong>Fire</strong>s<br />
No. Acres<br />
Burned<br />
No. <strong>Fire</strong>s<br />
No. Acres<br />
Burned<br />
No. <strong>Fire</strong>s<br />
No. Acres<br />
Burned<br />
State <strong>Forestry</strong> Agency* 530 46,645 530 46,645<br />
Federal Land Management Agencies<br />
Forest Service 1,197 330,056 1,164 34,222 2,361 364,278<br />
Bureau of Land Management 153 8,475 14 15,706 167 24,181<br />
National Park Service 37 1,887 4 3,997 1 12 42 5,896<br />
Fish and Wildlife Service 23 6,785 1 145 24 6,930<br />
Bureau of Indian Affairs 1,038 297,321 18 41,506 1,056 338,827<br />
TOTAL 2,448 644,524 1,201 95,576 1 12 3,650 740,112<br />
O<strong>the</strong>r <strong>Fire</strong> Agencies 52 48 52 48<br />
TOTAL 3,030 691,217 1,201 95,576 1 12 4,232 786,805<br />
Data Source : The data for <strong>the</strong>se charts was taken from <strong>the</strong> Detailed Situation Reports of <strong>the</strong> various Geographic Area Coord<strong>in</strong>ation Centers.<br />
* State provided statistics were used <strong>in</strong> <strong>the</strong> caculations.<br />
152
California<br />
Wildland <strong>Fire</strong> Activity Summary<br />
Wildland <strong>Fire</strong>s Prescribed <strong>Fire</strong>s Wildland <strong>Fire</strong> Use TOTAL<br />
No. <strong>Fire</strong>s<br />
No. Acres<br />
Burned<br />
No. <strong>Fire</strong>s<br />
No. Acres<br />
Burned<br />
No. <strong>Fire</strong>s<br />
No. Acres<br />
Burned<br />
No. <strong>Fire</strong>s<br />
No. Acres<br />
Burned<br />
State <strong>Forestry</strong> Agency* 5,759 112,810 5,759 112,810<br />
Federal Land Management Agencies<br />
Forest Service 1,610 365,945 565 54,922 195 1 2,370 420,868<br />
Bureau of Land Management 118 32,767 19 1,546 137 34,313<br />
National Park Service 55 923 47 6,938 86 4,137 188 11,998<br />
Fish and Wildlife Service 26 956 23 24,684 49 25,640<br />
Bureau of Indian Affairs 318 11,014 13 272 331 11,286<br />
TOTAL 2,127 411,605 667 88,362 281 4,138 3,075 504,105<br />
O<strong>the</strong>r <strong>Fire</strong> Agencies<br />
TOTAL 7,886 524,415 667 88,362 281 4,138 8,834 616,915<br />
Data Source : The data for <strong>the</strong>se charts was taken from <strong>the</strong> Detailed Situation Reports of <strong>the</strong> various Geographic Area Coord<strong>in</strong>ation Centers.<br />
* State provided statistics were used <strong>in</strong> <strong>the</strong> caculations.<br />
153
Colorado<br />
Wildland <strong>Fire</strong> Activity Summary<br />
Wildland <strong>Fire</strong>s Prescribed <strong>Fire</strong>s Wildland <strong>Fire</strong> Use TOTAL<br />
No. <strong>Fire</strong>s<br />
No. Acres<br />
Burned<br />
No. <strong>Fire</strong>s<br />
No. Acres<br />
Burned<br />
No. <strong>Fire</strong>s<br />
No. Acres<br />
Burned<br />
No. <strong>Fire</strong>s<br />
No. Acres<br />
Burned<br />
State <strong>Forestry</strong> Agency* 3,409 244,252 17 467 1 1 3,427 244,720<br />
Federal Land Management Agencies<br />
Forest Service 517 299,927 26 5,718 3 22,592 546 328,237<br />
Bureau of Land Management 419 27,909 13 2,421 14 619 446 30,949<br />
National Park Service 34 7,707 5 191 39 7,898<br />
Fish and Wildlife Service 3 18 1 6 4 24<br />
Bureau of Indian Affairs 126 2,186 3 16 129 2,202<br />
TOTAL 1,099 337,747 48 8,352 17 23,211 1,164 369,310<br />
O<strong>the</strong>r <strong>Fire</strong> Agencies 75 13,817 8 1,920 83 15,737<br />
TOTAL 4,583 595,816 73 10,739 18 23,212 4,674 629,767<br />
Data Source : The data for <strong>the</strong>se charts was taken from <strong>the</strong> RMACC 2002 Annual Report.<br />
* State provided statistics were used <strong>in</strong> <strong>the</strong> caculations.<br />
154
Guam<br />
Wildland <strong>Fire</strong> Activity Summary<br />
Wildland <strong>Fire</strong>s Prescribed <strong>Fire</strong>s Wildland <strong>Fire</strong> Use TOTAL<br />
No. <strong>Fire</strong>s<br />
No. Acres<br />
Burned<br />
No. <strong>Fire</strong>s<br />
No. Acres<br />
Burned<br />
No. <strong>Fire</strong>s<br />
No. Acres<br />
Burned<br />
No. <strong>Fire</strong>s<br />
No. Acres<br />
Burned<br />
<strong>Forestry</strong> Agency 491 2,434 491 2,434<br />
Federal Land Management Agencies<br />
Forest Service<br />
Bureau of Land Management<br />
National Park Service<br />
Fish and Wildlife Service<br />
Bureau of Indian Affairs<br />
TOTAL<br />
O<strong>the</strong>r <strong>Fire</strong> Agencies<br />
TOTAL 491 2,434 491 2,434<br />
Data Source : The data for <strong>the</strong>se charts was taken from <strong>the</strong> Detailed Situation Reports of <strong>the</strong> various Geographic Area Coord<strong>in</strong>ation Centers.<br />
* State provided statistics were used <strong>in</strong> <strong>the</strong> caculations.<br />
155
Hawaii<br />
Wildland <strong>Fire</strong> Activity Summary<br />
Wildland <strong>Fire</strong>s Prescribed <strong>Fire</strong>s Wildland <strong>Fire</strong> Use TOTAL<br />
No. <strong>Fire</strong>s<br />
No. Acres<br />
Burned<br />
No. <strong>Fire</strong>s<br />
No. Acres<br />
Burned<br />
No. <strong>Fire</strong>s<br />
No. Acres<br />
Burned<br />
No. <strong>Fire</strong>s<br />
No. Acres<br />
Burned<br />
State <strong>Forestry</strong> Agency* 188 2,377 188 2,377<br />
Federal Land Management Agencies<br />
Forest Service<br />
Bureau of Land Management<br />
National Park Service 1 3,660 1 3,660<br />
Fish and Wildlife Service<br />
Bureau of Indian Affairs<br />
TOTAL 1 3,660 1 3,660<br />
O<strong>the</strong>r <strong>Fire</strong> Agencies<br />
TOTAL 189 6,037 189 6,037<br />
Data Source : The data for <strong>the</strong>se charts was taken from <strong>the</strong> Detailed Situation Reports of <strong>the</strong> various Geographic Area Coord<strong>in</strong>ation Centers.<br />
* State provided statistics were used <strong>in</strong> <strong>the</strong> caculations.<br />
156
Idaho<br />
Wildland <strong>Fire</strong> Activity Summary<br />
Wildland <strong>Fire</strong>s Prescribed <strong>Fire</strong>s Wildland <strong>Fire</strong> Use TOTAL<br />
No. <strong>Fire</strong>s<br />
No. Acres<br />
Burned<br />
No. <strong>Fire</strong>s<br />
No. Acres<br />
Burned<br />
No. <strong>Fire</strong>s<br />
No. Acres<br />
Burned<br />
No. <strong>Fire</strong>s<br />
No. Acres<br />
Burned<br />
State <strong>Forestry</strong> Agency* 386 7,972 46 3,901 432 11,873<br />
Federal Land Management Agencies<br />
Forest Service 930 17,077 374 28,871 35 7,688 1,339 53,636<br />
Bureau of Land Management 205 43,570 14 12,817 219 56,387<br />
National Park Service 1 1 1 1<br />
Fish and Wildlife Service 1 755 2 30 3 785<br />
Bureau of Indian Affairs 8 10 8 10<br />
TOTAL 1,145 61,413 390 41,718 35 7,688 1,570 110,819<br />
O<strong>the</strong>r <strong>Fire</strong> Agencies 27 20,736 27 20,736<br />
TOTAL 1,558 90,121 436 45,619 35 7,688 2,029 143,428<br />
Data Source : The data for <strong>the</strong>se charts was taken from <strong>the</strong> Detailed Situation Reports of <strong>the</strong> various Geographic Area Coord<strong>in</strong>ation Centers.<br />
* State provided statistics were used <strong>in</strong> <strong>the</strong> caculations.<br />
157
Kansas<br />
Wildland <strong>Fire</strong> Activity Summary<br />
Wildland <strong>Fire</strong>s Prescribed <strong>Fire</strong>s Wildland <strong>Fire</strong> Use TOTAL<br />
No. <strong>Fire</strong>s<br />
No. Acres<br />
Burned<br />
No. <strong>Fire</strong>s<br />
No. Acres<br />
Burned<br />
No. <strong>Fire</strong>s<br />
No. Acres<br />
Burned<br />
No. <strong>Fire</strong>s<br />
No. Acres<br />
Burned<br />
State <strong>Forestry</strong> Agency* 6,024 93,017 6,024 93,017<br />
Federal Land Management Agencies<br />
Forest Service 10 1,422 10 1,422<br />
Bureau of Land Management<br />
National Park Service<br />
Fish and Wildlife Service 8 304 45 4,865 53 5,169<br />
Bureau of Indian Affairs 4 106 5 500 9 606<br />
TOTAL 22 1,832 50 5,365 72 7,197<br />
O<strong>the</strong>r <strong>Fire</strong> Agencies<br />
TOTAL 6,046 94,849 50 5,365 6,096 100,214<br />
Data Source : The data for <strong>the</strong>se charts was taken from <strong>the</strong> Detailed Situation Reports of <strong>the</strong> various Geographic Area Coord<strong>in</strong>ation Centers.<br />
* State provided statistics were used <strong>in</strong> <strong>the</strong> caculations. Special Note:This is for approximately <strong>the</strong> first n<strong>in</strong>e months of 2002 only.<br />
158
Montana<br />
Wildland <strong>Fire</strong> Activity Summary<br />
Wildland <strong>Fire</strong>s Prescribed <strong>Fire</strong>s Wildland <strong>Fire</strong> Use TOTAL<br />
No. <strong>Fire</strong>s<br />
No. Acres<br />
Burned<br />
No. <strong>Fire</strong>s<br />
No. Acres<br />
Burned<br />
No. <strong>Fire</strong>s<br />
No. Acres<br />
Burned<br />
No. <strong>Fire</strong>s<br />
No. Acres<br />
Burned<br />
State <strong>Forestry</strong> Agency* 471 28,811 8 254 479 29,065<br />
Federal Land Management Agencies<br />
Forest Service 656 77,859 336 15,407 18 1,156 1,010 94,422<br />
Bureau of Land Management 61 7,085 15 5,920 76 13,005<br />
National Park Service 10 1 1 65 8 34 19 100<br />
Fish and Wildlife Service 15 807 15 807<br />
Bureau of Indian Affairs 350 8,420 9 725 359 9,145<br />
TOTAL 1,092 94,172 361 22,117 26 1,190 1,479 117,479<br />
O<strong>the</strong>r <strong>Fire</strong> Agencies* 2,520 10,288 4 1,693 2,524 11,981<br />
TOTAL 4,083 133,271 373 24,064 26 1,190 4,482 158,525<br />
Data Source : The data for <strong>the</strong>se charts was taken from <strong>the</strong> Detailed Situation Reports of <strong>the</strong> various Geographic Area Coord<strong>in</strong>ation Centers.<br />
* State provided statistics were used <strong>in</strong> <strong>the</strong> caculations.<br />
159
Nebraska<br />
Wildland <strong>Fire</strong> Activity Summary<br />
Wildland <strong>Fire</strong>s Prescribed <strong>Fire</strong>s Wildland <strong>Fire</strong> Use TOTAL<br />
No. <strong>Fire</strong>s<br />
No. Acres<br />
Burned<br />
No. <strong>Fire</strong>s<br />
No. Acres<br />
Burned<br />
No. <strong>Fire</strong>s<br />
No. Acres<br />
Burned<br />
No. <strong>Fire</strong>s<br />
No. Acres<br />
Burned<br />
State <strong>Forestry</strong> Agency* 1,835 90,562 1,835 90,562<br />
Federal Land Management Agencies<br />
Forest Service 11 136 11 136<br />
Bureau of Land Management<br />
National Park Service 4 9 1 618 5 627<br />
Fish and Wildlife Service 30 282 50 7,816 80 8,098<br />
Bureau of Indian Affairs<br />
TOTAL 45 427 51 8,434 96 8,861<br />
O<strong>the</strong>r <strong>Fire</strong> Agencies<br />
TOTAL 1,880 90,989 51 8,434 1,931 99,423<br />
Data Source : The data for <strong>the</strong>se charts was taken from <strong>the</strong> Detailed Situation Reports of <strong>the</strong> various Geographic Area Coord<strong>in</strong>ation Centers.<br />
* State provided statistics were used <strong>in</strong> <strong>the</strong> caculations.<br />
160
Nevada<br />
Wildland <strong>Fire</strong> Activity Summary<br />
Wildland <strong>Fire</strong>s Prescribed <strong>Fire</strong>s Wildland <strong>Fire</strong> Use TOTAL<br />
No. <strong>Fire</strong>s<br />
No. Acres<br />
Burned<br />
No. <strong>Fire</strong>s<br />
No. Acres<br />
Burned<br />
No. <strong>Fire</strong>s<br />
No. Acres<br />
Burned<br />
No. <strong>Fire</strong>s<br />
No. Acres<br />
Burned<br />
State <strong>Forestry</strong> Agency* 269 2,833 269 2,833<br />
Federal Land Management Agencies<br />
Forest Service 152 42,066 5 172 157 42,238<br />
Bureau of Land Management 499 34,149 49 14,567 12 8,528 560 57,244<br />
National Park Service 12 6 8 814 20 820<br />
Fish and Wildlife Service 9 456 2 480 11 936<br />
Bureau of Indian Affairs 10 316 10 316<br />
TOTAL 682 76,993 64 16,033 12 8,528 758 101,554<br />
O<strong>the</strong>r <strong>Fire</strong> Agencies 14 818 14 818<br />
TOTAL 965 80,644 64 16,033 12 8,528 1,041 105,205<br />
Data Source : The data for <strong>the</strong>se charts was taken from <strong>the</strong> Detailed Situation Reports of <strong>the</strong> various Geographic Area Coord<strong>in</strong>ation Centers.<br />
* State provided statistics were used <strong>in</strong> <strong>the</strong> caculations.<br />
161
New Mexico<br />
Wildland <strong>Fire</strong> Activity Summary<br />
Wildland <strong>Fire</strong>s Prescribed <strong>Fire</strong>s Wildland <strong>Fire</strong> Use TOTAL<br />
No. <strong>Fire</strong>s<br />
No. Acres<br />
Burned<br />
No. <strong>Fire</strong>s<br />
No. Acres<br />
Burned<br />
No. <strong>Fire</strong>s<br />
No. Acres<br />
Burned<br />
No. <strong>Fire</strong>s<br />
No. Acres<br />
Burned<br />
State <strong>Forestry</strong> Agency* 794 226,492 794 226,492<br />
Federal Land Management Agencies<br />
Forest Service 558 90,978 48 15,797 8 5,560 614 112,335<br />
Bureau of Land Management 47 13,819 9 1,962 56 15,781<br />
National Park Service 8 11,012 1 380 9 11,392<br />
Fish and Wildlife Service 8 85 9 4,577 17 4,662<br />
Bureau of Indian Affairs 384 13,784 4 90 388 13,874<br />
TOTAL 1,005 129,678 70 22,426 9 5,940 1,084 158,044<br />
O<strong>the</strong>r <strong>Fire</strong> Agencies<br />
TOTAL 1,799 356,170 70 22,426 9 5,940 1,878 384,536<br />
Data Source : The data for <strong>the</strong>se charts was taken from <strong>the</strong> Detailed Situation Reports of <strong>the</strong> various Geographic Area Coord<strong>in</strong>ation Centers.<br />
* State provided statistics were used <strong>in</strong> <strong>the</strong> caculations.<br />
162
North Dakota<br />
Wildland <strong>Fire</strong> Activity Summary<br />
Wildland <strong>Fire</strong>s Prescribed <strong>Fire</strong>s Wildland <strong>Fire</strong> Use TOTAL<br />
No. <strong>Fire</strong>s<br />
No. Acres<br />
Burned<br />
No. <strong>Fire</strong>s<br />
No. Acres<br />
Burned<br />
No. <strong>Fire</strong>s<br />
No. Acres<br />
Burned<br />
No. <strong>Fire</strong>s<br />
No. Acres<br />
Burned<br />
State <strong>Forestry</strong> Agency* 325 29,565 13 2,434 338 31,999<br />
Federal Land Management Agencies<br />
Forest Service 4 761 9 1,769 13 2,530<br />
Bureau of Land Management<br />
National Park Service 1 1 10 2,417 11 2,418<br />
Fish and Wildlife Service 20 1,418 134 19,341 154 20,759<br />
Bureau of Indian Affairs 658 27,067 658 27,067<br />
TOTAL 683 29,247 153 23,527 836 52,774<br />
O<strong>the</strong>r <strong>Fire</strong> Agencies 2 114 2 114<br />
TOTAL 1,008 58,812 168 26,075 1,176 84,887<br />
Data Source : The data for <strong>the</strong>se charts was taken from <strong>the</strong> Detailed Situation Reports of <strong>the</strong> various Geographic Area Coord<strong>in</strong>ation Centers.<br />
* State provided statistics were used <strong>in</strong> <strong>the</strong> caculations.<br />
163
Oregon<br />
Wildland <strong>Fire</strong> Activity Summary<br />
Wildland <strong>Fire</strong>s Prescribed <strong>Fire</strong>s Wildland <strong>Fire</strong> Use TOTAL<br />
No. <strong>Fire</strong>s<br />
No. Acres<br />
Burned<br />
No. <strong>Fire</strong>s<br />
No. Acres<br />
Burned<br />
No. <strong>Fire</strong>s<br />
No. Acres<br />
Burned<br />
No. <strong>Fire</strong>s<br />
No. Acres<br />
Burned<br />
State <strong>Forestry</strong> Agency* 1,175 99,047 1,754 67,220 2,929 166,267<br />
Federal Land Management Agencies<br />
Forest Service 1,127 752,782 324 50,891 2 1 1,453 803,674<br />
Bureau of Land Management 319 153,878 156 37,097 475 190,975<br />
National Park Service 20 14 7 62 27 76<br />
Fish and Wildlife Service 15 1,839 9 6,193 24 8,032<br />
Bureau of Indian Affairs 81 2,829 17 4,316 98 7,145<br />
TOTAL 1,562 911,342 513 98,559 2 1 2,077 1,009,902<br />
O<strong>the</strong>r <strong>Fire</strong> Agencies<br />
TOTAL 2,737 1,010,389 2,267 165,779 2 1 5,006 1,176,169<br />
Data Source : The data for <strong>the</strong>se charts was taken from <strong>the</strong> Detailed Situation Reports of <strong>the</strong> various Geographic Area Coord<strong>in</strong>ation Centers.<br />
* State provided statistics were used <strong>in</strong> <strong>the</strong> caculations.<br />
164
South Dakota<br />
Wildland <strong>Fire</strong> Activity Summary<br />
Wildland <strong>Fire</strong>s Prescribed <strong>Fire</strong>s Wildland <strong>Fire</strong> Use TOTAL<br />
No. <strong>Fire</strong>s<br />
No. Acres<br />
Burned<br />
No. <strong>Fire</strong>s<br />
No. Acres<br />
Burned<br />
No. <strong>Fire</strong>s<br />
No. Acres<br />
Burned<br />
No. <strong>Fire</strong>s<br />
No. Acres<br />
Burned<br />
State <strong>Forestry</strong> Agency* 725 166,928 1 150 726 167,078<br />
Federal Land Management Agencies<br />
Forest Service 170 1,822 10 2,977 180 4,799<br />
Bureau of Land Management<br />
National Park Service 14 1,072 3 1,469 17 2,541<br />
Fish and Wildlife Service 6 33 42 5,651 48 5,684<br />
Bureau of Indian Affairs 327 15,788 327 15,788<br />
TOTAL 517 18,715 55 10,097 572 28,812<br />
O<strong>the</strong>r <strong>Fire</strong> Agencies 107 12,862 107 12,862<br />
TOTAL 1,349 198,505 56 10,247 1,405 208,752<br />
Data Source : The data for <strong>the</strong>se charts was taken from <strong>the</strong> Detailed Situation Reports of <strong>the</strong> various Geographic Area Coord<strong>in</strong>ation Centers.<br />
* State provided statistics were used <strong>in</strong> <strong>the</strong> caculations.<br />
165
Utah<br />
Wildland <strong>Fire</strong> Activity Summary<br />
Wildland <strong>Fire</strong>s Prescribed <strong>Fire</strong>s Wildland <strong>Fire</strong> Use TOTAL<br />
No. <strong>Fire</strong>s<br />
No. Acres<br />
Burned<br />
No. <strong>Fire</strong>s<br />
No. Acres<br />
Burned<br />
No. <strong>Fire</strong>s<br />
No. Acres<br />
Burned<br />
No. <strong>Fire</strong>s<br />
No. Acres<br />
Burned<br />
State <strong>Forestry</strong> Agency 613 68,534 21 595 634 69,129<br />
Federal Land Management Agencies<br />
Forest Service 342 101,135 23 27,501 2 345 367 128,981<br />
Bureau of Land Management 369 70,012 18 5,055 387 75,067<br />
National Park Service 29 35 7 1,209 36 1,244<br />
Fish and Wildlife Service 5 1 425 6 425<br />
Bureau of Indian Affairs 67 5,326 1 7 68 5,333<br />
TOTAL 812 176,508 50 34,197 2 345 864 211,050<br />
O<strong>the</strong>r <strong>Fire</strong> Agencies 6 127 6 127<br />
TOTAL 1,431 245,169 71 34,792 2 345 1,504 280,306<br />
Data Source : The data for <strong>the</strong>se charts was taken from <strong>the</strong> Detailed Situation Reports of <strong>the</strong> various Geographic Area Coord<strong>in</strong>ation Centers.<br />
* State provided statistics were used <strong>in</strong> <strong>the</strong> caculations.<br />
166
Wash<strong>in</strong>gton<br />
Wildland <strong>Fire</strong> Activity Summary<br />
Wildland <strong>Fire</strong>s Prescribed <strong>Fire</strong>s Wildland <strong>Fire</strong> Use TOTAL<br />
No. <strong>Fire</strong>s<br />
No. Acres<br />
Burned<br />
No. <strong>Fire</strong>s<br />
No. Acres<br />
Burned<br />
No. <strong>Fire</strong>s<br />
No. Acres<br />
Burned<br />
No. <strong>Fire</strong>s<br />
No. Acres<br />
Burned<br />
State <strong>Forestry</strong> Agency* 889 10,063 6 292 895 10,355<br />
Federal Land Management Agencies<br />
Forest Service 337 58,220 198 10,858 4 11 539 69,089<br />
Bureau of Land Management 21 5,123 21 5,123<br />
National Park Service 36 69 3 192 39 261<br />
Fish and Wildlife Service 24 627 28 2,441 52 3,068<br />
Bureau of Indian Affairs 195 15,537 18 3,372 213 18,909<br />
TOTAL 613 79,576 247 16,863 4 11 864 96,450<br />
O<strong>the</strong>r <strong>Fire</strong> Agencies 1 2,000 1 2,000<br />
TOTAL 1,503 91,639 253 17,155 4 11 1,760 108,805<br />
Data Source : The data for <strong>the</strong>se charts was taken from <strong>the</strong> Detailed Situation Reports of <strong>the</strong> various Geographic Area Coord<strong>in</strong>ation Centers.<br />
* State provided statistics were used <strong>in</strong> <strong>the</strong> caculations.<br />
167
Wyom<strong>in</strong>g<br />
Wildland <strong>Fire</strong> Activity Summary<br />
Wildland <strong>Fire</strong>s Prescribed <strong>Fire</strong>s Wildland <strong>Fire</strong> Use TOTAL<br />
No. <strong>Fire</strong>s<br />
No. Acres<br />
Burned<br />
No. <strong>Fire</strong>s<br />
No. Acres<br />
Burned<br />
No. <strong>Fire</strong>s<br />
No. Acres<br />
Burned<br />
No. <strong>Fire</strong>s<br />
No. Acres<br />
Burned<br />
State <strong>Forestry</strong> Agency* 815 163,226 1 1 816 163,227<br />
Federal Land Management Agencies<br />
Forest Service 182 31,204 24 5,279 2 2,620 208 39,103<br />
Bureau of Land Management 155 32,217 12 1,681 10 167 33,908<br />
National Park Service 70 9,149 6 4,032 7 3,162 83 16,343<br />
Fish and Wildlife Service 1 20 1 20<br />
Bureau of Indian Affairs 26 15,819 26 15,819<br />
TOTAL 434 88,409 42 10,992 9 5,792 485 105,193<br />
O<strong>the</strong>r <strong>Fire</strong> Agencies 88 36,491 88 36,491<br />
TOTAL 1,337 288,126 43 10,993 9 5,792 1,389 304,911<br />
Data Source : The data for <strong>the</strong>se charts was taken from <strong>the</strong> Detailed Situation Reports of <strong>the</strong> various Geographic Area Coord<strong>in</strong>ation Centers.<br />
* State provided statistics were used <strong>in</strong> <strong>the</strong> caculations.<br />
168
State <strong>Fire</strong> Statistics<br />
Numbers of <strong>Fire</strong>s and Acres Burned<br />
by<br />
Cause and Size Class<br />
1998 through 2002<br />
Number of <strong>Fire</strong>s<br />
Number of Acres Burned<br />
No. of <strong>Fire</strong>s<br />
30,000<br />
25,000<br />
20,000<br />
15,000<br />
10,000<br />
5,000<br />
0<br />
16,894<br />
26,439<br />
25,324<br />
25,494 25,097<br />
20,936 19,180 23,301 20,390<br />
19,577<br />
1993 1994 1995 1996 1997 1998 1999 2000 2001 2002<br />
Years<br />
No. of Acres Burned<br />
3,000,000<br />
2,500,000<br />
2,000,000<br />
1,500,000<br />
1,000,000<br />
500,000<br />
0<br />
2,612,619<br />
2,213,124 2,198,083<br />
1,350,726<br />
1,430,853 1,309,405<br />
648,144<br />
644,237 552,134<br />
564,356<br />
1993<br />
1994<br />
1995<br />
1996<br />
1997<br />
1998<br />
1999<br />
2000<br />
2001<br />
2002<br />
Years<br />
169
<strong>West</strong>ern State Composite Statistics<br />
1998 1999 2000<br />
2001 2002<br />
5-year Average<br />
No. No. Acres No. No. Acres No. No. Acres No. No. Acres No. No. Acres No. No. Acres<br />
<strong>Fire</strong>s Burned <strong>Fire</strong>s Burned <strong>Fire</strong>s Burned <strong>Fire</strong>s Burned <strong>Fire</strong>s Burned <strong>Fire</strong>s Burned<br />
19,180 564,356 23,301 1,309,405 25,494 2,213,124 20,390 648,144 25,097 2,198,083 22,692 1,386,622<br />
No.<br />
<strong>Fire</strong>s<br />
No. Acres<br />
Burned<br />
% No.<br />
<strong>Fire</strong>s<br />
No. Acres<br />
Burned<br />
% No.<br />
<strong>Fire</strong>s<br />
No. Acres<br />
Burned<br />
% No.<br />
<strong>Fire</strong>s<br />
No. Acres<br />
Burned<br />
% No.<br />
<strong>Fire</strong>s<br />
No. Acres<br />
Burned<br />
% No.<br />
<strong>Fire</strong>s<br />
No. Acres<br />
Burned<br />
%<br />
Lightn<strong>in</strong>g 2,663 264,614 14 2,396 370,301 10 4,051 1,106,661 16 3,270 293,093 16 3,270 1,300,528 13 3,130 667,039 14<br />
Camper 623 2,411 3 884 6,912 4 851 8,917 3 857 7,345 4 731 15,177 3 789 8,152 3<br />
Smoker 757 6,191 4 950 23,121 4 1,056 25,202 4 704 4,364 3 1,294 9,318 5 952 13,639 4<br />
Debris Burn<strong>in</strong>g 4,401 47,862 23 5,347 146,606 23 5,168 149,776 20 3,159 23,982 15 4,658 97,948 19 4,547 93,235 20<br />
Arson 2,014 39,577 11 1,304 81,293 6 2,089 121,566 8 1,987 26,533 10 1,971 115,612 8 1,873 76,916 8<br />
Equipment 2,935 64,061 15 3,724 186,500 16 3,375 234,618 13 3,539 148,604 17 3,012 183,283 12 3,317 163,413 15<br />
Railroads 431 6,050 2 653 133,387 3 695 78,188 3 204 3,819 1 335 2,814 1 464 44,852 2<br />
Children 601 7,090 3 512 2,579 2 546 1,908 2 552 1,539 3 478 6,875 2 538 3,998 2<br />
Miscellaneous 4,755 139,526 25 7,501 359,185 32 7,663 488,632 30 6,118 141,589 30 9,348 468,899 37 7,077 319,566 31<br />
No. No. Acres<br />
% No. No. Acres<br />
% No. No. Acres<br />
% No. No. Acres<br />
% No. No. Acres<br />
No. Acres<br />
% No. <strong>Fire</strong>s<br />
%<br />
<strong>Fire</strong>s Burned <strong>Fire</strong>s Burned <strong>Fire</strong>s Burned <strong>Fire</strong>s Burned <strong>Fire</strong>s Burned<br />
Burned<br />
Class A 9,864 14,430 51 12,601 1,155 54 11,246 7,525 44 11,975 3,975 59 13,341 5,554 53 11,805 6,528 52<br />
Class B 6,792 9,630 35 7,139 13,182 31 9,529 17,184 37 6,494 11,128 32 7,653 22,469 30 7,521 14,719 33<br />
Class C 1,951 42,003 10 2,730 49,291 12 3,588 73,534 14 1,485 40,926 7 2,323 69,105 9 2,415 54,972 11<br />
Class D 308 38,922 2 436 45,400 2 544 77,172 2 228 32,711 1 377 55,582 2 379 49,957 2<br />
Class E 162 86,407 1 235 95,617 1 332 154,116 1 118 54,736 1 180 88,650 1 205 95,905 1<br />
Class F 82 154,229 0 108 220,812 0 161 370,400 1 64 121,359 0 121 308,926 0 107 235,145 0<br />
Class G 21 227,118 0 52 883,948 0 94 1,515,724 0 26 384,184 0 91 1,699,639 0 57 942,123 0<br />
170
Alaska<br />
1998 1999 2000<br />
2001 2002<br />
5-year Average<br />
No. No. Acres No. No. Acres No. No. Acres No. No. Acres No. No. Acres No. No. Acres<br />
<strong>Fire</strong>s Burned <strong>Fire</strong>s Burned <strong>Fire</strong>s Burned <strong>Fire</strong>s Burned <strong>Fire</strong>s Burned <strong>Fire</strong>s Burned<br />
338 63,708 333 145,806 259 35,197 297 87,127 399 802,515 325 226,871<br />
No. No. Acres<br />
% No. No. Acres<br />
% No. No. Acres<br />
% No. No. Acres<br />
% No. No. Acres<br />
% No. No. Acres<br />
<strong>Fire</strong>s Burned <strong>Fire</strong>s Burned <strong>Fire</strong>s Burned <strong>Fire</strong>s Burned <strong>Fire</strong>s Burned <strong>Fire</strong>s Burned<br />
%<br />
Lightn<strong>in</strong>g 16 62,922 5 31 144,752 9 13 32,892 5 18 868 6 80 584,782 20 32 165,243 10<br />
Camper 49 43 14 42 9 13 41 643 16 50 262 17 34 1,314 9 43 454 13<br />
Smoker 9 2 3 8 1 2 6 1,121 2 11 1 4 7 3 2 8 226 3<br />
Debris Burn<strong>in</strong>g 106 87 31 96 748 29 81 50 31 103 916 35 146 26,578 37 106 5,676 33<br />
Arson 25 6 7 16 5 5 6 7 2 3 1 1 3 4 1 11 5 3<br />
Equipment 4 1 1 12 3 4 10 440 4 43 84,842 14 27 14 7 19 17,060 6<br />
Railroads 4 1 1 0 1 1 0 0 0 0 0 0 0 1 0 0<br />
Children 31 9 9 31 108 9 19 3 7 23 10 8 24 105 6 26 47 8<br />
Miscellaneous 94 637 28 97 180 29 82 40 32 46 227 15 78 189,715 20 79 38,160 24<br />
No. No. Acres<br />
% No. No. Acres<br />
% No. No. Acres<br />
% No. No. Acres<br />
% No. No. Acres<br />
% No. No. Acres<br />
<strong>Fire</strong>s Burned <strong>Fire</strong>s Burned <strong>Fire</strong>s Burned <strong>Fire</strong>s Burned <strong>Fire</strong>s Burned <strong>Fire</strong>s Burned<br />
%<br />
Class A 249 27 74 243 27 73 186 21 72 205 23 69 241 28 60 225 25 69<br />
Class B 71 103 21 70 92 21 61 78 24 78 133 26 114 200 29 79 121 24<br />
Class C 11 362 3 8 226 2 6 96 2 7 154 2 18 722 5 10 312 3<br />
Class D 2 415 1 3 455 1 0 0 0 4 590 1 2 378 1 2 368 1<br />
Class E 1 500 0 3 1,978 1 2 1,039 1 2 1,497 1 2 1,245 1 2 1,252 1<br />
Class F 1 3,381 0 0 0 3 5,056 1 0 0 0 6 19,371 2 2 5,562 1<br />
Class G 3 58,920 1 6 143,028 2 1 28,907 0 1 84,730 0 16 780,571 4 5 219,231 2<br />
171
Arizona<br />
1998 1999 2000<br />
2001 2002<br />
5-year Average<br />
No. No. Acres No. No. Acres No. No. Acres No. No. Acres No. No. Acres No. No. Acres<br />
<strong>Fire</strong>s Burned <strong>Fire</strong>s Burned <strong>Fire</strong>s Burned <strong>Fire</strong>s Burned <strong>Fire</strong>s Burned <strong>Fire</strong>s Burned<br />
396 3,057 438 8,722 481 7,921 406 4,699 530 46,645 450 14,209<br />
No. No. Acres<br />
% No. No. Acres<br />
% No. No. Acres<br />
% No. No. Acres<br />
% No. No. Acres<br />
% No. No. Acres<br />
<strong>Fire</strong>s Burned <strong>Fire</strong>s Burned <strong>Fire</strong>s Burned <strong>Fire</strong>s Burned <strong>Fire</strong>s Burned <strong>Fire</strong>s Burned<br />
%<br />
Lightn<strong>in</strong>g 46 174 12 45 5,123 10 87 2,730 18 99 968 24 80 7,301 15 71 3,259 16<br />
Camper 8 12 2 6 10 1 6 4 1 8 5 2 20 2,915 4 10 589 2<br />
Smoker 40 37 10 33 24 8 18 12 4 24 23 6 55 103 10 34 40 8<br />
Debris Burn<strong>in</strong>g 35 62 9 34 620 8 46 857 10 44 590 11 56 11,033 11 43 2,632 10<br />
Arson 9 291 2 6 45 1 7 31 1 5 864 1 9 9,561 2 7 2,158 2<br />
Equipment 30 52 8 29 30 7 52 52 11 46 517 11 58 10,665 11 43 2,263 10<br />
Railroads 9 847 2 9 27 2 4 2 1 3 2 1 10 8 2 7 177 2<br />
Children 3 5 1 7 6 2 2 5 0 7 27 2 5 11 1 5 11 1<br />
Miscellaneous 216 1,577 55 269 2,837 61 259 4,228 54 170 1,703 42 237 5,048 45 230 3,079 51<br />
No. No. Acres<br />
% No. No. Acres<br />
% No. No. Acres<br />
% No. No. Acres<br />
% No. No. Acres<br />
% No. No. Acres<br />
<strong>Fire</strong>s Burned <strong>Fire</strong>s Burned <strong>Fire</strong>s Burned <strong>Fire</strong>s Burned <strong>Fire</strong>s Burned <strong>Fire</strong>s Burned<br />
%<br />
Class A 208 29 47 230 84 53 248 34 ### 225 32 55 290 40 55 240 44 53<br />
Class B 151 262 34 167 366 38 174 348 ### 144 283 35 193 702 36 166 392 37<br />
Class C 28 846 6 32 887 7 45 1,319 ### 26 687 6 26 2,059 5 31 1,160 7<br />
Class D 7 860 2 3 349 1 5 860 ### 6 993 1 8 1,485 2 6 909 1<br />
Class E 2 1,060 0 4 2,214 1 8 4,080 ### 5 2,704 1 5 2,972 1 5 2,606 1<br />
Class F 2 4,822 0 1 1,280 ### 5% 8,726 0 1 2,966 0<br />
Class G 3 30,661 1<br />
172
California<br />
1998 1999 2000<br />
2001 2002<br />
5-year Average<br />
No. No. Acres No. No. Acres No. No. Acres No. No. Acres No. No. Acres No. No. Acres<br />
<strong>Fire</strong>s Burned <strong>Fire</strong>s Burned <strong>Fire</strong>s Burned <strong>Fire</strong>s Burned <strong>Fire</strong>s Burned <strong>Fire</strong>s Burned<br />
5,227 92,456 7,296 277,750 5,149 66,684 6,223 90,985 5,759 112,810 5,931 128,137<br />
137% 137% 137%<br />
No. No. Acres<br />
% No. No. Acres<br />
% No. No. Acres<br />
% No. No. Acres<br />
% No. No. Acres<br />
% No. No. Acres<br />
<strong>Fire</strong>s Burned <strong>Fire</strong>s Burned <strong>Fire</strong>s Burned <strong>Fire</strong>s Burned <strong>Fire</strong>s Burned <strong>Fire</strong>s Burned<br />
%<br />
Lightn<strong>in</strong>g 237 17,396 5 448 70,154 6 154 219 3 341 1,496 5 114 196 2 259 17,892 4<br />
Camper 225 275 4 319 1,470 4 204 1,498 4 288 6,077 5 157 74 3 239 1,879 4<br />
Smoker 126 1,144 2 142 373 2 137 269 3 164 2,453 3 144 1,041 3 143 1,056 2<br />
Debris Burn<strong>in</strong>g 508 921 10 711 3,139 10 623 9,486 12 562 1,469 9 633 8,735 11 607 4,750 10<br />
Arson 372 31,872 7 492 43,280 7 295 4,983 6 403 16,573 6 402 3,831 7 393 20,108 7<br />
Equipment 2,230 32,970 43 2,636 105,267 36 2,181 44,953 42 2,413 28,599 39 1,518 85,001 26 2,196 59,358 37<br />
Railroads 17 69 0 28 283 0 34 69 1 27 375 0 14 44 0 24 168 0<br />
Children 102 121 2 143 366 2 98 130 2 131 271 2 104 43 2 116 186 2<br />
Miscellaneous 1,410 7,688 27 2,377 53,418 33 1,423 5,077 28 1,894 33,672 30 2,673 13,845 46 1,955 22,740 33<br />
No. No. Acres<br />
% No. No. Acres<br />
% No. No. Acres<br />
% No. No. Acres<br />
% No. No. Acres<br />
% No. No. Acres<br />
<strong>Fire</strong>s Burned <strong>Fire</strong>s Burned <strong>Fire</strong>s Burned <strong>Fire</strong>s Burned <strong>Fire</strong>s Burned <strong>Fire</strong>s Burned<br />
%<br />
Class A 3,845 104 74 5,285 156 72 3,657 109 71 4,437 123 71 4,130 1,368 72 4,271 372 72<br />
Class B 1,134 2,008 22 1,671 2,925 23 1,290 2,174 25 1,494 2,512 24 1,338 2,224 23 1,385 2,369 23<br />
Class C 184 5,443 4 230 6,127 3 146 4,039 3 229 6,960 4 215 7,445 4 201 6,003 3<br />
Class D 31 5,412 1 43 6,435 1 32 5,522 1 25 4,189 0 49 8,066 1 36 5,925 1<br />
Class E 18 9,737 0 34 18,367 0 14 6,939 0 23 11,959 0 15 8,540 0 21 11,108 0<br />
Class F 11 23,988 0 24 43,108 0 6 13,902 0 10 20,767 0 10 17,714 0 12 23,896 0<br />
Class G 4 45,764 0 9 200,632 0 4 33,999 0 5 44,475 0 2 67,453 0 5 78,465 0<br />
173
Colorado<br />
1998 1999 2000<br />
2001 2002<br />
5-year Average<br />
No. No. Acres No. No. Acres No. No. Acres No. No. Acres No. No. Acres No. No. Acres<br />
<strong>Fire</strong>s Burned <strong>Fire</strong>s Burned <strong>Fire</strong>s Burned <strong>Fire</strong>s Burned <strong>Fire</strong>s Burned <strong>Fire</strong>s Burned<br />
1,349 10,282 1,987 33,255 2,043 76,288 2,966 45,816 3,409 244,252 2,351 81,979<br />
No. No. Acres<br />
% No. No. Acres<br />
% No. No. Acres<br />
% No. No. Acres<br />
% No. No. Acres<br />
% No. No. Acres<br />
<strong>Fire</strong>s Burned <strong>Fire</strong>s Burned <strong>Fire</strong>s Burned <strong>Fire</strong>s Burned <strong>Fire</strong>s Burned <strong>Fire</strong>s Burned<br />
%<br />
Lightn<strong>in</strong>g 142 506 11 106 2,193 5 399 27,689 20 521 38,506 18 408 151,922 12 315 44,163 13<br />
Camper 7 9 1 10 8 1 44 16 2 51 30 2 37 23 1 30 17 1<br />
Smoker 68 264 5 63 7,937 3 70 722 3 76 205 3 109 2,459 3 77 2,317 3<br />
Debris Burn<strong>in</strong>g 300 6,542 22 402 14,657 20 321 5,167 16 384 1,257 13 583 7,348 17 398 6,994 17<br />
Arson 81 129 6 108 2,281 5 120 3,564 6 234 345 8 265 3,055 8 162 1,875 7<br />
Equipment 60 139 4 47 465 2 42 166 2 88 2,014 3 61 309 2 60 619 3<br />
Railroads 4 60 0 2 3 0 2 300 0 17 10 1 30 272 1 11 129 0<br />
Children 85 471 6 29 58 1 44 17 2 104 153 4 75 107 2 67 161 3<br />
Miscellaneous 602 2,162 30 1,220 5,653 36 1,001 38,647 49 1,491 3,296 50 1,841 78,757 54 1,231 25,703 52<br />
No. No. Acres<br />
% No. No. Acres<br />
% No. No. Acres<br />
% No. No. Acres<br />
% No. No. Acres<br />
% No. No. Acres<br />
<strong>Fire</strong>s Burned <strong>Fire</strong>s Burned <strong>Fire</strong>s Burned <strong>Fire</strong>s Burned <strong>Fire</strong>s Burned <strong>Fire</strong>s Burned<br />
%<br />
Class A 810 83 60 1,417 122 71 1,293 116 63 2,055 190 69 2,182 136 64 1,551 129 66<br />
Class B 463 831 34 426 744 21 551 909 27 789 1,173 27 951 1,705 28 636 1,072 27<br />
Class C 62 1,698 5 91 2,238 5 109 3,402 5 97 2,655 3 199 5,747 6 112 3,148 5<br />
Class D 7 1,080 1 29 4,489 1 40 5,550 2 13 1,669 0 27 4,083 1 23 3,374 1<br />
Class E 4 2,090 0 17 7,762 1 36 17,951 2 7 3,129 0 19 9,404 1 17 8,067 1<br />
Class F 3 4,500 0 5 6,900 0 10 18,260 0 4 7,000 0 17 39,969 0 8 15,326 0<br />
Class G 2 11,000 ### 4 30,100 0 1 30,000 0 14 183,208 0 4 50,862 0<br />
174
Guam<br />
1998 1999 2000<br />
2001 2002<br />
5-year Average<br />
No. No. Acres No. No. Acres No. No. Acres No. No. Acres No. No. Acres No. No. Acres<br />
<strong>Fire</strong>s Burned <strong>Fire</strong>s Burned <strong>Fire</strong>s Burned <strong>Fire</strong>s Burned <strong>Fire</strong>s Burned <strong>Fire</strong>s Burned<br />
1,943 13,315 516 485 996 3,409 1,244 2,865 491 2,434 1,038 4,502<br />
No.<br />
<strong>Fire</strong>s<br />
No. Acres<br />
Burned<br />
% No.<br />
<strong>Fire</strong>s<br />
No. Acres<br />
Burned<br />
% No.<br />
<strong>Fire</strong>s<br />
No. Acres<br />
Burned<br />
% No.<br />
<strong>Fire</strong>s<br />
No. Acres<br />
Burned<br />
% No.<br />
<strong>Fire</strong>s<br />
No. Acres<br />
Burned<br />
% No.<br />
<strong>Fire</strong>s<br />
No. Acres<br />
Burned<br />
Lightn<strong>in</strong>g<br />
Camper 1 1 0 0 0 0<br />
Smoker 27 65 5 5 13 1<br />
Debris Burn<strong>in</strong>g 733 3,632 38 483 414 94 201 291 20 276 441 22 95 44 19 485 1,682 47<br />
Arson 1,082 9,394 56 745 3,053 75 891 2,282 72 343 2,327 70 760 4,825 73<br />
Equipment<br />
Railroads 6 6 1 1 1 0<br />
Children 128 289 7 50 65 5 76 141 6 53 63 11 76 157 7<br />
Miscellaneous<br />
%<br />
No. No. Acres<br />
% No. No. Acres<br />
% No. No. Acres<br />
% No. No. Acres<br />
% No. No. Acres<br />
% No. No. Acres<br />
<strong>Fire</strong>s Burned <strong>Fire</strong>s Burned <strong>Fire</strong>s Burned <strong>Fire</strong>s Burned <strong>Fire</strong>s Burned <strong>Fire</strong>s Burned<br />
%<br />
Class A 415 74 21 218 15 42 259 34 26 429 104 34 110 14 22 347 60 26<br />
Class B 1,292 3,271 66 293 403 57 668 1,008 67 752 1,640 60 331 750 67 859 1,919 65<br />
Class C 217 5,038 11 5 67 1 62 1,489 6 56 1,121 5 45 1,048 9 111 2,551 8<br />
Class D 16 2,312 1 7 878 1 7 1 5 622 1 9 1,100 1<br />
Class E 2 650 0 1 260 0<br />
Class F 1 1,970 0 0 788 0<br />
Class G<br />
175
Hawaii<br />
1998 1999 2000<br />
2001 2002<br />
5-year Average<br />
No. No. Acres No. No. Acres No. No. Acres No. No. Acres No. No. Acres No. No. Acres<br />
<strong>Fire</strong>s Burned <strong>Fire</strong>s Burned <strong>Fire</strong>s Burned <strong>Fire</strong>s Burned <strong>Fire</strong>s Burned <strong>Fire</strong>s Burned<br />
205 37,315 132 20,376 125 2,931 108 1,080 188 2,377 152 12,816<br />
No. No. Acres<br />
% No. No. Acres<br />
% No. No. Acres<br />
% No. No. Acres<br />
% No. No. Acres<br />
% No. No. Acres<br />
<strong>Fire</strong>s Burned <strong>Fire</strong>s Burned <strong>Fire</strong>s Burned <strong>Fire</strong>s Burned <strong>Fire</strong>s Burned <strong>Fire</strong>s Burned<br />
%<br />
Lightn<strong>in</strong>g 1 20 1 1 2 1 1 1 1 4 0<br />
Camper 9 1 4 3 2 2 3 1 2 8 6 7 9 1 5 6 2 4<br />
Smoker 16 2,259 8 5 84 4 13 9 10 13 16 12 12 28 6 12 479 8<br />
Debris Burn<strong>in</strong>g 28 82 14 14 291 11 22 242 18 7 18 6 23 9 12 19 128 12<br />
Arson 49 3,290 24 25 14,174 19 18 74 14 13 118 12 16 139 9 24 3,559 16<br />
Equipment 16 848 8 8 572 6 11 2,197 9 5 61 5 7 1 4 9 736 6<br />
Railroads<br />
Children 11 2,474 5 4 7 3 13 13 10 3 12 3 5 2 3 7 502 5<br />
Miscellaneous 76 28,361 37 72 5,226 55 44 393 35 59 849 55 115 2,197 61 73 7,405 48<br />
No. No. Acres<br />
% No. No. Acres<br />
% No. No. Acres<br />
% No. No. Acres<br />
% No. No. Acres<br />
% No. No. Acres<br />
<strong>Fire</strong>s Burned <strong>Fire</strong>s Burned <strong>Fire</strong>s Burned <strong>Fire</strong>s Burned <strong>Fire</strong>s Burned <strong>Fire</strong>s Burned<br />
%<br />
Class A 68 10 33 50 10 38 48 7 38 40 11 37 147 15 78 71 11 47<br />
Class B 77 149 38 61 223 46 60 146 48 44 133 41 27 57 14 54 142 35<br />
Class C 36 2,255 18 16 408 12 12 270 10 23 545 21 12 350 6 20 766 13<br />
Class D 9 1,896 4 1 235 1 2 350 2 1 255 1 3 547 2<br />
Class E 9 4,895 4 1 500 1 2 1,150 2 1 391 1 3 1,387 2<br />
Class F 5 15,657 2 1 4,000 1 1 1,008 1 1 1,700 1 2 4,473 1<br />
Class G 1 12,453 0 2 15,000 2 1 5,491 0<br />
176
Idaho<br />
1998 1999 2000<br />
2001 2002<br />
5-year Average<br />
No. No. Acres No. No. Acres No. No. Acres No. No. Acres No. No. Acres No. No. Acres<br />
<strong>Fire</strong>s Burned <strong>Fire</strong>s Burned <strong>Fire</strong>s Burned <strong>Fire</strong>s Burned <strong>Fire</strong>s Burned <strong>Fire</strong>s Burned<br />
362 29,041 431 78,641 801 142,195 547 52,728 386 7,972 505 62,115<br />
No. No. Acres<br />
% No. No. Acres<br />
% No. No. Acres<br />
% No. No. Acres<br />
% No. No. Acres<br />
% No. No. Acres<br />
<strong>Fire</strong>s Burned <strong>Fire</strong>s Burned <strong>Fire</strong>s Burned <strong>Fire</strong>s Burned <strong>Fire</strong>s Burned <strong>Fire</strong>s Burned<br />
%<br />
Lightn<strong>in</strong>g 217 23,473 60 215 49,727 50 367 108,333 46 251 11,529 46 189 4,969 49 248 39,606 49<br />
Camper 19 29 5 33 19 8 66 50 8 47 30 9 30 104 8 39 46 8<br />
Smoker 7 8 2 15 8 3 29 25 4 4 1 1 5 3 1 12 9 2<br />
Debris Burn<strong>in</strong>g 54 168 15 77 981 18 128 723 16 53 227 10 55 536 14 73 527 15<br />
Arson 5 157 1 14 10 3 18 1,604 2 23 1,527 4 12 187 3 14 697 3<br />
Equipment 17 4,112 5 17 190 4 64 8,679 8 35 3,116 6 38 1,271 10 34 3,474 7<br />
Railroads 6 4 2 6 15 1 12 29 1 6 14 1 1 1 0 6 13 1<br />
Children 8 1 2 9 4 2 19 122 2 13 225 2 8 560 2 11 182 2<br />
Miscellaneous 29 1,089 8 45 27,687 10 98 22,630 12 115 36,059 21 48 341 12 67 17,561 13<br />
No. No. Acres<br />
% No. No. Acres<br />
% No. No. Acres<br />
% No. No. Acres<br />
% No. No. Acres<br />
% No. No. Acres<br />
<strong>Fire</strong>s Burned <strong>Fire</strong>s Burned <strong>Fire</strong>s Burned <strong>Fire</strong>s Burned <strong>Fire</strong>s Burned <strong>Fire</strong>s Burned<br />
%<br />
Class A 256 28 71 287 36 67 505 66 63 343 43 63 242 25 63 327 40 65<br />
Class B 82 137 23 111 211 26 221 467 28 144 325 26 110 214 28 134 271 26<br />
Class C 17 570 5 17 541 4 45 1,492 6 27 896 5 24 823 6 26 864 5<br />
Class D 3 694 1 4 642 1 12 2,230 1 15 2,472 3 3 408 1 7 1,289 1<br />
Class E 2 1,715 1 3 1,685 1 6 3,771 1 10 5,314 2 5 2,298 1 5 2,957 1<br />
Class F 1 2,958 0 6 15,523 1 7 14,541 1 5 8,101 1 2 4,204 1 4 9,065 1<br />
Class G 1 22,939 0 3 60,003 1 5 119,628 1 3 35,577 1 2 47,629 0<br />
177
Kansas<br />
1998 1999 2000 2001* 2002<br />
5-year Average<br />
No. No. Acres No. No. Acres No. No. Acres No. No. Acres No. No. Acres No. No. Acres<br />
<strong>Fire</strong>s Burned <strong>Fire</strong>s Burned <strong>Fire</strong>s Burned <strong>Fire</strong>s Burned <strong>Fire</strong>s Burned <strong>Fire</strong>s Burned<br />
3,238 31,676 4,732 35,699 6,439 83,244 3,101 35,092 6,024 93,017 4,707 55,746<br />
No. No. Acres<br />
% No. No. Acres<br />
% No. No. Acres<br />
% No. No. Acres<br />
% No. No. Acres<br />
% No. No. Acres<br />
<strong>Fire</strong>s Burned <strong>Fire</strong>s Burned <strong>Fire</strong>s Burned <strong>Fire</strong>s Burned <strong>Fire</strong>s Burned <strong>Fire</strong>s Burned<br />
%<br />
Lightn<strong>in</strong>g 239 994 7 152 815 3 382 8,914 6 179 1,514 6 299 3,421 5 250 3,132 5<br />
Camper 5 205 0 1 41 0<br />
Smoker 264 929 8 327 2,342 7 461 2,873 7 244 991 8 650 4,046 11 389 2,236 8<br />
Debris Burn<strong>in</strong>g 1,467 15,158 45 1,664 18,199 35 1,869 26,749 29 813 7,999 26 1,473 21,173 24 1,457 17,856 31<br />
Arson 163 1,179 5 412 2,488 9 524 4,415 8 263 2,546 8 617 5,782 10 396 3,282 8<br />
Equipment 64 891 2 98 2,525 2 102 1,569 2 374 6,026 12 405 4,937 7 209 3,190 4<br />
Railroads 119 1,967 4 201 1,508 4 274 8,449 4 58 156 1 130 2,416 3<br />
Children 62 96 2 64 11 1 106 561 2 28 62 1 48 495 1 62 245 1<br />
Miscellaneous 860 10,462 27 1,814 7,811 38 2,721 29,714 42 1,200 15,954 39 2,469 52,802 41 1,813 23,349 39<br />
No. No. Acres<br />
% No. No. Acres<br />
% No. No. Acres<br />
% No. No. Acres<br />
% No. No. Acres<br />
% No. No. Acres<br />
<strong>Fire</strong>s Burned <strong>Fire</strong>s Burned <strong>Fire</strong>s Burned <strong>Fire</strong>s Burned <strong>Fire</strong>s Burned <strong>Fire</strong>s Burned<br />
%<br />
Class A 861 447 27 1,434 263 30 1,342 492 21 1,325 377 43 2,443 353 41 1,481 386 31<br />
Class B 1,522 2,141 47 1,556 2,164 33 2,996 3,427 47 1,195 2,833 39 1,550 4,427 26 1,764 2,998 37<br />
Class C 726 10,515 22 1,481 12,984 31 1,878 23,749 29 497 13,642 16 867 23,917 14 1,090 16,961 23<br />
Class D 94 7,038 3 189 6,608 4 158 16,844 2 68 10,320 2 108 15,680 2 123 11,298 3<br />
Class E 30 8,055 1 70 8,180 1 56 20,042 1 15 6,420 0 40 18,240 1 42 12,187 1<br />
Class F 5 3,480 0 2 5,500 0 9 18,690 0 1 1,500 0 9 18,400 0 5 9,514 0<br />
Class G 1 12,000 0 0 2,400 0<br />
178
Montana<br />
1998 1999 2000<br />
2001 2002<br />
5-year Average<br />
No. No. Acres No. No. Acres No. No. Acres No. No. Acres No. No. Acres No. No. Acres<br />
<strong>Fire</strong>s Burned <strong>Fire</strong>s Burned <strong>Fire</strong>s Burned <strong>Fire</strong>s Burned <strong>Fire</strong>s Burned <strong>Fire</strong>s Burned<br />
527 37,866 467 87,356 543 168,744 334 36,986 471 28,811 468 71,953<br />
No. No. Acres<br />
% No. No. Acres<br />
% No. No. Acres<br />
% No. No. Acres<br />
% No. No. Acres<br />
% No. No. Acres<br />
<strong>Fire</strong>s Burned <strong>Fire</strong>s Burned <strong>Fire</strong>s Burned <strong>Fire</strong>s Burned <strong>Fire</strong>s Burned <strong>Fire</strong>s Burned<br />
%<br />
Lightn<strong>in</strong>g 268 26,545 51 249 43,660 53 310 37,230 57 118 34,297 35 186 19,172 39 226 32,181 48<br />
Camper 60 1,467 11 55 156 12 40 7 7 45 12 13 68 94 14 54 347 11<br />
Smoker 12 4 2 8 175 2 4 3,062 1 8 1 2 12 2 3 9 649 2<br />
Debris Burn<strong>in</strong>g 79 692 15 46 2,212 10 50 640 9 64 1,797 19 91 1,115 19 66 1,291 14<br />
Arson 8 6 2 3 202 1 8 42 1 6 56 2 11 36 2 7 68 2<br />
Equipment 23 580 4 21 7,751 4 16 81,618 3 9 422 3 8 4 2 15 18,075 3<br />
Railroads 23 205 4 16 10,958 3 17 9 3 9 32 3 7 2 1 14 2,241 3<br />
Children 4 1 1 14 308 3 13 90 2 8 1 2 9 1 2 10 80 2<br />
Miscellaneous 50 8,366 9 55 21,934 12 85 46,046 16 67 368 20 79 8,385 17 67 17,020 14<br />
No. No. Acres<br />
% No. No. Acres<br />
% No. No. Acres<br />
% No. No. Acres<br />
% No. No. Acres<br />
% No. No. Acres<br />
<strong>Fire</strong>s Burned <strong>Fire</strong>s Burned <strong>Fire</strong>s Burned <strong>Fire</strong>s Burned <strong>Fire</strong>s Burned <strong>Fire</strong>s Burned<br />
%<br />
Class A 350 26 66 306 25 66 342 22 63 231 23 69 343 26 73 314 24 67<br />
Class B 140 242 27 110 251 24 128 281 24 80 170 24 97 169 21 111 223 24<br />
Class C 13 378 2 21 646 4 38 1,483 7 12 358 4 20 571 4 21 687 4<br />
Class D 12 1,881 2 9 1,544 2 8 1,366 1 3 455 1 2 214 0 7 1,092 1<br />
Class E 6 3,700 1 7 4,125 1 11 6,038 2 5 3,002 1 3 1,159 1 6 3,605 1<br />
Class F 3 3,545 1 9 24,137 2 10 21,550 2 2 6,478 1 3 8,277 1 5 12,797 1<br />
Class G 3 28,094 1 5 56,628 1 6 138,004 1 1 26,500 0 3 18,395 1 4 53,524 1<br />
179
Nebraska<br />
1998 1999 2000<br />
2001 2002<br />
5-year Average<br />
No. No. Acres No. No. Acres No. No. Acres No. No. Acres No. No. Acres No. No. Acres<br />
<strong>Fire</strong>s Burned <strong>Fire</strong>s Burned <strong>Fire</strong>s Burned <strong>Fire</strong>s Burned <strong>Fire</strong>s Burned <strong>Fire</strong>s Burned<br />
793 34,362 1,350 177,024 1,982 252,249 620 17,230 1,835 90,562 1,316 114,549<br />
No. No. Acres<br />
% No. No. Acres<br />
% No. No. Acres<br />
% No. No. Acres<br />
% No. No. Acres<br />
% No. No. Acres<br />
<strong>Fire</strong>s Burned <strong>Fire</strong>s Burned <strong>Fire</strong>s Burned <strong>Fire</strong>s Burned <strong>Fire</strong>s Burned <strong>Fire</strong>s Burned<br />
%<br />
Lightn<strong>in</strong>g 106 11,413 13 78 4,060 6 265 173,466 13 91 13,080 15 249 34,789 14 158 47,362 12<br />
Camper 2 1 0 8 18 1 8 10 0 2 2 0 11 95 1 6 25 0<br />
Smoker 48 246 6 76 9,138 6 101 1,180 5 25 94 4 80 858 4 66 2,303 5<br />
Debris Burn<strong>in</strong>g 164 7,241 21 356 5,114 26 553 35,245 28 135 1,001 22 500 5,614 27 342 10,843 26<br />
Arson 18 64 2 39 551 3 81 8,428 4 10 114 2 64 1,058 3 42 2,043 3<br />
Equipment 115 5,659 15 229 14,704 17 282 8,507 14 97 683 16 255 31,966 14 196 12,304 15<br />
Railroads 88 1,047 11 108 36,234 8 135 7,683 7 49 395 8 103 641 6 97 9,200 7<br />
Children 6 5 1 13 6 1 9 7 0 4 2 1 20 11 1 10 6 1<br />
Miscellaneous 246 8,686 31 443 107,199 33 548 17,723 28 207 1,859 33 553 15,530 30 399 30,199 30<br />
No. No. Acres<br />
% No. No. Acres<br />
% No. No. Acres<br />
% No. No. Acres<br />
% No. No. Acres<br />
% No. No. Acres<br />
<strong>Fire</strong>s Burned <strong>Fire</strong>s Burned <strong>Fire</strong>s Burned <strong>Fire</strong>s Burned <strong>Fire</strong>s Burned <strong>Fire</strong>s Burned<br />
%<br />
Class A 254 32 32 394 49 29 557 67 28 165 18 27 467 58 25 367 45 28<br />
Class B 357 779 45 665 1,391 49 962 2,061 49 339 597 55 937 1,907 51 652 1,347 50<br />
Class C 133 4,232 17 215 5,737 16 340 10,467 17 102 3,145 16 350 10,503 19 228 6,817 17<br />
Class D 28 4,220 4 37 5,785 3 61 9,308 3 8 1,310 1 48 7,752 3 36 5,675 3<br />
Class E 14 8,699 2 20 10,522 1 33 17,047 2 4 2,160 1 20 8,920 1 18 9,470 1<br />
Class F 7 16,400 1 11 17,620 1 18 43,299 1 1 3,000 0 10 22,422 1 9 20,548 1<br />
Class G 8 135,920 1 11 170,000 1 1 7,000 0 3 39,000 0 5 70,384 0<br />
180
Nevada<br />
1998 1999 2000<br />
2001 2002<br />
5-year Average<br />
No. No. Acres No. No. Acres No. No. Acres No. No. Acres No. No. Acres No. No. Acres<br />
<strong>Fire</strong>s Burned <strong>Fire</strong>s Burned <strong>Fire</strong>s Burned <strong>Fire</strong>s Burned <strong>Fire</strong>s Burned <strong>Fire</strong>s Burned<br />
141 1,989 233 2,162 319 87,315 182 22,069 269 2,833 229 23,274<br />
No. No. Acres<br />
% No. No. Acres<br />
% No. No. Acres<br />
% No. No. Acres<br />
% No. No. Acres<br />
% No. No. Acres<br />
<strong>Fire</strong>s Burned <strong>Fire</strong>s Burned <strong>Fire</strong>s Burned <strong>Fire</strong>s Burned <strong>Fire</strong>s Burned <strong>Fire</strong>s Burned<br />
%<br />
Lightn<strong>in</strong>g 25 110 18 36 166 15 67 68,630 21 30 21,294 16 37 2,487 14 39 18,537 17<br />
Camper 10 5 7 18 2 8 31 13 10 30 13 16 5 12 2 19 9 8<br />
Smoker 4 1 2 1 2 1 3 4 1 2 1 1<br />
Debris Burn<strong>in</strong>g 52 6 37 105 71 45 86 75 27 41 16 23 57 156 21 68 65 30<br />
Arson 16 113 5 3 3 2 4 23 2<br />
Equipment 4 2 3 11 105 5 30 15,971 9 17 351 9 8 26 3 14 3,291 6<br />
Railroads 13 5 9 19 15 8 2 2 1 12 82 7 4 9 1 10 23 4<br />
Children 5 34 4 8 2 3 8 51 3 7 17 4 2 17 1 6 24 3<br />
Miscellaneous 32 1,827 23 32 1,800 14 79 2,460 25 41 291 23 153 122 57 67 1,300 29<br />
No. No. Acres<br />
% No. No. Acres<br />
% No. No. Acres<br />
% No. No. Acres<br />
% No. No. Acres<br />
% No. No. Acres<br />
<strong>Fire</strong>s Burned <strong>Fire</strong>s Burned <strong>Fire</strong>s Burned <strong>Fire</strong>s Burned <strong>Fire</strong>s Burned <strong>Fire</strong>s Burned<br />
%<br />
Class A 116 13 82 184 22 79 209 23 66 109 12 60 117 10 43 147 16 64<br />
Class B 16 37 11 36 66 15 72 157 23 48 70 26 113 45 42 57 75 25<br />
Class C 8 157 6 11 292 5 21 504 7 16 350 9 24 93 9 16 279 7<br />
Class D 1 0 6 1,277 2 3 462 2 12 398 4 4 427 2<br />
Class E 2 1,250 1 1 69 1 2 333 1 1 330 0<br />
Class F 1 1,782 1 1 1,782 0 5 5,601 2 3 4,391 2 1 1,954 0 2 3,102 1<br />
Class G 4 78,503 1 2 16,715 1 1 19,044 1<br />
181
New Mexico<br />
1998 1999 2000<br />
2001 2002<br />
5-year Average<br />
No. No. Acres No. No. Acres No. No. Acres No. No. Acres No. No. Acres No. No. Acres<br />
<strong>Fire</strong>s Burned <strong>Fire</strong>s Burned <strong>Fire</strong>s Burned <strong>Fire</strong>s Burned <strong>Fire</strong>s Burned <strong>Fire</strong>s Burned<br />
1,117 123,748 469 52,446 1,134 376,475 476 39,849 794 226,492 798 163,802<br />
No. No. Acres<br />
% No. No. Acres<br />
% No. No. Acres<br />
% No. No. Acres<br />
% No. No. Acres<br />
% No. No. Acres<br />
<strong>Fire</strong>s Burned <strong>Fire</strong>s Burned <strong>Fire</strong>s Burned <strong>Fire</strong>s Burned <strong>Fire</strong>s Burned <strong>Fire</strong>s Burned<br />
%<br />
Lightn<strong>in</strong>g 341 51,366 31 88 12,576 19 442 76,320 39 222 26,761 47 324 179,921 41 283 69,389 36<br />
Camper 7 37 1 10 10 2 12 1,030 1 7 6 1 16 5,622 2 10 1,341 1<br />
Smoker 36 1,133 3 40 2,112 9 55 14,066 5 14 275 3 29 396 4 35 3,596 4<br />
Debris Burn<strong>in</strong>g 173 11,766 15 90 12,047 19 165 12,940 15 47 381 10 141 1,611 18 123 7,749 15<br />
Arson 47 1,484 4 8 142 2 30 9,424 3 12 49 3 24 942 3 24 2,408 3<br />
Equipment 85 10,283 8 51 5,069 11 63 15,955 6 29 179 6 49 2,025 6 55 6,702 7<br />
Railroads 8 90 1 14 3,980 3 36 56,361 3 9 27 2 17 41 2 17 12,100 2<br />
Children 27 58 2 8 419 2 15 339 1 5 2 1 7 850 1 12 334 2<br />
Miscellaneous 393 47,531 35 160 16,091 34 316 190,040 28 131 12,169 28 187 35,084 24 237 60,183 30<br />
No. No. Acres<br />
% No. No. Acres<br />
% No. No. Acres<br />
% No. No. Acres<br />
% No. No. Acres<br />
% No. No. Acres<br />
<strong>Fire</strong>s Burned <strong>Fire</strong>s Burned <strong>Fire</strong>s Burned <strong>Fire</strong>s Burned <strong>Fire</strong>s Burned <strong>Fire</strong>s Burned<br />
%<br />
Class A 253 39 23 146 26 31 315 1,456 28 189 30 40 348 92 44 250 329 31<br />
Class B 478 1,188 43 193 501 41 449 1,083 40 184 374 39 315 736 40 324 776 41<br />
Class C 248 7,997 22 77 1,927 16 212 6,397 19 78 2,256 16 76 3,711 10 138 4,458 17<br />
Class D 58 9,376 5 21 3,115 4 65 10,485 6 9 1,522 2 18 4,415 2 34 5,783 4<br />
Class E 49 23,340 4 18 9,510 4 51 25,273 4 7 3,116 1 17 8,191 2 28 13,886 4<br />
Class F 29 60,808 3 11 23,867 2 27 57,656 2 7 14,301 1 11 81,842 1 17 47,695 2<br />
Class G 2 21,000 0 3 13,500 1 15 274,125 1 2 18,250 0 9 177,505 1 6 100,876 1<br />
182
North Dakota<br />
1998 1999 2000<br />
2001 2002<br />
5-year Average<br />
No. No. Acres No. No. Acres No. No. Acres No. No. Acres No. No. Acres No. No. Acres<br />
<strong>Fire</strong>s Burned <strong>Fire</strong>s Burned <strong>Fire</strong>s Burned <strong>Fire</strong>s Burned <strong>Fire</strong>s Burned <strong>Fire</strong>s Burned<br />
397 7,201 561 83,640 612 64,113 219 6,504 325 29,565 423 38,205<br />
No. No. Acres<br />
% No. No. Acres<br />
% No. No. Acres<br />
% No. No. Acres<br />
% No. No. Acres<br />
% No. No. Acres<br />
<strong>Fire</strong>s Burned <strong>Fire</strong>s Burned <strong>Fire</strong>s Burned <strong>Fire</strong>s Burned <strong>Fire</strong>s Burned <strong>Fire</strong>s Burned<br />
%<br />
Lightn<strong>in</strong>g 52 428 13 22 544 4 73 19,174 12 7 55 3 77 11,779 24 46 6,396 11<br />
Camper 3 91 1 9 20 2 10 167 2 4 56 1<br />
Smoker 8 24 2 17 363 3 14 89 2 4 86 2 4 38 1 9 120 2<br />
Debris Burn<strong>in</strong>g 156 2,920 39 290 66,839 52 246 13,481 40 129 3,510 59 63 3,284 19 177 18,007 42<br />
Arson 14 4 4 21 321 4 8 222 1 1 25 0 9 114 2<br />
Equipment 29 2,354 7 90 13,780 16 100 8,339 16 18 1,341 8 50 2,724 15 57 5,708 14<br />
Railroads 29 762 7 25 186 4 21 354 3 4 23 2 10 108 3 18 287 4<br />
Children 16 18 4 11 28 2 10 24 2 3 23 1 3 99 1 9 38 2<br />
Miscellaneous 90 600 23 76 1,559 14 130 22,263 21 54 1,466 25 117 11,508 36 93 7,479 22<br />
17<br />
No. No. Acres<br />
% No. No. Acres<br />
% No. No. Acres<br />
% No. No. Acres<br />
% No. No. Acres<br />
% No. No. Acres<br />
<strong>Fire</strong>s Burned <strong>Fire</strong>s Burned <strong>Fire</strong>s Burned <strong>Fire</strong>s Burned <strong>Fire</strong>s Burned <strong>Fire</strong>s Burned<br />
%<br />
Class A 184 46 46 158 38 28 126 30 21 58 7 26 99 20 30 125 28 30<br />
Class B 128 270 32 252 602 45 246 614 40 87 215 40 104 263 32 163 393 39<br />
Class C 76 2,415 19 118 3,205 21 177 5,269 29 59 1,690 27 80 2,179 25 102 2,952 24<br />
Class D 5 620 1 22 2,975 4 30 4,940 5 10 1,300 5 23 3,253 7 18 2,618 4<br />
Class E 2 1,150 1 7 3,320 1 21 10,340 3 4 2,292 2 13 5,800 4 9 4,580 2<br />
Class F 2 2,700 1 2 4,500 0 9 22,420 1 1 1,000 0 4 7,300 1 4 7,584 1<br />
Class G 2 69,000 0 3 20,500 0 2 10,750 1 1 20,050 0<br />
183
Oregon<br />
1998 1999 2000<br />
2001 2002<br />
5-year Average<br />
No. No. Acres No. No. Acres No. No. Acres No. No. Acres No. No. Acres No. No. Acres<br />
<strong>Fire</strong>s Burned <strong>Fire</strong>s Burned <strong>Fire</strong>s Burned <strong>Fire</strong>s Burned <strong>Fire</strong>s Burned <strong>Fire</strong>s Burned<br />
938 2,680 1,145 9,605 894 13,247 1,241 51,268 1,175 99,047 1,079 35,169<br />
No. No. Acres<br />
% No. No. Acres<br />
% No. No. Acres<br />
% No. No. Acres<br />
% No. No. Acres<br />
% No. No. Acres<br />
<strong>Fire</strong>s Burned <strong>Fire</strong>s Burned <strong>Fire</strong>s Burned <strong>Fire</strong>s Burned <strong>Fire</strong>s Burned <strong>Fire</strong>s Burned<br />
%<br />
Lightn<strong>in</strong>g 305 359 33 338 1,892 30 157 3,319 18 485 46,976 39 308 92,395 26 355 29,016 33<br />
Camper 80 395 9 138 1,609 12 91 69 10 107 149 9 125 596 11 137 570 13<br />
Smoker 57 33 6 82 199 7 71 16 8 65 58 5 82 60 7 144 3,236 13<br />
Debris Burn<strong>in</strong>g 181 582 19 209 3,086 18 182 7,906 20 179 1,061 14 217 2,048 18 214 2,955 20<br />
Arson 35 34 4 25 543 2 52 46 6 47 167 4 34 86 3 109 309 10<br />
Equipment 127 388 14 184 1,818 16 177 334 20 170 2,529 14 219 2,487 19 179 1,708 17<br />
Railroads 14 128 1 8 88 1 10 492 1 15 15 1 9 1 1 33 161 3<br />
Children 32 8 3 59 242 5 55 41 6 65 118 5 40 86 3 90 109 8<br />
Miscellaneous 107 753 11 102 128 9 99 24 11 108 195 9 141 1,288 12 469 5,376 43<br />
No. No. Acres<br />
% No. No. Acres<br />
% No. No. Acres<br />
% No. No. Acres<br />
% No. No. Acres<br />
% No. No. Acres<br />
<strong>Fire</strong>s Burned <strong>Fire</strong>s Burned <strong>Fire</strong>s Burned <strong>Fire</strong>s Burned <strong>Fire</strong>s Burned <strong>Fire</strong>s Burned<br />
%<br />
Class A 632 32 67 787 58 69 667 48 75 927 77 75 814 65 69 846 214 78<br />
Class B 268 379 29 305 532 27 202 394 23 253 632 20 272 521 23 265 645 25<br />
Class C 28 929 3 37 1,173 3 13 384 1 45 1,535 4 53 1,757 5 37 1,353 3<br />
Class D 8 1,212 1 7 1,300 1 5 494 1 10 1,502 1 13 1,644 1 10 1,650 1<br />
Class E 1 48 0 6 2,746 1 4 1,050 0 2 753 0 5 2,692 0 4 1,976 0<br />
Class F 1 80 0 3 3,796 0 1 1,296 0 1 1,323 0 6 7,178 1 3 6,567 0<br />
Class G 2 9,581 0 3 45,446 0 12 85,190 1 361 33,342 33<br />
184
South Dakota<br />
1998 1999 2000<br />
2001 2002<br />
5-year Average<br />
No. No. Acres No. No. Acres No. No. Acres No. No. Acres No. No. Acres No. No. Acres<br />
<strong>Fire</strong>s Burned <strong>Fire</strong>s Burned <strong>Fire</strong>s Burned <strong>Fire</strong>s Burned <strong>Fire</strong>s Burned <strong>Fire</strong>s Burned<br />
164 4,604 742 71,989 1,173 404,130 564 55,976 725 166,928 674 140,725<br />
No. No. Acres<br />
% No. No. Acres<br />
% No. No. Acres<br />
% No. No. Acres<br />
% No. No. Acres<br />
% No. No. Acres<br />
<strong>Fire</strong>s Burned <strong>Fire</strong>s Burned <strong>Fire</strong>s Burned <strong>Fire</strong>s Burned <strong>Fire</strong>s Burned <strong>Fire</strong>s Burned<br />
%<br />
Lightn<strong>in</strong>g 46 638 28 66 4,852 9 336 192,012 29 156 18,141 28 215 82,113 30 164 59,551 24<br />
Camper 16 20 10 2 0 130 4,390 11 41 457 7 4 1 1 39 974 6<br />
Smoker 3 1 2 18 94 2 20 1,645 2 11 143 2 11 9 2 13 378 2<br />
Debris Burn<strong>in</strong>g 24 172 15 270 10,283 36 233 32,210 20 74 1,816 13 190 4,691 26 158 9,834 23<br />
Arson 6 19 1 1 83,500 0 1 0 2 16,704 0<br />
Equipment 22 3,542 13 157 13,185 21 152 44,677 13 115 15,908 20 106 34,749 15 110 22,412 16<br />
Railroads 1 10 1 11 442 1 22 1,910 2 3 2,601 1 3 120 0 8 1,017 1<br />
Children 14 46 9 41 251 6 37 85 3 28 105 5 28 4,398 4 30 977 4<br />
Miscellaneous 38 175 23 171 42,863 23 242 43,701 21 136 16,805 24 167 40,847 23 151 28,878 22<br />
No. No. Acres<br />
% No. No. Acres<br />
% No. No. Acres<br />
% No. No. Acres<br />
% No. No. Acres<br />
% No. No. Acres<br />
<strong>Fire</strong>s Burned <strong>Fire</strong>s Burned <strong>Fire</strong>s Burned <strong>Fire</strong>s Burned <strong>Fire</strong>s Burned <strong>Fire</strong>s Burned<br />
%<br />
Class A 75 11 46 194 26 26 182 20 16 141 38 25 151 24 21 149 24 22<br />
Class B 52 101 32 332 721 45 569 1,281 49 272 601 48 333 7,781 46 312 2,097 46<br />
Class C 33 682 20 165 5,047 22 278 8,672 24 105 3,237 19 172 5,083 24 151 4,544 22<br />
Class D 2 260 1 26 4,034 4 58 9,595 5 20 3,180 4 30 4,637 4 27 4,341 4<br />
Class E 1 450 1 10 4,744 1 41 19,035 3 15 6,970 3 14 10,132 2 16 8,266 2<br />
Class F 1 3,100 1 11 20,917 1 25 47,472 2 9 17,450 2 20 45,600 3 13 26,908 2<br />
Class G 4 36,500 1 20 318,055 2 2 24,500 0 5 93,671 1 6 94,545 1<br />
185
Utah<br />
`<br />
1998 1999 2000<br />
2001 2002<br />
5-year Average<br />
No. No. Acres No. No. Acres No. No. Acres No. No. Acres No. No. Acres No. No. Acres<br />
<strong>Fire</strong>s Burned <strong>Fire</strong>s Burned <strong>Fire</strong>s Burned <strong>Fire</strong>s Burned <strong>Fire</strong>s Burned <strong>Fire</strong>s Burned<br />
495 24,603 735 133,353 855 52,257 834 61,756 613 68,534 706 68,101<br />
No. No. Acres<br />
% No. No. Acres<br />
% No. No. Acres<br />
% No. No. Acres<br />
% No. No. Acres<br />
% No. No. Acres<br />
<strong>Fire</strong>s Burned <strong>Fire</strong>s Burned <strong>Fire</strong>s Burned <strong>Fire</strong>s Burned <strong>Fire</strong>s Burned <strong>Fire</strong>s Burned<br />
%<br />
Lightn<strong>in</strong>g 244 15,069 49 289 24,436 39 569 41,848 67 540 53,386 65 325 53,158 53 393 37,579 56<br />
Camper 21 2 4 36 2,930 5 34 67 4 28 12 3 38 3,596 6 31 1,321 4<br />
Smoker 12 69 2 19 167 3 14 7 2 9 2 1 10 45 2 13 58 2<br />
Debris Burn<strong>in</strong>g 47 758 9 103 5,324 14 42 479 5 54 98 6 54 505 9 60 1,433 8<br />
Arson 29 64 6 61 16,213 8 50 3,953 6 40 4,065 5 34 638 6 43 4,987 6<br />
Equipment 37 1,915 7 62 3,792 8 53 454 6 43 1,940 5 44 5,999 7 48 2,820 7<br />
Railroads 12 568 2 31 61,138 4 20 2,038 2 11 88 1 11 1,263 2 17 13,019 2<br />
Children 11 11 2 8 215 1 9 9 1 10 7 1 4 16 1 8 52 1<br />
Miscellaneous 82 6,147 11 126 19,138 21 64 3,402 ### 99 2,158 ### 93 3,314 ### 93 6,832 13<br />
No. No. Acres<br />
% No. No. Acres<br />
% No. No. Acres<br />
% No. No. Acres<br />
% No. No. Acres<br />
% No. No. Acres<br />
<strong>Fire</strong>s Burned <strong>Fire</strong>s Burned <strong>Fire</strong>s Burned <strong>Fire</strong>s Burned <strong>Fire</strong>s Burned <strong>Fire</strong>s Burned<br />
%<br />
Class A 251 22 51 305 44 41 498 136 58 515 45 62 385 29 ### 391 55 55<br />
Class B 153 192 31 288 740 39 256 2,312 30 223 380 27 160 262 ### 216 777 31<br />
Class C 54 1,207 11 81 3,266 11 52 1,403 6 53 1,181 6 30 825 ### 54 1,576 8<br />
Class D 12 1,765 2 17 3,266 2 16 1,498 2 18 1,375 2 7 765 ### 14 1,734 2<br />
Class E 11 1,574 2 25 14,771 3 10 2,588 1 9 2,651 1 8 2,879 ### 13 4,893 2<br />
Class F 9 6,117 2 16 36,729 2 18 25,383 2 13 17,246 2 13 7,914 ### 14 18,678 2<br />
Class G 5 13,726 1 3 74,537 0 5 18,937 1 3 38,878 0 10 55,890 ### 5 40,394 1<br />
186
Wash<strong>in</strong>gton<br />
1998 1999 2000<br />
2001 2002<br />
5-year Average<br />
No. No. Acres No. No. Acres No. No. Acres No. No. Acres No. No. Acres No. No. Acres<br />
<strong>Fire</strong>s Burned <strong>Fire</strong>s Burned <strong>Fire</strong>s Burned <strong>Fire</strong>s Burned <strong>Fire</strong>s Burned <strong>Fire</strong>s Burned<br />
992 23,511 1,002 6,796 780 18,027 809 17,700 889 10,063 894 15,219<br />
No. No. Acres<br />
% No. No. Acres<br />
% No. No. Acres<br />
% No. No. Acres<br />
% No. No. Acres<br />
% No. No. Acres<br />
<strong>Fire</strong>s Burned <strong>Fire</strong>s Burned <strong>Fire</strong>s Burned <strong>Fire</strong>s Burned <strong>Fire</strong>s Burned <strong>Fire</strong>s Burned<br />
%<br />
Lightn<strong>in</strong>g 194 19,189 20 120 529 12 81 13,946 10 140 9,542 17 134 462 15 134 8,734 15<br />
Camper 107 24 11 188 431 19 123 947 16 132 193 16 130 204 15 136 360 15<br />
Smoker 41 35 4 40 17 4 28 20 4 27 9 3 31 19 3 33 20 4<br />
Debris Burn<strong>in</strong>g 214 545 22 272 1,175 28 190 611 24 173 888 21 197 3,059 22 209 1,256 23<br />
Arson 48 951 5 35 967 4 40 1,069 5 24 27 3 34 105 4 36 624 4<br />
Equipment 62 295 6 32 166 3 13 47 2 5 17 1 27 19 3 28 109 3<br />
Railroads 14 124 1 13 30 1 9 44 1 20 34 2 13 18 1 14 50 2<br />
Children 45 87 5 47 124 5 28 95 4 26 13 3 43 30 5 38 70 4<br />
Miscellaneous 267 2,261 27 225 3,357 23 268 1,248 34 262 6,977 32 280 6,147 31 260 3,998 29<br />
No. No. Acres<br />
% No. No. Acres<br />
% No. No. Acres<br />
% No. No. Acres<br />
% No. No. Acres<br />
% No. No. Acres<br />
<strong>Fire</strong>s Burned <strong>Fire</strong>s Burned <strong>Fire</strong>s Burned <strong>Fire</strong>s Burned <strong>Fire</strong>s Burned <strong>Fire</strong>s Burned<br />
%<br />
Class A 695 73 70 643 67 64 472 56 61 513 54 63 550 800 62 575 210 64<br />
Class B 255 458 26 308 594 31 263 493 34 249 492 31 287 526 32 272 513 30<br />
Class C 31 1,000 3 41 1,164 4 35 1,245 4 34 976 4 39 1,013 4 36 1,080 4<br />
Class D 6 802 1 7 1,192 1 5 930 1 6 1,056 1 8 411 1 6 878 1<br />
Class E 3 1,582 0 2 1,169 0 3 2,137 0 4 2,005 0 2 942 0 3 1,567 0<br />
Class F 1 1,162 0 1 2,610 0 2 7,142 0 3 6,371 0 1 3,457 0<br />
Class G 1 18,434 0 2 13,166 0 1 5,785 0 1 7,477 0<br />
187
Wyom<strong>in</strong>g<br />
1998 1999 2000<br />
2001 2002<br />
5-year Average<br />
No. No. Acres No. No. Acres No. No. Acres No. No. Acres No. No. Acres No. No. Acres<br />
<strong>Fire</strong>s Burned <strong>Fire</strong>s Burned <strong>Fire</strong>s Burned <strong>Fire</strong>s Burned <strong>Fire</strong>s Burned <strong>Fire</strong>s Burned<br />
558 22,942 732 84,300 909 358,698 219 18,414 815 163,226 647 129,516<br />
No. No. Acres<br />
% No. No. Acres<br />
% No. No. Acres<br />
% No. No. Acres<br />
% No. No. Acres<br />
% No. No. Acres<br />
<strong>Fire</strong>s Burned <strong>Fire</strong>s Burned <strong>Fire</strong>s Burned <strong>Fire</strong>s Burned <strong>Fire</strong>s Burned <strong>Fire</strong>s Burned<br />
%<br />
Lightn<strong>in</strong>g 185 20,717 25 112 4,317 15 348 296,528 38 72 11,815 33 244 69,227 30 192 80,521 30<br />
Camper 7 218 1 8 5 1 12 91 5 42 321 5 14 127 2<br />
Smoker 10 3 1 26 86 4 15 86 2 4 4 2 50 204 6 21 77 3<br />
Debris Burn<strong>in</strong>g 80 160 11 125 1,820 17 130 2,915 14 21 938 10 84 453 10 88 1,257 14<br />
Arson 29 46 4 33 52 5 70 91 8 10 78 5 101 90,163 12 49 18,086 8<br />
Equipment 10 30 1 40 17,078 5 27 660 3 32 58 15 132 1,086 16 48 3,782 7<br />
Railroads 70 163 10 156 18,415 21 96 445 11 19 121 9 45 130 6 77 3,855 12<br />
Children 11 13 2 16 10 2 11 25 1 11 50 5 10 20 2<br />
Miscellaneous 163 1,810 22 217 42,304 30 204 57,943 22 38 5,259 17 117 1,642 14 148 21,792 23<br />
No. No. Acres<br />
% No. No. Acres<br />
% No. No. Acres<br />
% No. No. Acres<br />
% No. No. Acres<br />
% No. No. Acres<br />
<strong>Fire</strong>s Burned <strong>Fire</strong>s Burned <strong>Fire</strong>s Burned <strong>Fire</strong>s Burned <strong>Fire</strong>s Burned <strong>Fire</strong>s Burned<br />
%<br />
Class A 342 93 47 320 87 44 340 1,413 37 68 7 31 282 31 35 270 326 42<br />
Class B 153 353 21 295 656 40 361 959 40 119 205 54 421 730 52 270 581 42<br />
Class C 46 1,317 6 84 3,356 11 119 3,343 13 19 659 9 73 2,307 9 68 2,196 11<br />
Class D 8 1,391 1 17 2,976 2 34 5,923 4 3 316 1 13 1,738 2 15 2,469 2<br />
Class E 7 17,738 1 8 4,024 1 32 14,352 4 4 200 2 10 4,889 1 12 8,241 2<br />
Class F 1 1,300 0 3 5,001 0 11 71,978 1 5 10,020 2 5 9,234 1 5 19,507 1<br />
Class G 1 750 0 5 68,200 1 12 260,730 1 1 5,207 0 11 144,297 1 6 95,837 1<br />
188
Appendix<br />
189
Wildland/Urban Interface<br />
The Wildland/Urban Interface fire problem has existed for hundreds of years. As early as<br />
1793, <strong>the</strong> Governor of Upper and Lower California “prohibited all k<strong>in</strong>ds of burn<strong>in</strong>g, not only <strong>in</strong> <strong>the</strong><br />
vic<strong>in</strong>ity of <strong>the</strong> towns....which cause some detriment....” In <strong>the</strong> last 50 years <strong>the</strong> problem has grown<br />
more complex as more development has occurred. This section of <strong>Fire</strong> <strong>in</strong> <strong>the</strong> <strong>West</strong> focuses on <strong>the</strong><br />
common elements of <strong>the</strong> Wildland/Urban Interface problem, and seeks to better def<strong>in</strong>e <strong>the</strong><br />
condition(s) <strong>in</strong> <strong>the</strong> <strong>West</strong>.<br />
Def<strong>in</strong>itions:<br />
Life and Property <strong>Fire</strong> Protection – a service with <strong>the</strong> primary responsibility to protect<br />
structures AND <strong>the</strong> people who occupy <strong>the</strong>se structures from <strong>in</strong>jury or death. This fire<br />
protection service is normally provided by rural and/or local government fire departments,<br />
with specially tra<strong>in</strong>ed and equipped personnel. After life safety, <strong>the</strong> priority is to<br />
keep <strong>the</strong> fire from leav<strong>in</strong>g <strong>the</strong> area of orig<strong>in</strong>. It also means protect<strong>in</strong>g <strong>the</strong> structure from<br />
an advanc<strong>in</strong>g wildland fire. Local taxpayers fund this service through a variety of tax<strong>in</strong>g<br />
authorities. (The equipment and tra<strong>in</strong><strong>in</strong>g required to conduct life and property protection<br />
are not normally provided to <strong>the</strong> wildland firefighter.)<br />
Structure Protection – to protect structures from <strong>the</strong> threat of damage from an advanc<strong>in</strong>g<br />
wildland fire. This normally does not <strong>in</strong>clude an attack on fire that is <strong>in</strong>side <strong>the</strong> structure.<br />
It <strong>in</strong>volves <strong>the</strong> use of fire control l<strong>in</strong>es (constructed or natural) and <strong>the</strong> ext<strong>in</strong>guishment of<br />
spot fires near or on <strong>the</strong> structure. This protection can be provided by both <strong>the</strong> rural and/<br />
or local government fire department firefighter and <strong>the</strong> wildland fire protection firefighter.<br />
Structural <strong>Fire</strong> Protection – is def<strong>in</strong>ed as <strong>in</strong>terior and exterior actions take to suppress and<br />
ext<strong>in</strong>guish a burn<strong>in</strong>g structure or improvement associated with standard structure fire<br />
protection, equipment and tra<strong>in</strong><strong>in</strong>g. Structural fire suppression is <strong>the</strong> responsibility of<br />
local government entities, although <strong>the</strong>re are some locations <strong>in</strong> <strong>the</strong> <strong>West</strong> where <strong>the</strong>re is<br />
currently no structural fire agency <strong>in</strong> place.<br />
190
Wildland <strong>Fire</strong> Protection – a service with <strong>the</strong> primary responsibility of protect<strong>in</strong>g natural<br />
resources and watersheds from damage by wildfires. State and federal forestry or land<br />
management agencies normally provide wildland fire protection with specially tra<strong>in</strong>ed<br />
and equipped personnel. Various tax<strong>in</strong>g authorities and fees fund this service. Some<br />
wildland fire protection agencies have <strong>the</strong> responsibilities for <strong>in</strong>term<strong>in</strong>gled life and property<br />
protection when <strong>the</strong>y are threatened by a wildland fire...and some do not. It is nearly<br />
impossible for an <strong>in</strong>cident commander to separate <strong>the</strong>se responsibilities (and <strong>the</strong> associated<br />
costs) dur<strong>in</strong>g a wildland fire. (The equipment and tra<strong>in</strong><strong>in</strong>g required to conduct<br />
wildland fire protection are not normally provided to <strong>the</strong> local government fire department<br />
firefighter. If a fire protection agency is rout<strong>in</strong>ely called upon to fight wildland fires,<br />
<strong>the</strong>y are usually tra<strong>in</strong>ed and equipped to do so. The problem arises when personnel from<br />
an agency are called upon to fight fires for which <strong>the</strong>y are NOT properly equipped or<br />
tra<strong>in</strong>ed.)<br />
Wildland/Urban Interface – <strong>in</strong> relation to wildland/urban fire, a set of conditions that<br />
provides <strong>the</strong> opportunity for fire to burn from wildland vegetation to <strong>the</strong> home/structure<br />
ignition zone. There are four different wildland/urban conditions:<br />
Interface Condition – is a situation where structures abut wildland fuels. There is a clear l<strong>in</strong>e of<br />
demarcation between <strong>the</strong> structures and <strong>the</strong> wildland fuels along roads or back fences<br />
(Figure 4). Wildland fuels do not cont<strong>in</strong>ue <strong>in</strong>to <strong>the</strong> developed area. The development<br />
density for an <strong>in</strong>terface condition is usually 3+ structures per acre. <strong>Fire</strong> protection<br />
is normally provided by a local government fire department with <strong>the</strong> responsibility<br />
to protect <strong>the</strong> structure from both an <strong>in</strong>terior fire and an advanc<strong>in</strong>g wildland fire<br />
(unless <strong>the</strong> l<strong>in</strong>e of demarcation is also a jurisdictional boundary).<br />
Intermix Condition – is a condition where structures are scattered throughout a wildland<br />
area (Figure 5). There is no clear l<strong>in</strong>e of demarcation; <strong>the</strong> wildland fuels are cont<strong>in</strong>uous<br />
outside of and with<strong>in</strong> <strong>the</strong> developed area. The development density <strong>in</strong> <strong>the</strong> <strong>in</strong>termix<br />
ranges from structures very close toge<strong>the</strong>r to one structure per 40 acres. <strong>Fire</strong><br />
protection districts funded by various tax<strong>in</strong>g authorities normally provide life and<br />
property fire protection, and may also have wildland fire protection responsibilities.<br />
Occluded Condition – is a situation, normally with<strong>in</strong> a city, where structures abut an<br />
island of wildland fuels (park or open space). There is a clear l<strong>in</strong>e of demarcation<br />
Figure 4. Interface Condition, where <strong>the</strong>re is a clear l<strong>in</strong>e<br />
between <strong>the</strong> structures and <strong>the</strong> wildland fuels.<br />
191
etween <strong>the</strong> structures and <strong>the</strong><br />
wildland fuels along roads or back<br />
fences. The development density<br />
for an occluded condition is<br />
usually similar to those found <strong>in</strong><br />
<strong>the</strong> <strong>in</strong>terface condition and <strong>the</strong><br />
occluded area is usually less than<br />
1,000 acres <strong>in</strong> size. <strong>Fire</strong> protection<br />
is normally provided by a local<br />
government fire department. The<br />
trend is for local government to<br />
require developers to <strong>in</strong>clude open<br />
space <strong>in</strong> <strong>the</strong>ir plans, but not<br />
<strong>in</strong>clude a long-term mechanism<br />
for <strong>the</strong>ir ma<strong>in</strong>tenance; thus <strong>the</strong><br />
hazardous fire condition <strong>in</strong>creases<br />
over time.<br />
Figure 6. Intermix Condition, where <strong>the</strong>re <strong>the</strong> structures are<br />
scattered throughout <strong>the</strong> wildland fuels.<br />
Rural Condition – is a situation where scattered small clusters of structures (ranches,<br />
farms, resorts, or summer cab<strong>in</strong>s) are exposed to wildland fuels (Figure 6). There may be<br />
miles between <strong>the</strong>se clusters. Structural fire protection service may not be available.<br />
These types of developments often exceed <strong>the</strong> capabilities of both <strong>the</strong> structural and<br />
wildland fire protection systems. Wildland fire protection agencies have little or no<br />
control over such development and may be unable to provide protection due to statutory<br />
barriers.<br />
Areas of Safe Refuge – an area of safe refuge is like a safety zone, a place where a<br />
person is safe from a fire. Communities can be designed <strong>in</strong> such a way to provide a<br />
place of refuge dur<strong>in</strong>g a wildland fire.<br />
Defensible Space - <strong>the</strong> area immediately around a structure where fuel needs to be<br />
reduced to allow firefighters to work safely.<br />
Figure 6. Rural Condition, where <strong>the</strong> structures or clusters of<br />
structures are situated <strong>in</strong> wildland fuels. These structures or<br />
clusters are often miles apart.<br />
Dwell<strong>in</strong>g Unit – is a house, home, apartment, etc. where humans reside. A motel or<br />
hotel room is not a dwell<strong>in</strong>g unit because <strong>the</strong> length of say is usually short-term.<br />
192
<strong>Fire</strong>-resistive Construction - is <strong>the</strong> use of materials and systems <strong>in</strong> <strong>the</strong> design and construction<br />
of a build<strong>in</strong>g or structure to safeguard aga<strong>in</strong>st <strong>the</strong> spread of fire with<strong>in</strong> a build<strong>in</strong>g or<br />
structure and <strong>the</strong> spread of fire to or from build<strong>in</strong>gs or structures to <strong>the</strong> wildland/urban<br />
<strong>in</strong>terface area.<br />
Hazard – <strong>the</strong> degree of flammability of <strong>the</strong> fuels once a fire starts. This <strong>in</strong>cludes <strong>the</strong> fuel<br />
(type, arrangement, volume, condition, etc.), topography and wea<strong>the</strong>r.<br />
Home or House – is usually a privately owned structure <strong>in</strong> which people live. It does not<br />
house more than one family.<br />
Home/Structure Ignition Zone - <strong>the</strong> area that pr<strong>in</strong>cipally determ<strong>in</strong>es <strong>the</strong> potential for ignition<br />
of <strong>the</strong> home/stucture from wildland fire. It <strong>in</strong>cludes <strong>the</strong> home/structure and its immediate<br />
surround<strong>in</strong>gs with<strong>in</strong> 100 to 200 feet.<br />
Ignition-Resistant Construction – <strong>in</strong>corporates <strong>the</strong> use of materials and design that enables<br />
a structure to withstand ignition from radiant heat, fire brands or direct flame imp<strong>in</strong>gement.<br />
Risk – <strong>the</strong> chance of a fire start<strong>in</strong>g from any cause.<br />
Structural <strong>Fire</strong> Protection – is def<strong>in</strong>ed as <strong>in</strong>terior and exterior actions taken to suppress and<br />
ext<strong>in</strong>guish a burn<strong>in</strong>g structure or improvement utiliz<strong>in</strong>g standard build<strong>in</strong>g fire protection<br />
methods, equipment and tra<strong>in</strong><strong>in</strong>g . Structural fire suppression is generally <strong>the</strong> responsibility<br />
of a local government entity, although <strong>the</strong>re are some locations <strong>in</strong> <strong>the</strong> <strong>West</strong> where <strong>the</strong>re is<br />
currently no structural fire agency <strong>in</strong> place.<br />
Structure – is a build<strong>in</strong>g, home, bus<strong>in</strong>ess, barn, etc., that is built with<strong>in</strong> one foundation/<br />
framework. An apartment build<strong>in</strong>g is a structure with multiple dwell<strong>in</strong>g units.<br />
Structure Protection – to protect structures from <strong>the</strong> threat of damage from an advanc<strong>in</strong>g<br />
wildland fire (Figure 11). This normally does not <strong>in</strong>clude an attack on fire that is <strong>in</strong>side <strong>the</strong><br />
structure. It <strong>in</strong>volves <strong>the</strong> use of fire control l<strong>in</strong>es (constructed or natural) and <strong>the</strong> ext<strong>in</strong>guishment<br />
of spot fires near or on <strong>the</strong> structure. This protection can be provided by <strong>the</strong><br />
193
ural and/or local government fire department firefighter and <strong>the</strong> wildland fire protection<br />
firefighter.<br />
Structures saved – a structure is considered saved if it is with<strong>in</strong> <strong>the</strong> exterior boundaries of <strong>the</strong><br />
fire or directly adjacent to <strong>the</strong> firel<strong>in</strong>e, and did not burn down or suffer serious damage as a<br />
result of <strong>the</strong> wildfire.<br />
Structures threatened – a structure is considered threatened if it is with<strong>in</strong> <strong>the</strong> exterior boundaries<br />
of <strong>the</strong> fire, or with<strong>in</strong> ¼-mile of <strong>the</strong> exterior boundary of <strong>the</strong> fire, or with<strong>in</strong> <strong>the</strong> fire<br />
behavior projection for <strong>the</strong> next 24-hours.<br />
Suppression – tak<strong>in</strong>g specific actions to control and ext<strong>in</strong>guish an unwanted wildland fire.<br />
Wildfire Causes – <strong>the</strong>re are three general causes of wildland fires, natural (lightn<strong>in</strong>g), accidental<br />
(debris burn<strong>in</strong>g, children with matches, etc.) and <strong>in</strong>tentional (arson).<br />
Wildland/urban <strong>in</strong>terface fire – is (1) a fire burn<strong>in</strong>g primarily <strong>in</strong> wildland fuels that threatens<br />
or destroys several structures; (2) That situation where <strong>the</strong> fuel feed<strong>in</strong>g <strong>the</strong> fire changes<br />
from wildland fuel to urban fuel. For this to happen, wildland fire must be close enough for<br />
fly<strong>in</strong>g brands and/or flames to make contact with flammable portion of homes/structures.<br />
Wildfire <strong>Fire</strong> Suppression Strategies – There are two general wildfire management<br />
strategies:<br />
194
Federal Land Ownership<br />
The federal government owns or controls 648,969,668 acres or 58 percent of <strong>the</strong> land <strong>in</strong> <strong>the</strong><br />
<strong>West</strong> (Tables 1 and 9). Each of <strong>the</strong> various federal agencies have different roles, missions, and<br />
responsibilities.<br />
USDA Forest Service - The Forest Service manages <strong>the</strong> 191 million acre National Forest<br />
System under pr<strong>in</strong>ciples of ecosystem management. The national forests conta<strong>in</strong> 140 million acres of<br />
forestland, with <strong>the</strong> rema<strong>in</strong><strong>in</strong>g acres <strong>in</strong> grasslands. The Forest Service owns 166.6 million acres <strong>in</strong><br />
<strong>the</strong> <strong>West</strong>. There are 184.6 million acres with<strong>in</strong> <strong>the</strong> various national forests. This <strong>in</strong>cludes 18 million<br />
acres of privately owned land (Table 2).<br />
USDI Bureau of Land Management - The BLM is responsible for <strong>the</strong> multiple-use management<br />
of natural resources on 270 million acres of public land and for supervis<strong>in</strong>g m<strong>in</strong>eral leas<strong>in</strong>g<br />
and operations on an additional 300 million acres of federal m<strong>in</strong>eral estate that underlies o<strong>the</strong>r<br />
surface ownership. BLM manages 262.7 million acres <strong>in</strong> 12 western states and Alaska (Table 3).<br />
Under federal regulations, all Public Doma<strong>in</strong> is “owned” by <strong>the</strong> BLM. O<strong>the</strong>r federal agencies (Fish<br />
and Wildlife Service, Department of Defense, etc.) manage millions of acres of Public Doma<strong>in</strong>.<br />
USDI Bureau of Indian Affairs - The BIA manages and protects natural resources on 46.6<br />
million acres <strong>in</strong> <strong>the</strong> <strong>West</strong>. There are three classifications for <strong>the</strong> lands <strong>the</strong>y protect: Tribal Lands -<br />
40.2 million acres; Individually Owned Lands - 6.1 million acres; and BIA owned lands - 288<br />
thousand acres (Table 4). The BIA provides a wide variety of community and social services,<br />
ma<strong>in</strong>ta<strong>in</strong>s law enforcement systems, and assists <strong>in</strong> agricultural, ranch<strong>in</strong>g, forestry, and m<strong>in</strong><strong>in</strong>g activities<br />
on reservations, and funds 187 BIA and tribal-operated schools <strong>in</strong> 24 states.<br />
USDI Fish and Wildlife Service - The FWS conserves, protects, and enhances fish and<br />
wildlife and <strong>the</strong>ir habitats. Management duties extend over 91 million acres of public land and<br />
<strong>in</strong>clude 494 national wildlife refuges, 32 wetland management districts, 84 fish hatcheries, 23 research<br />
centers, and 88 associated field stations. In <strong>the</strong> <strong>West</strong>, <strong>the</strong> Fish and Wildlife Service manage<br />
84.8 million acres, most of which is <strong>in</strong> Alaska and most of <strong>the</strong>m are <strong>in</strong> Public Doma<strong>in</strong> (Table 5). The<br />
FWS is responsible for adm<strong>in</strong>ister<strong>in</strong>g <strong>the</strong> Endangered Species Act and provid<strong>in</strong>g comments and<br />
consultations on water development and water quality under <strong>the</strong> Fish and Wildlife Coord<strong>in</strong>ation Act<br />
and section 404 of <strong>the</strong> Clean Water Act.<br />
195
Table 1 Federal Land Ownership Data<br />
Forest Service<br />
Department of Defense - The Department of Defense manages 25 million acres of public<br />
lands at 600 major <strong>in</strong>stallations <strong>in</strong> <strong>the</strong> United States, and 2 million acres abroad. In <strong>the</strong> <strong>West</strong>, <strong>the</strong><br />
Department of Defense protects 10.4 million acres, most of this land is owned by <strong>the</strong> Department of<br />
<strong>the</strong> Army (Table 6). The Department is an active steward of <strong>the</strong>se <strong>in</strong>stallations, which vary greatly <strong>in</strong><br />
size and use and conta<strong>in</strong> a rich diversity of flora and fauna. Army Corps of Eng<strong>in</strong>eers, which manages<br />
11.7 million acres of land and <strong>in</strong>land water areas, provides recreation opportunities at 463<br />
lakes throughout <strong>the</strong> United States. In <strong>the</strong> <strong>West</strong>, <strong>the</strong> Corps owns 31 thousand acres.<br />
USDI National Park Service - The National Park Service protects natural and cultural<br />
resources while promot<strong>in</strong>g outdoor recreation, historic preservation, and environmental awareness.<br />
The National Park Service owns and protects 69.6 million acres <strong>in</strong> <strong>the</strong> <strong>West</strong> (Table 7).<br />
O<strong>the</strong>r Federal Agencies - There are several o<strong>the</strong>r federal agencies (Bureau of Reclamations,<br />
Department of Energy, etc.) that own and manage over 8 million acres <strong>in</strong> <strong>the</strong> <strong>West</strong> (Table 8).<br />
Bur of Land<br />
Management<br />
Bur of Indian<br />
Affairs<br />
196<br />
Fish and<br />
Wildlife<br />
Service<br />
Areas, <strong>in</strong> acres.<br />
National<br />
Park Service<br />
Dept of<br />
Defense<br />
O<strong>the</strong>r<br />
Federal<br />
TOTAL<br />
Alaska 22,004,745 86,908,060 1,140,410 76,321,037 52,891,681 1,677,718 22,851 240,966,502<br />
Arizona 11,250,693 14,252,778 20,718,207 1,716,858 2,629,633 1,219,717 2,751 51,790,637<br />
California 20,627,691 14,556,074 191,020 323,642 4,615,013 1,753,493 434,695 42,501,628<br />
Colorado 14,501,592 8,296,512 32,835 81,574 574,689 415,473 358,175 24,260,850<br />
Hawaii 1 0 0 288,511 220,410 127,734 1,627 638,283<br />
Idaho 20,442,651 11,847,328 55,700 76,068 86,866 14,402 1,067,840 33,590,855<br />
Kansas 108,175 0 40,234 58,332 698 143,447 97,088 447,974<br />
Montana 16,872,610 8,060,382 1,074,907 1,153,013 1,221,314 2,540 316,204 28,700,970<br />
Nebraska 352,133 6,580 66,469 172,360 5,863 18,703 119,139 741,247<br />
Nevada 5,815,856 47,844,391 1,233,000 2,318,069 165,500 484,965 1,699,739 59,561,520<br />
New Mexico 9,326,599 12,770,569 8,349,148 384,251 371,827 3,180,226 453,865 34,836,485<br />
North Dakota 1,105,779 59,717 866,896 487,654 71,640 2,112 1,273,320 3,867,118<br />
Oregon 15,664,078 16,223,739 796,588 557,479 194,859 31,072 133,625 33,601,440<br />
South Dakota 2,013,628 279,869 5,002,056 198,086 263,629 890 60,455 7,818,613<br />
Utah 8,112,462 22,877,713 2,331,094 419,169 2,015,426 939,973 660,613 37,356,450<br />
Wash<strong>in</strong>gton 9,174,956 370,110 2,602,254 186,369 1,932,401 433,251 752,979 15,452,320<br />
Wyom<strong>in</strong>g 9,258,281 18,383,926 1,889,532 86,486 2,393,198 9,512 815,841 32,836,776<br />
TOTAL 166,631,930 262,737,748 46,390,350 84,828,958 69,654,647 10,455,228 8,270,807 648,969,668
Percent<br />
Federally<br />
Owned<br />
Lands<br />
Alaska<br />
Arizona<br />
California<br />
Colorado<br />
Hawaii<br />
Idaho<br />
Kansas<br />
Montana<br />
Nebraska<br />
Nevada<br />
New Mexico<br />
North Dakota<br />
Oregon<br />
South Dakota<br />
Utah<br />
Wash<strong>in</strong>gton<br />
Wyom<strong>in</strong>g<br />
65.93%<br />
71.25%<br />
42.41%<br />
36.49%<br />
15.55%<br />
63.46%<br />
0.85%<br />
30.77%<br />
1.51%<br />
84.77%<br />
44.80%<br />
8.70%<br />
54.55%<br />
15.99%<br />
70.89%<br />
36.19%<br />
52.67%<br />
197
Table 2 USDA Forest Service Land Ownership Data<br />
National Forest<br />
System (2.1)<br />
Area, <strong>in</strong> acres.<br />
O<strong>the</strong>r Lands (2.2)<br />
Total Gross Area<br />
(2.3)<br />
Percent Non-<br />
Forest Lands<br />
with<strong>in</strong> Nation<br />
Forests<br />
Alaska 22,004,745 2,350,390 24,355,135 9.65%<br />
Arizona 11,250,693 636,712 11,887,405 5.36%<br />
California 20,627,691 3,774,754 24,402,445 15.47%<br />
Colorado 14,501,592 1,550,266 16,051,858 9.66%<br />
Hawaii 1 1<br />
Idaho 20,442,651 1,229,036 21,671,687 5.67%<br />
Kansas 108,175 8,144 116,319 7.00%<br />
Montana 16,872,610 2,231,103 19,103,713 11.68%<br />
Nebraska 352,133 90,359 442,492 20.42%<br />
Nevada 5,815,856 459,457 6,275,313 7.32%<br />
New Mexico 9,326,599 1,040,110 10,366,709 10.03%<br />
North Dakota 1,105,779 4 1,105,783 0.00%<br />
Oregon 15,664,078 1,845,269 17,509,347 10.54%<br />
South Dakota 2,013,628 350,393 2,364,021 14.82%<br />
Utah 8,112,462 1,098,147 9,210,609 11.92%<br />
Wash<strong>in</strong>gton 9,174,956 894,472 10,069,428 8.88%<br />
Wyom<strong>in</strong>g 9,258,281 445,267 9,703,548 4.59%<br />
TOTAL 166,631,930 18,003,883 184,635,813 9.75%<br />
Source:<br />
Land Areas of <strong>the</strong> National Forest System, USDA Forest Service, FS-383, January 1996.<br />
Notes:<br />
2.1 - National Forest Service Lands are those lands owned by <strong>the</strong> Forest Service. This <strong>in</strong>cludes<br />
National Forest Lands, Purchase Units (Weeks Law), National Grasslands, Land Utilization<br />
Project Lands, Research and Experimental Lands, etc.) 2.2 - Private Lands, State Lands, or<br />
lands owned by ano<strong>the</strong>r federal agency. 2.3 - The total gross lands with<strong>in</strong> <strong>the</strong> exterior boundary<br />
(<strong>the</strong> black l<strong>in</strong>e on <strong>the</strong> adm<strong>in</strong>istrative map) of <strong>the</strong> National Forest.<br />
198
Table 3 USDI Bureau of Land Management Land Ownership Data<br />
Area, <strong>in</strong> acres.<br />
Vacant Public<br />
Lands Outside<br />
Graz<strong>in</strong>g Districts<br />
Vacant Public<br />
Lands With<strong>in</strong><br />
Graz<strong>in</strong>g Districts<br />
Land Utilization<br />
Project Lands<br />
O<strong>the</strong>r Lands<br />
Managed by BLM<br />
TOTAL<br />
Alaska 86,908,060 86,908,060<br />
Arizona 1,516,765 10,093,234 32,321 2,610,458 14,252,778<br />
California 7,363,543 1,725,343 5,467,188 14,556,074<br />
Colorado 480,331 6,781,734 36,206 998,241 8,296,512<br />
Hawaii 0<br />
Idaho 422,341 10,733,321 72,276 619,390 11,847,328<br />
Kansas 0<br />
Montana 1,148,321 4,940,802 1,801,171 170,088 8,060,382<br />
Nebraska 6,580 6,580<br />
Nevada 3,140,726 44,493,239 3,127 207,299 47,844,391<br />
New Mexico 1,355,577 11,047,165 229,500 138,327 12,770,569<br />
North Dakota 59,536 181 59,717<br />
Oregon 585,675 12,455,100 78,124 3,104,840 16,223,739<br />
South Dakota 272,277 7,592 279,869<br />
Utah 21,155,026 45,083 1,677,604 22,877,713<br />
Wash<strong>in</strong>gton 366,921 3,189 370,110<br />
Wyom<strong>in</strong>g 3,910,677 11,273,811 10,434 3,189,004 18,383,926<br />
TOTAL 107,537,330 134,698,775 2,308,242 18,193,401 262,737,748<br />
Source: Public Land Statistics 1997, USDI Bureau of Land Management, (BLM/BC/ST-98/001+1165), March 1998.<br />
199
Table 4 USDI Bureau of Indian Affairs Land Ownership Data<br />
Tribal Lands (4.1)<br />
Individually<br />
Owned Lands (4.2)<br />
Area <strong>in</strong> acres<br />
Bur of Indian<br />
Affairs Lands (4.3)<br />
TOTAL<br />
Percent<br />
Individually<br />
Owned Lands<br />
Alaska 83,880 1,056,530 1,140,410 92.64%<br />
Arizona 20,370,975 256,766 90,466 20,718,207 1.24%<br />
California 148,535 36,519 5,966 191,020 19.12%<br />
Colorado 14,882 17,946 7 32,835 54.66%<br />
Hawaii 254,418 35 91 254,544 0.01%<br />
Idaho 53,351 2,168 181 55,700 3.89%<br />
Kansas 10,841 29,357 36 40,234 72.97%<br />
Montana 822,088 252,060 759 1,074,907 23.45%<br />
Nebraska 23,174 43,288 7 66,469 65.13%<br />
Nevada 1,149,492 78,529 4,979 1,233,000 6.37%<br />
New Mexico 7,500,568 668,840 179,740 8,349,148 8.01%<br />
North Dakota 245,630 619,338 1,928 866,896 71.44%<br />
Oregon 666,106 130,466 16 796,588 16.38%<br />
South Dakota 2,617,895 2,381,516 2,645 5,002,056 47.61%<br />
Utah 2,297,770 33,237 87 2,331,094 1.43%<br />
Wash<strong>in</strong>gton 2,170,346 431,748 160 2,602,254 16.59%<br />
Wyom<strong>in</strong>g 1,794,589 93,647 1,296 1,889,532 4.96%<br />
TOTAL 40,224,540 6,131,990 288,364 46,644,894 13.15%<br />
Source:<br />
Acreage Recapitulations by State, USDI Bureau of Indian Affairs, December 1996.<br />
Notes:<br />
4.1 - Lands granted to <strong>the</strong> various tribes via treaties. 4.2 - Land owned by various private<br />
<strong>in</strong>dividuals. 4.3 - Land owned by <strong>the</strong> Bureau of Indian Affairs.<br />
200
Table 5 USDI Fish and Wildlife Service Land Ownership Data<br />
Reserved from<br />
Public Doma<strong>in</strong><br />
Acquired by o<strong>the</strong>r<br />
Federal Agency<br />
Devise or Gift<br />
Area, <strong>in</strong> acres.<br />
Purchased<br />
Agreement<br />
Easement or<br />
Lease<br />
TOTAL<br />
Percent of Land <strong>in</strong><br />
Public Doma<strong>in</strong><br />
Alaska 76,310,177 974 9,886 1,321 76,322,358 99.98%<br />
Arizona 1,575,940 16,714 1,200 123,004 1,576 1,718,434 91.71%<br />
California 148,535 36,519 5,966 132,622 104,787 428,429 34.67%<br />
Colorado 14,882 17,946 7 48,739 2,293 83,867 17.74%<br />
Hawaii 254,418 35 91 33,967 961 289,472 87.89%<br />
Idaho 53,351 2,168 181 20,368 13,186 89,254 59.77%<br />
Kansas 29,357 28,975 6 58,338 0.00%<br />
Montana 822,088 252,060 759 78,106 96,922 1,249,935 65.77%<br />
Nebraska 20,660 71,399 2,139 78,162 65,476 237,836 8.69%<br />
Nevada 2,236,672 4,139 77,258 1,019 2,319,088 96.45%<br />
New Mexico 72,981 439 220,216 90,615 767 385,018 18.96%<br />
North Dakota 18,538 150,103 4,175 314,838 916,513 1,404,167 1.32%<br />
Oregon 272,142 73,376 773 211,188 36,267 593,746 45.83%<br />
South Dakota 1,848 31,949 6,088 158,201 816,685 1,014,771 0.18%<br />
Utah 65,781 2,383 4,272 346,733 4,244 423,413 15.54%<br />
Wash<strong>in</strong>gton 42,652 75,757 791 67,169 11,161 197,530 21.59%<br />
Wyom<strong>in</strong>g 32,961 27,474 4,474 21,577 6,634 93,120 35.40%<br />
TOTAL 81,943,626 787,679 256,245 1,841,408 2,079,818 86,908,776<br />
Source: Annual Report of Lands Under Control of <strong>the</strong> USDI Fish and Wildlife Service, September 1997.<br />
201
Table 6 US Department of Defense Land Ownership Data<br />
Area, <strong>in</strong> acres.<br />
Dept of <strong>the</strong> Army Dept of <strong>the</strong> Navy<br />
Dept of <strong>the</strong> Air Corps of<br />
Force Eng<strong>in</strong>eers<br />
TOTAL<br />
Alaska 1,669,149 8,569 1,677,718<br />
Arizona 957,874 2,770 259,073 1,219,717<br />
California 975,018 726,570 46,636 5,269 1,753,493<br />
Colorado 414,345 1,128 415,473<br />
Hawaii 106,465 20,824 443 2 127,734<br />
Idaho 15 11,099 3,288 14,402<br />
Kansas 125,788 15 3,677 13,967 143,447<br />
Montana 2,120 420 2,540<br />
Nebraska 18,294 7 402 18,703<br />
Nevada 152,275 33,363 299,327 484,965<br />
New Mexico 3,163,121 1 17,104 3,180,226<br />
North Dakota 900 1,212 2,112<br />
Oregon 17,602 10,112 41 3,317 31,072<br />
South Dakota 12 878 890<br />
Utah 848,263 518 91,192 939,973<br />
Wash<strong>in</strong>gton 404,481 21,824 916 6,030 433,251<br />
Wyom<strong>in</strong>g 8,897 2 613 9,512<br />
TOTAL 8,864,619 816,006 742,730 31,873 10,455,228<br />
Source:<br />
Federally Owned Property <strong>in</strong> <strong>the</strong> United States, by State, Agency and Bureau, US General Service Adm<strong>in</strong>istration,<br />
October 1996.<br />
202
Table 7 USDI National Park Service Land Ownership Data<br />
Area, <strong>in</strong> acres.<br />
Alaska 52,891,681<br />
Arizona 2,629,633<br />
California 4,615,013<br />
Colorado 574,689<br />
Hawaii 220,410<br />
Idaho 86,866<br />
Kansas 698<br />
Montana 1,221,314<br />
Nebraska 5,863<br />
Nevada 165,500<br />
New Mexico 371,827<br />
North Dakota 71,640<br />
Oregon 194,859<br />
South Dakota 263,629<br />
Utah 2,015,426<br />
Wash<strong>in</strong>gton 1,932,401<br />
Wyom<strong>in</strong>g 2,393,198<br />
TOTAL 69,654,647<br />
Source: Federally Owned Property <strong>in</strong> <strong>the</strong> United States, by State, Agency and<br />
Bureau, US General Service Adm<strong>in</strong>istration, October 1996.<br />
Table 8 O<strong>the</strong>r Federal Agency Land Ownership Data<br />
Area, <strong>in</strong> acres.<br />
Alaska 22,851<br />
Arizona 2,751<br />
California 434,695<br />
Colorado 358,175<br />
Hawaii 1,627<br />
Idaho 1,067,840<br />
Kansas 97,088<br />
Montana 316,204<br />
Nebraska 119,139<br />
Nevada 1,699,739<br />
New Mexico 453,865<br />
North Dakota 1,273,320<br />
Oregon 133,625<br />
South Dakota 60,455<br />
Utah 660,613<br />
Wash<strong>in</strong>gton 752,979<br />
Wyom<strong>in</strong>g 815,841<br />
TOTAL 8,270,807<br />
Source: Federally Owned Property <strong>in</strong> <strong>the</strong> United States, by State, Agency and<br />
Bureau, US General Service Adm<strong>in</strong>istration, October 1996.<br />
203
Table 9 Percentage of State <strong>in</strong> Federal Land Ownership<br />
Forest<br />
Service<br />
Bur of Land<br />
Management<br />
Bur of<br />
Indian<br />
Affairs<br />
Fish and<br />
Wildlife<br />
Service<br />
National<br />
Park<br />
Service<br />
Dept of<br />
Defense<br />
O<strong>the</strong>r<br />
Federal<br />
Percent of<br />
State <strong>in</strong><br />
Federal<br />
Ownership<br />
Total Land <strong>in</strong><br />
State, <strong>in</strong> acres.<br />
Alaska 6.0% 23.8% 0.3% 20.9% 14.5% 0.5% 0.0% 65.93% 365,481,600<br />
Arizona 15.5% 19.6% 28.5% 2.4% 3.6% 1.7% 0.0% 71.25% 72,688,000<br />
California 20.6% 14.5% 0.2% 0.4% 4.6% 1.7% 0.4% 42.41% 100,206,720<br />
Colorado 21.8% 12.5% 0.0% 0.1% 0.9% 0.6% 0.5% 36.49% 66,485,760<br />
Hawaii 0.0% 0.0% 6.2% 7.1% 5.4% 3.1% 0.0% 15.55% 4,105,600<br />
Idaho 38.6% 22.4% 0.1% 0.2% 0.2% 0.0% 2.0% 63.46% 52,933,120<br />
Kansas 0.2% 0.0% 0.1% 0.1% 0.0% 0.3% 0.2% 0.85% 52,510,720<br />
Montana 18.1% 8.6% 1.2% 1.3% 1.3% 0.0% 0.3% 30.77% 93,271,040<br />
Nebraska 0.7% 0.0% 0.1% 0.5% 0.0% 0.0% 0.2% 1.51% 49,031,680<br />
Nevada 8.3% 68.1% 1.8% 3.3% 0.2% 0.7% 2.4% 84.77% 70,264,320<br />
New Mexico 12.0% 16.4% 10.7% 0.5% 0.5% 4.1% 0.6% 44.80% 77,766,400<br />
North Dakota 2.5% 0.1% 2.0% 3.2% 0.2% 0.0% 2.9% 8.70% 44,452,480<br />
Oregon 25.4% 26.3% 1.3% 1.0% 0.3% 0.1% 0.2% 54.55% 61,598,720<br />
South Dakota 4.1% 0.6% 10.2% 2.1% 0.5% 0.0% 0.1% 15.99% 48,881,920<br />
Utah 15.4% 43.4% 4.4% 0.8% 3.8% 1.8% 1.3% 70.89% 52,696,960<br />
Wash<strong>in</strong>gton 21.5% 0.9% 6.1% 0.5% 4.5% 1.0% 1.8% 36.19% 42,693,760<br />
Wyom<strong>in</strong>g 14.9% 29.5% 3.0% 0.1% 3.8% 0.0% 1.3% 52.67% 62,343,040<br />
TOTAL 1,317,411,840<br />
Source: Federally Owned Property <strong>in</strong> <strong>the</strong> United States, by State, Agency and Bureau, US<br />
General Service Adm<strong>in</strong>istration, October 1996.<br />
204
Wildland/Urban Interface <strong>Fire</strong> History<br />
(A wildland/urban <strong>in</strong>terface fire is def<strong>in</strong>ed as one that destroyed at least three structures and<br />
burned over 25 acres of wildland.)<br />
State Year <strong>Fire</strong> Name<br />
Alaska<br />
Arizona<br />
California<br />
Acres<br />
Burned<br />
Structures<br />
Lost<br />
1996 Prator Lake 120 3<br />
Miller's Reach #2 37,336 454<br />
2001 Red Fox 150 8<br />
2002 <strong>West</strong> Fork Chena 22,251 3<br />
Deaths<br />
1983 Pretzer 200 3<br />
1990 Dude 25,000 30 6<br />
1995 Oldt 100 14<br />
Bagdad 200 4<br />
1996 Po<strong>in</strong>ts 26 3<br />
1997 Kuyhendall 410 6<br />
2002 Bullock 30,563 7<br />
Rodeo/Chediski 468,638 496<br />
1955 Humboldt/Siskiyou 152,245 13<br />
Refugio 84,770 20<br />
1956 East Highlands 15,330 5 1<br />
Sherwood 9,428 8<br />
Newton 26,169 50<br />
Hume 1,940 9<br />
1960 Homstake 10,948 10<br />
1961 Harlow 41,200 106 2<br />
Bel Air 6,090 484<br />
1964 Hanley/Series 71,601 174<br />
Weldon/Series 11,650 20<br />
Coyote 67,000 94 1<br />
1965 Nor<strong>the</strong>rn Cal Series 113,766 41<br />
Suncrest 1,260 7<br />
1967 Sence Ranch 17,431 5<br />
Santa Susanna 25,000 10<br />
Paseo Grande 48,639 61<br />
Baliff 23,929 8 1<br />
Woodson 17,560 30<br />
1968 Louis 1,327 5<br />
1969 Walker 17,000 8<br />
1970 Statewide Series 567,508 722 19<br />
Reche 4,168 3<br />
Bear 53,100 54<br />
1972 Swasey 1,933 8<br />
Bradford 1,760 4<br />
1973 Boulder 8,478 17<br />
1975 Grundy 1,710 3<br />
Pendleton 2,400 10<br />
1976 Quarry 38,346 8<br />
Jacksonville 5,307 3<br />
Honey 1,482 3<br />
1977 Sycamore 804 234<br />
1978 Creighton Ridge 11,405 64<br />
Mandeville Canyon 5,500 18<br />
1979 Hesperia 1,525 25 1<br />
Nor<strong>the</strong>rn Cal Series 3,200 7<br />
Laurel Canyon 150 24<br />
Bernardo 9,000 10<br />
1980 Tower House 2,349 3<br />
Riverside 500 5<br />
Dry Flat 28,655 6<br />
Turner 28,000 7<br />
Indian 28,200 7<br />
Lakeland 8,400 4<br />
Stable 5,482 65<br />
Summit/Series 41,472 355<br />
205
Panorama 23,600 7<br />
Kiowa 2,440 11<br />
1981 Thunder 11,500 29<br />
Atlas Peak 22,000 69<br />
Flat 1,500 3<br />
Rieche/Series 29,704 6<br />
Swall 1,900 3<br />
Oat Mounta<strong>in</strong> 17,500 9<br />
Cow Mounta<strong>in</strong> 25,534 4<br />
1982 Gypsum 16,800 14<br />
Daydon Haul 57,000 65<br />
Dulzura 5,019 7<br />
1983 Porta Costa Series 325 10<br />
1985 Hidden Valley 1,250 20<br />
Eight-Mile 462 13<br />
Seco 1,954 3<br />
Gorda Rat 55,889 8<br />
Cherry 40,231 17<br />
Las Pilitas 74,640 41<br />
Pala 325 3<br />
Wheeler 120,000 26<br />
Miller 8,000 3<br />
Deer 520 8<br />
Delta 1,620 3<br />
Lafayette 100 3<br />
Lehr 200 64<br />
Page Mill 100 13<br />
1987 Dog Bar 362 9<br />
Stanislaus Complex 144,762 28<br />
Clark 37,530 4<br />
Gulch 6,800 6<br />
Yellow Complex 47,770 3<br />
Glasgow 13,370 3<br />
Salmon/St. Clair 8,600 35 1<br />
Post 546 3<br />
Baldw<strong>in</strong> Hills 500 21 2<br />
Morse (Pebble Beach) 160 37<br />
1988 Amador 600 3<br />
Railroad 10,750 15<br />
Mason 4,072 5<br />
Or<strong>in</strong>da 15 7<br />
Lake 10 4<br />
Miller 38,600 7<br />
49er 33,700 312<br />
State 1807 4,738 5<br />
Stagecoach 15<br />
Rosa 4<br />
Yucca 931 3<br />
Fern 7,790 58<br />
Preston 1,000 7<br />
Geysers 352 7<br />
PG E #19 8,648 3<br />
Miller 10,000 18<br />
1989 Kelly Ridge 4<br />
Highway 26 400 9<br />
Calaveras 425 4<br />
Powerhouse 11,680 22<br />
Olivas 813 3<br />
Eagle 4,600 3<br />
Poppet 1,328 3<br />
Ortega 6,100 13<br />
San Benito 52 7<br />
Joshua 690 6<br />
San Mart<strong>in</strong> 375 17<br />
Two Rock 161 7<br />
Greenwood Series 159<br />
Tuttletown 740 8<br />
1990 Monterey 18 8<br />
Pa<strong>in</strong>t 4,900 641 1<br />
Carbon Canyon 6,640 14<br />
206
Bedford 490 20<br />
Glendale 75 50<br />
Cottonwood 5<br />
A Rock 12,136 66<br />
P<strong>in</strong>e 125,892 27<br />
Long Gulch 2,100 3<br />
Knoll 300 7<br />
1991 Fiddle 20 3<br />
Tunnel 1,600 2900 25<br />
1992 Borax 1,920 15<br />
Jay 550 3<br />
Maidu 675 10<br />
Villa 6,700 19<br />
Fawn 350 13<br />
Founta<strong>in</strong> 63,960 636<br />
Cleveland 24,580 26 2<br />
Moccas<strong>in</strong> 8,370 6<br />
Clear 190 5<br />
Idaho 50 4<br />
1993 Greenmeadow 40,051 66<br />
K<strong>in</strong>neloa 5,715 149 1<br />
Stagecoach 546 8<br />
Mill Creek 4,680 6<br />
California 25,100 107<br />
Ortega 21,392 15<br />
Guejito 20,722 9<br />
Laguna Canyon 14,808 366<br />
Topanga 16,885 300 3<br />
Reppier 5,956 15<br />
Old Coach 2,139 36<br />
1994 Kelsey 860 33<br />
Raulson 1,000 13<br />
Bailey 7,000 8<br />
Broens 1,650 4<br />
Creek 442 3<br />
Highway 41 48,531 37<br />
Lakeland 2,400 8<br />
Scout 3,023 9<br />
Lucas 8,464 40<br />
Hemet Complex 19,200 14<br />
1995 Jenny 420 6<br />
Sycamore 10,000 3<br />
Warners 2,400 20<br />
Riverside 5,000 6<br />
Bluff 2,624 3<br />
Vision 12,354 45<br />
Lopez 1,985 4<br />
1996 Ellis 43 6<br />
State 837 653 5<br />
Weber 360 4<br />
State 165 3<br />
Dove 930 3<br />
Riverside 40 3<br />
Pechanga 1,336 3<br />
Gifford 31 3<br />
PGE #8 80 5<br />
Stumpfield 3,000 43<br />
Lightn<strong>in</strong>g #29 7,000 20<br />
Peachland 25 4<br />
Highway 58 33,094 13<br />
Riverside 1,210 6<br />
Harmoney 8,592 110<br />
R<strong>in</strong>con 1,800 6<br />
Calabasas 13,010 6<br />
1997 Riverside 320 3<br />
Grove 1,235 3<br />
Calimesa 377 9<br />
Priest 250 10<br />
Wohlford 457 8<br />
Pamela 25 3<br />
207
Pauba 7,800 10<br />
Wildwood 940 6<br />
Poppet 1,500 5<br />
William 5,810 85<br />
1998 Juniper 6,000 89<br />
Edna 28,164 5 1<br />
Taylor 2,160 5 1<br />
Bitterwater Valley 420 5<br />
1999 Lowen 2,000 23<br />
Dunstone 268 3<br />
Bloomer #3 2,590 9<br />
Musty #3 7<br />
Willow 21,900 60<br />
Canyon #4 2,580 230<br />
Rumsey 3,015 6<br />
Shockey 3,885 3<br />
Oregon 280 5<br />
Jones 26,202 264<br />
2000 Manter 72,750 16<br />
Berryessa 1,731 15<br />
Morgan 3,316 3<br />
Happy 5,500 3<br />
Union 350 5<br />
2001 Viejas 2,300 16<br />
Stimpson 100 4<br />
Jackson 2,240 15<br />
Creek 11,095 43<br />
Leonard 5,167 22<br />
North Fork 475 3<br />
Bus 242 12<br />
Oregon 1,680 33<br />
Poe 8,333 170<br />
Bell 1,204 5<br />
Trough 24,970 30<br />
Highway 4,125 8<br />
Colorado<br />
Star 16,761 4<br />
Stables 6,544 4<br />
2002 Galvilan 5,763 43<br />
Troy 1,180 3<br />
Loza 60 3<br />
Hwy 58 1,380 6<br />
P<strong>in</strong>es 61,690 160<br />
Croy 3,127 34<br />
P<strong>in</strong>e 1,200 7<br />
Arrowhead 2,688 7<br />
Wolf 21,645 6<br />
Copper 23,407 26<br />
Borel 3,430 19<br />
Copo 1,460 3<br />
Louisiana 6,574 7<br />
Deer 1,800 94<br />
McNally 150,696 17<br />
Curve 20,857 73<br />
Leona 5,124 16<br />
Sierra 594 21<br />
Williams 38,094 77<br />
1989 Black Tiger 2,000 44<br />
1990 Old Stage 2,000 10<br />
1994 Hour Glass 1,275 13<br />
Wake 3,846 3<br />
1996 Buffalo Creek 10,000 10<br />
1999 Monument 100 9<br />
2000 Bobcat 10,600 22<br />
High Meadow 10,927 51<br />
Pony 5,240 4<br />
2002 Big Fish 17,056 8<br />
Coal Seam 12,209 43<br />
Hayman 137,760 600<br />
208
Hawaii<br />
Idaho<br />
Kansas<br />
Iron Mounta<strong>in</strong> 4,439 201<br />
L<strong>in</strong>coln Co Complex 10,000 17<br />
Long Mesa 2,601 7<br />
Million 9,346 13<br />
Missionary Ridge 70,662 77<br />
Valley 393 6<br />
Panorama 1,700 6<br />
Schoonover Gulch 3,860 13<br />
2000 Puu Kapu 4,500 3<br />
1989 Lowman 46,000 25<br />
1991 Hauser Lk Complex 1,700 5 1<br />
2000 Clear Creek 126,000 10<br />
Burgdorf Junction 64,666 19<br />
Fisher Spr<strong>in</strong>gs 22,000 4<br />
Lookout Po<strong>in</strong>t 4,000 3<br />
Trail Creek 34,759 30<br />
SCF Wilderness 171,560 22<br />
North Fork Wilderness 14,506 5<br />
Indian/Prospect 11,100 3<br />
Morse 4,275 3<br />
Information is not available.<br />
Montana<br />
1977 Pattee Canyon 1,200 7<br />
1983 Baney Coulee 2,500 3<br />
1984 Houghton Creek 12,061 3<br />
Hawk Creek 180,508 44 1<br />
1988 Red Bench 14,000 24<br />
Storm Creek 30,000 12<br />
Canyon Creek 120,000 6<br />
Nebraska<br />
Nevada<br />
New Mexico<br />
Whitehall 1,630 3<br />
1991 Holter Lake 125 3 2<br />
1998 Shepard Mounta<strong>in</strong> 30,000 34<br />
1999 NE Corner 3,917 10<br />
Fishel Creek 28,155 5<br />
Anelope 7,240 20<br />
Outlook 6,952 10<br />
2000 Canyon Ferry 43,922 50<br />
Fort Howes 55800 4<br />
Average Bad Day 1,310 11<br />
Monture/Spread Ridge 21,800 4<br />
Hell Creek 750 3<br />
Valley Complex 173,563 227<br />
Thursday 750 3<br />
Blodget Trailhead 10,764 8<br />
Gilger 640 3<br />
Maloney Creek 72,000 12<br />
Boulder Complex 12,604 9<br />
Skalkaho Complex 64,794 4<br />
2002 Piskun 5,000 4<br />
1999 Thedford 75,000 15<br />
1994 Crystal Peak 7,310 3<br />
1996 Autumn Hills 3,800 4<br />
1999 Spr<strong>in</strong>g Creek 200 2<br />
2000 Coyote 15,000 3<br />
South Cricket 65,000 5<br />
1974 Spr<strong>in</strong>g 14,500 45<br />
1993 Burgett 5,350 8<br />
1996 Hondo 7,651 32<br />
209
North Dakota<br />
Oregon<br />
2000 Cree 6,488 3<br />
Scott Able 16,034 64<br />
Manuelitas 1,410 4<br />
Cerro Grande 47,650 350<br />
Viveash 28,283 4<br />
2002 Kokopelli 986 29<br />
Penasco 15,904 12<br />
Lakes Complex 4,096 4<br />
1999 Gap 69,000 16<br />
2002 Manvel 5,750 7<br />
Kraft Complex 35,100 17<br />
1975 Ten Mile Valley 232 4<br />
1987 Bland Mounta<strong>in</strong> 9,593 35<br />
1988 Milepost 70 160 4<br />
1990 Awbrey Hall 3,353 26<br />
1992 East Evans Creek 10,135 5<br />
Sage Flat 1,095 6<br />
1994 Blackwell Road 65 14<br />
Hull Mounta<strong>in</strong> 7,990 44<br />
1996 Wheeler Po<strong>in</strong>t 14,960 11<br />
Skeleton 17,736 36<br />
1998 Lone P<strong>in</strong>e 5,290 3<br />
2000 East Complex 45,000 3<br />
2001 Middle Fork 50 3<br />
Quartz 6,102 5<br />
2002 Flagtail 8,000 3<br />
W<strong>in</strong>ter 33,894 5<br />
Squire 2,804 6<br />
Shelton Ridge 12,681 6<br />
Biscut 499,945 13<br />
Eyerly 23,573 37<br />
South Dakota<br />
Utah<br />
Wash<strong>in</strong>gton<br />
Wyom<strong>in</strong>g<br />
1959 Deadwood 2,500 60<br />
1988 <strong>West</strong>berry Trails 3,840 57<br />
2000 Flagpole Mounta<strong>in</strong> 7,800 4<br />
Jasper 82,600 3<br />
2002 Grizzly Gulch 11,589 7<br />
Battle Creek 12,450 3<br />
1990 Wasatch 43 2<br />
2000 Box Canyon 200 3<br />
2002 East Fork 14,208 55<br />
1985 Barker Mounta<strong>in</strong> 60,000 4<br />
1987 Hangman Hills 1,500 24<br />
1988 D<strong>in</strong>kleman 50,000 3<br />
1991 <strong>Fire</strong>storm 91 350,000 191 1<br />
1992 Castle Rock Canyon 5,400 24<br />
1994 Chelan/Leavenworth 58,000 54 1<br />
1996 Bowie Road 3,020 7<br />
1997 Red Lake 1,151 5<br />
1998 Cleveland 118,500 14<br />
2000 Rocky Hill 9,404 37<br />
Goodnoe 4,800 3<br />
Mule Dry 76,800 25<br />
Eastside Complex 5,924 3<br />
2002 Deer Po<strong>in</strong>t 42,674 5<br />
1988 Clover-Mist 319,575 14<br />
North Fork 531,182 7<br />
2002 Hensel 14,730 7<br />
210
About <strong>the</strong> Authors<br />
William C. Teie retired from <strong>the</strong> California Department of <strong>Forestry</strong> and <strong>Fire</strong> Protection (CDF)<br />
after a successful 34-year career. He worked up through <strong>the</strong> ranks from seasonal firefighter to Deputy<br />
Director for <strong>Fire</strong> Protection. In this position, he was responsible for all of <strong>the</strong> fire protection programs<br />
with<strong>in</strong> CDF.<br />
Chief Teie was very active <strong>in</strong> <strong>the</strong> California fire service. He was on several statewide boards and<br />
committees and was elected President of <strong>the</strong> California <strong>Fire</strong> Chiefs Association <strong>in</strong> 1986. He is a member<br />
of <strong>the</strong> National <strong>Fire</strong> Protection Association and <strong>the</strong> Institute of <strong>Fire</strong> Eng<strong>in</strong>eers, an <strong>in</strong>ternational organization<br />
based <strong>in</strong> <strong>the</strong> United K<strong>in</strong>gdom.<br />
He is <strong>the</strong> author of <strong>the</strong> Wildland <strong>Fire</strong>fight<strong>in</strong>g Fundamentals, <strong>Fire</strong>fighter’s Handbook on Wildland<br />
<strong>Fire</strong>fight<strong>in</strong>g, and <strong>Fire</strong> Officer’s Handbook on Wildland <strong>Fire</strong>fight<strong>in</strong>g and has developed several<br />
o<strong>the</strong>r tra<strong>in</strong><strong>in</strong>g and operational aids for <strong>the</strong> firefighter. He has just completed <strong>the</strong> adaptations of several of <strong>the</strong>se handbooks<br />
for use <strong>in</strong> <strong>the</strong> Republic of South Africa.<br />
Brian F. Wea<strong>the</strong>rford retired from CDF after a 35-year career that <strong>in</strong>cluded fight<strong>in</strong>g fires from<br />
Alaska to Mexico and from Montana to California. He rose through <strong>the</strong> ranks from firefighter to fire<br />
chief and at <strong>the</strong> time of his retirement commanded an organization <strong>in</strong>clud<strong>in</strong>g three county fire departments<br />
and two city fire departments with 62 fire stations, 88 eng<strong>in</strong>e companies and nearly 900 paid and<br />
volunteer firefighters.<br />
He currently provides consult<strong>in</strong>g services to local government agencies <strong>in</strong> <strong>the</strong> areas of fire protection<br />
plann<strong>in</strong>g, budget development, organizational <strong>the</strong>ory, and management audits for specialized services,<br />
but only to <strong>the</strong> extent that <strong>the</strong>se projects do not <strong>in</strong>terfere with his primary avocation of fish<strong>in</strong>g.
Deer Valley Press<br />
5125 Deer Valley Road, Rescue, CA 95672<br />
(530) 676-7401 Fax (530) 676-7418<br />
www.deervalleypress.com